ADAUSD Is Set for a PullbackIt is not unlikely that the 3.00 psychological mark is causing the pullback. That being said, if the price breaks to the lower side of the pattern, you can see support at 2.53. If this price breaks to the upside of the pattern, the march continues. Keep in mind, if the price breaks to the downside and tests support, this is not a band thing, you want to see this type of pullback for further consolidation. It is part of any heathy price movement. It the price breaks to the downside, this does not mean there is a trend reversal, just that more consolidation is needed to push higher. Which is something I have been asking for, for the past few days now. However, if there is a reason for me to think there is a trend reversal, I will let you know. the last smaller cup and handle confirmed a price of 2.94.
Now lets talk about why ADA has so much strength. Cardano is about to release smart contract September 12 with the Alonzo release. This addition makes it a viable competitor to ETH as an open source platform. Right now, it is just a glorified ledger. As a person who plans to be a Cadano Developer once Alonzo is released, it makes me wonder how far ADA can go. I have heard people say it cannot go to 100 dollars because it will need around a 3T market cap. But considering in the past 2 weeks ADA has added 31B to its market cap, it's definitely not out of the realm of possibility. Also, considering Grayscale Investments has picked it up, I think it has a LOT more room to grow.
Tell me what you think?
This is not financial advice. DYODD.
Feel free to like this chart and follow me. All the support is welcomed. Thanks again! GLHF.
Breakout-pullback

USDCHF - Break of important Consolidation - Where to get in?Hi Traders!
The market is moving in a shortterm Downtrend, but it is actually
in a longterm (daily) symmetrical Triangle.
Please consider the screenshot for more details.
If you have any questions, don't hesitate to write them into
the comments or to make a message.
Also, if you want more information about any detail above.
--
The market broke out of this important Consolidation.
We can see the bearish strength based on the last strong Down-Movement.
But not everyone got into this trade.
And as we don't want to chase the market --> we have to wait for a Pullback.
The question is: Where is the next Area to get in?
Of course, one possibility is to wait for the retest of the Support Break.
But sometimes - or even often - the market doesn't pullback so much
- and especially during times of high bearish momentum.
An alternative is to consider the Trendline.
We have three points from where the market turned (in the consolidation), which are all at one
line - so we draw this descending Trendline.
This could be a possible Entry, which is a logical Entry, a Pullback and on a reachable distance.
Thanks and successful Trading :-)!

EthereumBINANCE:ETHUSDT
Luckily friends see that atrium descending channel upwards
It is broken and the downtrend is ending and the price
Pullback is being formed on the roof of the canal and after completion
Price pullback can grow up to 2400 ranges
And the break of the 2400 area upwards shows the end of the downtrend as a whole

LINK/USDT Time Frame DailyBINANCE:LINKUSDT
To find strong support and resistance we can go to Time
Look at the frames above and we can see the price on
An important support is fluctuating and if the candlestick is the last one
If the positive Doji closes, the price can return to the upside
And the range of 20,000 is a strong resistance that breaks this area
It causes good growth for this currency.

#Torrentpharma Break out on Daily #sharemarketTorrent pharma has moved out of triangle and then shown the retracement too. I can see it going north.
Simple price action, no Jazz

JICPT| Tesla in the battle zone, buy the dip or breakout! Hello everyone. I managed to predict the price movement of Tesla in my previous idea titled "Tesla reacted to my zone, on the way to upside!".
In my post, I explained why I recommended the bullish setup and suggested to close partial position in the battle zone where price has been consolidated for the past 6 days.
Why did I call it a battle zone? The fib structure leaded me to such guessing. Sometimes I'm wrong due to market mood or news. What I want to say is that it's okie to be wrong as traders as long as you can manage your risk. Nobody can be right 100% of the time.
If you check my published ideas, I've been wrong about gold, half wrong about EURUSD. Some ideas prior to those two worked well. Guess what? I don't care, because my mentor told me I should always focus on the next trade! Traders need to deal with misprediction everyday. What made us become an excellent trader is the robust discipline .
Sorry, I'm a bit off track. My trade plan goes like below:
1. Breakout trade: it's a bit aggressive. Price goes up after consolidation .
2. pullback trade: 610-623 is a nice zone for re-entry due to the flip structure formed.
Focus on the process and money will come to you .
Give me a like if you're with me.

EURJPY - Bullish Breakout Opportunity The EURJPY has recently broken out of both a period of consolidation as well as a previous level of resistance & I'm now looking for a bullish continuation up to the 132.50's level. After the initial break I'd hope to see some relief in price in a form of a pullback back into the level of structure that was just broken & that's where I'll be looking for my entry for a potential move higher.
Originally I was looking for the 132.60's level which is a power level of past structure but seeing how a 1.618 fibonacci extension rests right below that level I see that has the safer area.
Question or comments, please leave them below and I hope you guys enjoy!
Akil

EUR/GBP SUPPORT BREAKOUTEUR/GBP support breakout and pullback. The next support, 0.84800, can be expected

4H BTCUSDT long setup; C-fork trendline retest before bull cont.TA explained
C-Fork long setup for BTC. Waiting for the pullback of the broken descending trendline to get the trade activated. Entry range is covering Fib 0.382 to 0.786 levels, so we can expect at least the upper entry to get hit.
SL is placed below the latest low. If prices reaches there again, the new local upward trend (HH --> HL) would be invalidated. The target to aim for based on the C-Fork setup is the FIB 0.618 level so we took it as second target.
Trade setup
Best entries: 36051 - 38576
TP1: 43361
TP2: 46984
TP3: 49996
SL: 33950
RR: 3.75
Max leverage: 2x
—————
Do Your Own Research (of course)
Trade at own risk (of course)
Only trade what you can afford to lose (of course)

NXTUSDT/1Dbreakout + pullback on strong up trend is a good news for long entry if ya want to hold it for a long time.
That's it!

XRP/USDTXRPUSDT [/symbol
To enter first, you must wait for the roof to break
And after the failure see that the price above the ceiling stabilized
And after pullback you can enter these three points
Observe the stop loss you can go to
Make a profit


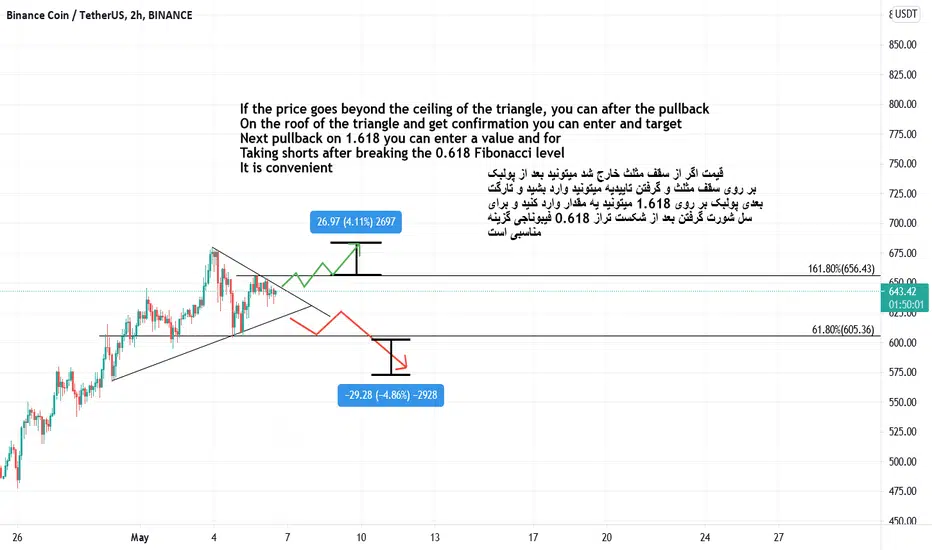
BNB/USDT triangleBNBUSDT
If the price goes beyond the ceiling of the triangle, you can after the pullback
On the roof of the triangle and get confirmation you can enter and target
Next pullback on 1.618 you can enter a value and for
Taking shorts after breaking the 0.618 Fibonacci level
It is convenient
NAS100USD break a supportNASDAQ break a support and its going to pull back to that support and then begin a downtrend.

ACTUSDT/1DAYSharp rise will possible after breakout from up trend. Maybe we're gonna see pullback on up trend and maybe not but I think we will see it.

BZRX/USDT : Targeting next major resistance after a retest... BINANCE:BZRXUSDT
Hello everyone 😃
BZRX had a pullback from it's broken bearish trendline.
Now there are two located zones.
- Heavy support zone which is acted as a great reversal point..
- new resistance zone which formed cause of recent rejections on daily candles..
MA 50 has reached movement and it was control movement as a support !
Also there is a bullish trendline which has approached movement already.
📌 Bullish factors are winning in this scenario but the last thing is BTC.
🔴 60K is an important resistance for BTC;
Any minor rejection can change the market's direction for couple of months !!
Attention: this isn't financial advice we are just trying to help people on their own vision.
Have a good day!
@Helical_Trades

AUD/USD D1As you can see from the chart above, the price was in the retracement phase, but on the last week it could break the MS to the upside, take off previous highs and break through the consolidation zone. This week we expect a little pullback to the breaking point of the trendline and retest the support zone, which was a resistance in the past.
Stay tuned. We will update you on Tuesday and give a valid trading setup.

TESLA Breakout And Pullback! Buy!
Hello,Traders!
TESLA broke the horizontal resistance level
And we can see that the stock is now retesting this level
But this time as a support
And I think this is a perfect time to buy
As the stock will most likely go up
Buy!
Like, comment and subscribe to boost your trading!
See other ideas below too!

ALPHA/USDT : Confirmed breakout on low TF BINANCE:ALPHAUSDT
Hello everyone 😃
ALPHA had a breakout in low TF and it's holding above support zone.
Volatility was at sell limit and now it's at neutral level..
There's a chance for ALPHA to retest support line again.
📌 1.53$ support line is heavy, There is a possibility for ALPHA to hold above it !!
Attention: this isn't financial advice we are just trying to help people on their own vision.
Have a good day!
@Helical_Trades

🎯Buying opportunity in ENJUSDT🚀Entry: 3.11 to 3.22
Stop Loss: 2.79
Target #1: 3.54
Target #2: 3.75
Target #3: 3.99
❗️Conduct your own due diligence.
❗️I am not a licensed qualified investment advisor. I am an amateur investor. All the ideas, & opinions are for informational, and educational purposes only.
❗️While the information provided is believed to be accurate, it may include errors or inaccuracies.


TRXEOS/1DAYI THINK PRICE WILL BE ABLE TO REACH 0.015324113 AND then if we'll see breakout from resistance line plus pullback then 2nd long entry will possible on top of our 2nd target is 0.02209515 .

STEEMUSDTAfter we saw Golden Cross, 2nd long entry will possible when price going to breakout from up trend.
Entry on pullback is better and I will expect we going to have a sharp movement.
