Bitcoin - Make it or break itBTC is at a level that will define whether we enter a bear market or a bull market. A Dip to the downside may cause a cascade effect that can take the market lower than expected. However, the majority of the signs in the market structure, momentum, and tradfi suggest that up is to be expected. To get shaken out with the evidence. Watch out for this bullish response if it does not produce something favorable, embrace for impact.
Btc-bitcoin
$BTC / $GOLDThe Golden age will fade in the shadow of Bitcoin
The Bitcoin/Gold pair maintains its major uptrend, with the price trapped between the 2021 ATH resistance and the uptrend.
As it does before every strong run, it's holding above the demand zone.
Once the 2021 ATH resistance (supply zone) is broken, Bitcoin will continue to change not only the pair's price against gold but also its perceptions.
Be prepared… a face melting move is coming soon.

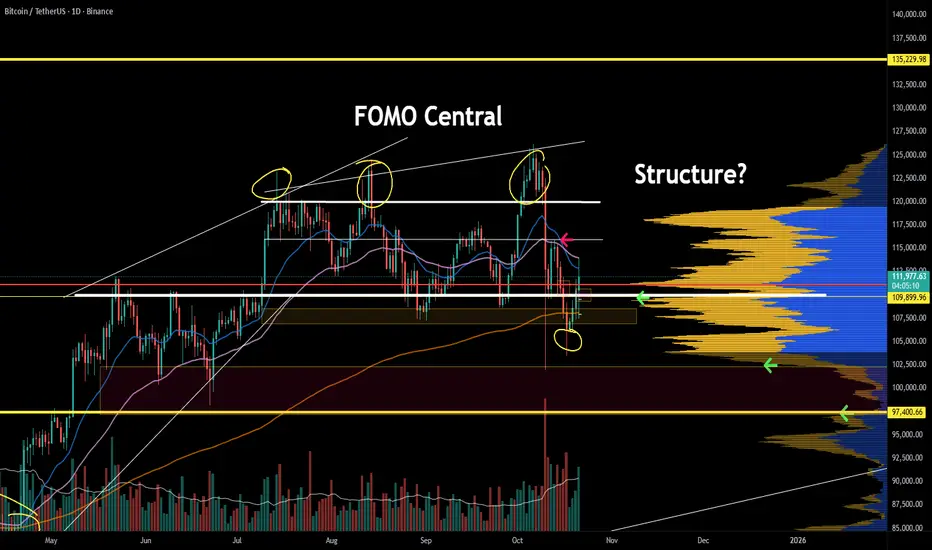
Inverse Head & Shoulders on Bitcoin – Breakout or Bull Trap?Right now, Bitcoin ( BINANCE:BTCUSDT ) is moving within its Heavy Support zone($111,980-$105,820) .
Over the past couple of days, it tried twice to break this area but couldn’t. One big reason is that recently, there was news that Japan is considering allowing banks to invest in crypto . Also, yesterday, Trump confirmed he’ll meet with China’s president on October 31st , which the market took as a positive sign that US-China tensions might ease. Previously, the market dropped on news of potential tariffs, and now it’s reacting to the possible easing of those tensions.
In the last 24-48 hours , Bitcoin has formed an inverse head and shoulders pattern , which could signal a short-term bullish reversal. However, there are still important resistance levels and cumulative short liquidation areas overhead. We need to see if Bitcoin can break through those.
From an Elliott Wave perspective, Bitcoin still seems to be in a corrective structure, and until it gets above around $116,000 , there’s still a risk of further downside. So we shouldn’t get too excited about the recent 48-hour bounce.
In short, I expect Bitcoin might push up to those Resistance lines , the Resistance zone($114,300-$113,000) , and Cumulative Short Liquidation($115,241-$113,454) , thanks to the inverse head and shoulders, but it could face resistance there and possibly drop again.
Note: It seems that we may see an increase in Bitcoin with the opening of the US market, but because the SPX500 index( SP:SPX ) is in a correction situation, we can expect Bitcoin to fall again.
Note: Crypto market conditions depend on many parameters these days, and be sure to observe capital management.
New CME Gap: $107,690-$107,220
Cumulative Long Liquidation: $107,000-$105,782
Cumulative Short Liquidation: $112,241-$111,398
Please respect each other's ideas and express them politely if you agree or disagree.
Bitcoin Analysis (BTCUSDT), 1-hour time frame.
Be sure to follow the updated ideas.
Do not forget to put a Stop loss for your positions (For every position you want to open).
Please follow your strategy and updates; this is just my Idea, and I will gladly see your ideas in this post.
Please do not forget the ✅' like '✅ button 🙏😊 & Share it with your friends; thanks, and Trade safe.

BTC - History Doesn’t Repeat, But It Rhymes!Bitcoin has always been a market of patterns, and when you zoom out, the weekly chart tells a familiar story.
🏹 Each major bull cycle follows a similar rhythm : a strong rally, a sharp correction, a fakeout below support, and then another impulsive leg higher.
We’ve seen this movie before. In 2023, BTC broke its structure briefly before continuing its climb. Again in 2024, the market dipped below the trendline, shaking out late buyers, only to bounce and push to new highs. Now, in 2025, we’re testing that same rising trendline once again, showing another possible “fakeout before takeoff” scenario.
🔄If history continues to rhyme, this pullback could mark the final correction before BTC resumes its journey toward the upper boundary of the rising channel - possibly into the 150K–160K zone over the next phase.
But if this time is different and BTC fails to reclaim the trendline, we could witness a longer consolidation phase before the next major impulse.
The key remains the same: watch the weekly close around the trendline. Each time BTC dipped below and reclaimed it, the next move was explosive.
History might not repeat perfectly - but it tends to rhyme beautifully.
📊All Strategies Are Good; If Managed Properly!
~Richard Nasr

BTCUSD - Sideways / Down Movement Leading to AltsznIt may be time for alts to shine.
I dont think price for BTC will reach the red area this bull run
The action for BTC may move sideways for awhile, this is the time when alts usually pump.
From there I expect movement back to the green buy zone, a retest of the prior ATH last Bullrun.
Daily chart here.

BTC 1H Analysis | Day 6🥳 Hey everyone! Hope you’re doing great! Welcome to SatoshiFrame channel.
✨ Today we’re diving into the 1-Hour Bitcoin analysis. Stay tuned and follow along!
👀 After faking the 111377$ resistance area, Bitcoin ran its stop-hunts and then moved toward its supports. In the process, after breaking the 109383$ support, it headed toward its current support in the 107508$ price area.
🔍 The exhaustion of buyers’ strength and the unusual participation of TakerSeller at the 111377$ price caused selling pressure on Bitcoin, making sellers the winners from that area. Bitcoin is now near its support, and the next resistances are at 109383$ and 111377$. With a break of these zones, it can move further upward.
🧮 On the RSI oscillator, we see that after losing the 50 zone, it moved strongly toward the oversell area and stayed there for a very short time—so short that we can call it a fakeout—and it formed a low near the 30 area. Now, losing the 30 zone and entering Oversell can be a confirmation for more selling pressure. The RSI resistance zone is at 50, and once the oscillation range passes above this zone, long-side momentum increases.
🕯 We’re going to check volume to understand better and get more data. After approaching its resistance, Bitcoin was accompanied by a decrease in buy volume, and subsequently sellers took control of the market; with increasing sell volume, Bitcoin’s price moved downward.
🧠 For a Bitcoin position we have 2 scenarios on the table that, if they occur, we can evaluate a position.
🟢 Long scenario: Break of the 109383$ resistance area and the oscillation limit crossing above the RSI 50 zone, together with increasing buy volume, with maker buyers also participating in this scenario for a price jump.
🔴 Short scenario: Break of the current support along with more selling pressure on Bitcoin, losing the 30 oscillation zone and RSI entering the oversell area.
❤️ Disclaimer : This analysis is purely based on my personal opinion and I only trade if the stated triggers are activated .

gold\btcI don't understand this...
If gold protects against inflation, why is it losing so much value against Bitcoin?
Conspiracy theorists, the stage is yours 👀

BITCOIN SIGNAL: HUGE WHALE GETTING READY TO DO THIS NOW!!(scary)Yello Paradisers, enjoy the video!
And Paradisers! Keep in mind to trade only with a proper professional trading strategy. Wait for confirmations. Play with tactics. This is the only way you can be long-term profitable.
Remember, don’t trade without confirmations. Wait for them before creating a trade. Be disciplined, patient, and emotionally controlled. Only trade the highest probability setups with the greatest risk to reward ratio. This will ensure that you become a long-term profitable professional trader.
Don't be a gambler. Don't try to get rich quick. Make sure that your trading is professionally based on proper strategies and trade tactics.

$BTC Bulls Fight Back With Weekly CloseNot sure how I continue to amaze myself, but I do 🤓
Notice how those MMs respected my DANGER ZONE POI to the dollar?
Thankfully CRYPTOCAP:BTC did not close the Week outside the DZ.
The battle between Bulls and Bears is FIERCE 🔥
Bulls cannot afford another blue weekly close.
If so, the 50WMA retest ~102k will be inevitable.
Bulls need to reclaim and close this upcoming week above the 20WMA and .236 Fib
A close ~$116k would be super bullish.
That should be enough ammo to spark the long awaited parabola that UpTober has historically brought us.

Ethereum’s Hidden Fractal Points to $33K by November 2026Most of the space seems to think that the bull market is officially over, that the four-year cycle has come to a close. For most of the cycle, I have thought that way too. 1,064 days is up, and that’s the longest a Bitcoin cycle has ever gone for. So, the idea that the same thing will play out again is very valid, and it’s entirely possible that it is indeed the end. However, my stance is very different — I still think we have one year left in the tank, and I will present a lot of evidence to support why I believe this and why I’m sticking to it.
If you’ve been following me for a while, you know that we’ve found some very interesting bar patterns in history that keep on repeating, and this will be the primary source of evidence used in my thesis.
Bar Pattern Fractals
I have tested hundreds of indicators over the last six years and bought thousands of dollars’ worth of indicators, and in the end, the highest success rate has come from simply following bar pattern fractals. They repeat over and over. They are hard to find, but once you do, you can ride them for months.
ETH 2017 Fractal
What you see above is a fractal I have been following for months now. It has been mirroring the 2017 cycle, with some parts nearly identical in movement and timing, with only a few small deviations here and there. The macro pattern continues to play out like clockwork.
Take a look at this TA from March 2025. We caught near the bottom, called for max pain, and discussed this fractal that could be playing out. The ETH call was under 2000 back then.
I also published TAs on Chainlink and its repeating bar patterns. It was straightforward for catching big macro moves for LINK.
As you can see, these are just two examples of many fractals I’m following. The main one is ETH because it’s been a 1:1 mirror for the most part. The last spike down was a deviation for sure — well, at first I thought it was on the Bitstamp chart because it has the most historical data for ETH, but when I switched to the Binance chart, I found something very interesting.
A view of the bar pattern fractal is telling us where we are.
When switching to the Binance chart, we see a very interesting wick of 26% that nuked the market during that time — very similar to what Binance has done this time around. You cannot make this stuff up. So at first, I thought it was a small deviation, but in fact, after looking at this chart, it’s still a mirror, even including that huge scam wick of 27%. Amazing.
So as you can see, in terms of the bar pattern fractal, I simply cannot ignore the fact that this keeps mirroring, and if it continues, it’s possible that we have one more year left in this bull market, and that this four-year cycle thesis is, in fact, a massive bear trap.
If we take a look at the monthly candle that shook a lot of players out last cycle before the run-up, we can see that we printed a candle with wicks on both ends — very similar to what we are forming right now.
If we zoom into that moment on a smaller timeframe, you can now see the moves are similar — a big drop into a double bottom followed by a slow grind up. This is how ETH normally puts in bottoms.
Looking at ETH’s RSI levels on the monthly chart — during the first cycle, when it broke the all-time high, RSI was extremely overbought at 87. On the last cycle, it was 82. This cycle, ETH is at an all-time high and the RSI is only 59. We’re not even in the overbought range yet — there’s so much room for ETH to expand, it’s crazy.
Since its inception, ETH has always pulled off the same move: one very aggressive wave with an aggressive pullback, followed by one smaller wave that creates a higher high to finish off the cycle. It’s done this every time.
Which means that if the bar pattern fractal continues to mirror, then wave 1 tops in the first week of January 2026, followed by a massive correction that will again fool everyone into thinking the four-year cycle is 100% over. But what if ETH puts in a bottom in February 2026 and rallies back up to all-time highs? Nobody would believe it — the disbelief would be strong because everyone would have sold the top in Q4 2025 due to the four-year cycle theory.
The second major piece of evidence I’m leaning on is the Russell 2000. Since its inception, the Russell 2000 has done the exact same thing before expansion comes:
Double top
Second drop bear trap
V-shaped recovery back to all-time high
Expansion breakout
Same thing every time. Look at the chart and tell me we’re not going into expansion — there’s a very high chance. The last two times, we got that massive monthly candle breakout in November.
Which brings me to the main point — every time the Russell goes into expansion, Bitcoin has started its most aggressive run. The last three times, Bitcoin went on to break its all-time high and put in a cycle top within an average of 355 days.
Gold, shown above, is so close to the 4.236 extension right now that it would be crazy to buy here. There’s a high chance of a major top coming in, and we’re about to see a major rotation back into Bitcoin with those gains.
Just take a look at the Power of Law model for Bitcoin — the bull market hasn’t even started yet.
It’s crazy that people are calling the cycle top with the Mayer Multiple sitting at 1.19.
Conclusion
My view is that there is one more year left in this uptrend in crypto. Bitcoin has turned into a different beast. It has completely detached itself from the rest of crypto for the most part, but the first expansion is coming in 2026. If the bar pattern does not deviate, then greatness lies ahead.

BTC 4H Analysis | Day 5🥳 Hey everyone! Hope you’re doing great! Welcome to SatoshiFrame channel .
✨ Today we’re diving into the 4-Hour Bitcoin analysis. Stay tuned and follow along!
👀 After breaking out of the descending channel and confirming the long setup I explained in the previous post, Bitcoin moved upward and easily broke through its Maker-buyer zone.
🔍 Over the past two market-holiday days, Bitcoin consolidated in a multi-timeframe accumulation phase with a ceiling at $107,356, which was easily breached. The price then advanced toward its higher-level key resistances. It’s now trading between $110,500 and $113,000 — the $113,000 zone is our long trigger since price has struggled there multiple times before. This makes it a bit risky, but if the upward movement continues, the next resistances could be at $115,800 and $120,836.
🧮 Looking at the RSI oscillator, it has comfortably passed the 50 level on the 4-hour chart and is now heading toward the overbought zone, facing a key resistance at 70. This 70 level overlaps with the 50 zone on the daily timeframe, meaning that if RSI enters overbought on the 4-hour, the daily will just be shifting from a bearish swing phase to a long-position momentum phase — so the 70 zone is crucial.
🕯 If you check the lower-volume section of the chart, you’ll notice something interesting: the breakout above the two-day accumulation range came with a clear rise in buy volume, which helped Bitcoin easily break both the resistance area and the descending trendline (the upper boundary of the previous channel). This suggests Bitcoin may soon take a volume or price correction to gain more strength for another upward move.
⏰ During today’s New York session, we might see some strong moves. Remember last week when U.S. investors were selling off their ETF holdings, and the market was hesitant to buy? That fear caused weak participation. This time, we may have a reason to stay active during New York hours as sentiment shifts.
🧠 Here are the two key scenarios to watch:
🟢 Long Position Scenario
Wait for Bitcoin to react either to the micro-buyer zone or to the $113,000 area. If we see a pullback followed by an indecision candle (confirmation setup) touching the SMA-7, that’s our entry cue — ideally with a tighter stop size.
🔴 Short Position Scenario
Ignore shorts for now. Bitcoin already completed its second downward wave with an imbalanced slope, and over the last two days, seller momentum has weakened. Buyers are now driving price through resistance levels, so shorting here would go against the current flow.
❤️ Disclaimer : This analysis is purely based on my personal opinion and I only trade if the stated triggers are activated .

BTCUSDT – Correction Pressure ReturnsHello traders,
After a weak rebound earlier this week, Bitcoin is showing signs of losing momentum as it continues to face rejection around the 110,000 USD zone. On the 4-hour chart, price action remains clearly within a descending channel, indicating that the short-term trend still favors the bearish side.
From a technical perspective, BTC is currently being capped by the EMA 34 and EMA 89, both acting as dynamic resistance levels. The recent bounce appears to be merely a technical pullback following the previous strong sell-off, but lacks the strength to establish new upward momentum. The price structure is forming a tight consolidation zone near the upper boundary of the channel — typically a signal of “a pause before continuation of the prior trend.”
On the news side – Policy and sentiment headwinds
This week, the FSB (G20) warned of “major gaps” in global crypto regulation — a negative sign for market confidence, especially after a massive mid-month liquidation shook investor sentiment.
At the same time, China’s tighter stance on stablecoins is raising concerns about slower Asian inflows, while institutional demand remains weak.
Together, these factors create a market environment of low buying pressure and rising risk , giving bears the upper hand in the short term.
Possible Scenario
At the moment, BTCUSDT is trading within the 106,000 – 110,000 USD range.
If the price fails to make a decisive breakout above 110,000 USD, a continuation of the correction toward the 100,000 USD area remains highly possible — aligning with the lower boundary of the descending channel and a key psychological support zone.

Bitcoin Futures ChannelBitcoin Futures Chart
- We have been respecting this channel all bull run and have once again bounced of thes support lines
- I think we have one more run up to the next upper line, or the one after that before the bull run tops
- The bull run will be over when we break the lowest trendline

Manipulation Fractal Bitcoin (Run It Back To The Upside)Comparing the 2 bottoms and how they are freactals of each other.
Very similar behaviour on Market Cipher with the Yellow X's (manipulatiion) and double blood diamonds.
Plenty of liquidity to grab back to the highs. Money flow is also coming out of the red back into the green as it curves up.

$BTC SUNDAY ANALYSIS: #Bitcoin continues to play out the bearisCRYPTOCAP:BTC SUNDAY ANALYSIS:
#Bitcoin continues to play out the bearish setup we have been tracking for two months. After another clean rejection from the 1D 50 EMA zone near 115K to 115.6K, the market confirmed that sellers still dominate this range. Our main target remains 100K, which is also a key support level of this bull market. If Bitcoin breaks below this zone, I expect a deeper move toward 90K and possibly lower.
Right now BTC is trading around 107K, and while a small upside bounce is possible, it is likely to be short-lived. Important data is coming next week, including the U.S. CPI report on Thursday, October 24 at 8:30 AM ET, and the FOMC updates, which could bring short-term volatility. Resistance levels sit around 110K and the 1D 50 EMA near 115K, while 100K remains the critical support to watch. If that area fails to hold, we could easily see a drop toward 90K in the coming weeks.
Short-term relief bounces are possible, but they are likely to be sold into unless BTC reclaims 115K with strong volume. Only then would the outlook shift back toward 120K to 122K.
I am still bearish, currently holding the remaining 25% of my short position after closing 75% in profit. I will only add or close depending on how the market reacts to upcoming data and price action. If there is any shift in structure, I will update you in time.
#BTC #Bitcoin #Crypto #BTCUpdate
#CRYPTOSKULLSIGNAL

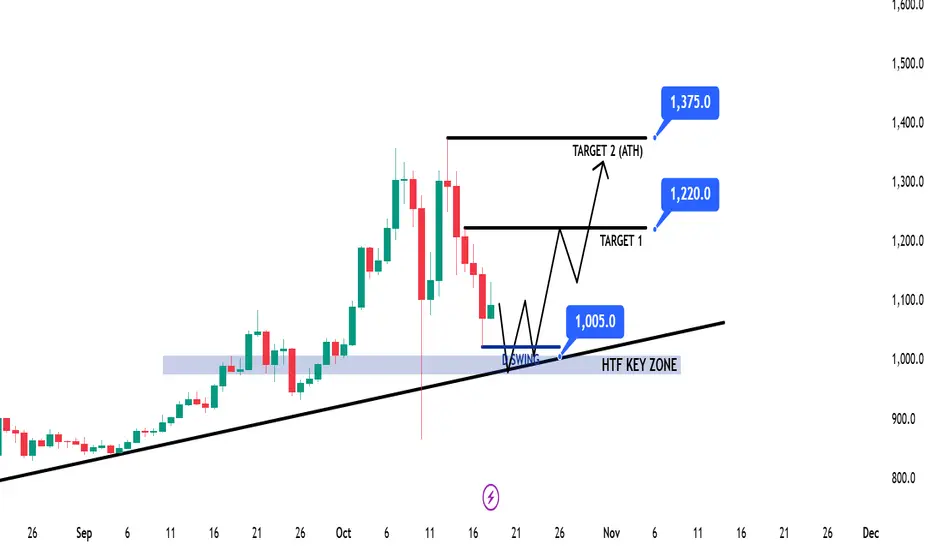
BNB Game Plan - TBKZ ModelBNB Game Plan – TBKZ Model
📊 Market Sentiment
Market sentiment is currently volatile, heavily influenced by U.S. foreign policies.
With the U.S. entering a quantitative easing (QE) phase, the long-term outlook remains bullish, as more liquidity is expected to flow into risk assets.
However, the short-term sentiment is bearish due to renewed trade tensions and Chinese tariff concerns.
Overall, sentiment is slightly bearish short-term, but bullish long-term as macro liquidity expands.
📈 Technical Analysis
Price tapped the HTF bullish trendline and faced a rejection wick during the Chinese tariff announcement.
This reaction confirms the trendline’s significance as a major dynamic support zone.
Now, I’m watching for another price leg toward the HTF trendline, expecting a possible retest and bounce from the HTF Key Zone around $1005.
📘 Model to be used – TBKZ Model (Trendline Bounce at Key Zone)
1️⃣ Identify the HTF trend — trade only in that direction.
2️⃣ Map out the HTF trendline that may act as dynamic support.
3️⃣ Locate the HTF Key Zone containing significant liquidity and structure.
4️⃣ Wait for a bounce and LTF confirmation before entering the position.
📌 Game Plan
I will be waiting for price to return to the HTF trendline and retest the HTF Key Zone near $1005.
Once price gives confirmation (12H–4H structure break), I’ll look for a long setup.
🎯 Setup Trigger
Break of structure on 12H–4H timeframe after testing the $1005 zone.
📋 Trade Management
Stoploss: 12H–4H swing low that breaks structure
Targets: TP1: 1220$ | TP2: 1375$ (ATH)
Move stoploss to breakeven after TP1 hits.
💬 Like, follow, and comment if this breakdown supports your trading! More setups and market insights coming soon — stay connected!
⚠️ Disclaimer: This content is for informational and educational purposes only and does not constitute financial, investment, or trading advice. Always DYOR before making any financial decisions.
$BTC Vs. $GOLDBitcoin / Gold is near its historical bottom.
Is back in the long-term demand zone, as it was at the 2020 and 2023 lows.
RSI indicator is also almost exactly the same as the previous two lows.
This structure has historically always been a precursor to a strong trend reversal.
Reaction from these areas in 2020 and 2023 led to significant appreciation in Bitcoin against gold.
Today the picture is similar again both price and momentum point to the same bottom scenario.

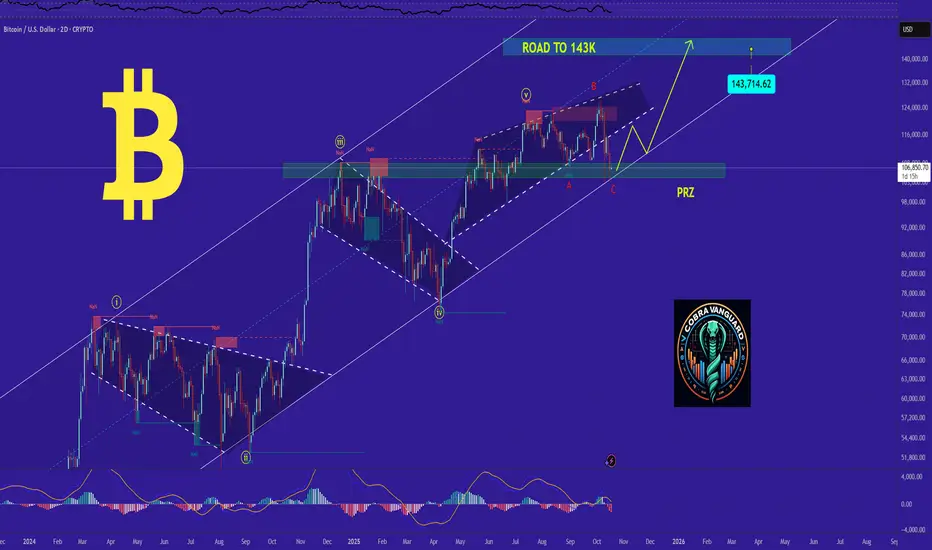
BTC - Decision Time at the Flip Zone!BTC is retesting a daily flip zone (former resistance turned support). This band has been the market’s pivot for most of the year and is the line in the sand for trend intent.
📈Bullish case (preferred): As long as the daily holds above the flip zone (~105k–108k) and prints a bullish reaction, I’ll look for longs. Upside magnets sit near 118k first, then 125k if momentum extends.
📉Bearish case (alternative): A clean daily close back below the flip zone turns it into supply and exposes 100k–98k, with room for a deeper correction if follow-through expands.
All Strategies Are Good; If Managed Properly!
~Richard Nasr

Breakdown or Bounce Incoming? | BTC 4H Analysis D4🥳 Hey everyone! Hope you’re doing great! Welcome to SatoshiFrame channel .
✨ Today we’re diving into the 1-Day BITCOIN analysis. Stay tuned and follow along!
👀 Yesterday I shared Bitcoin’s daily analysis in the channel, and today we’re going to review the 4-hour timeframe, from its recent all-time high up to the present.
🔍 After setting its ATH, Bitcoin entered a descending channel (driven by profit-taking and reactivated whale activity). Each time price reached the top of this channel, it was rejected and moved toward the midline or bottom. The last touch of the channel’s top led to another drop toward the midline, and price failed to break above the channel. The major buy zone (micro buyer area) at the top of the channel was lost and has now turned into a key static resistance, overlapping with the dynamic channel resistance — creating a crucial pivot zone for Bitcoin’s potential trend reversal. The next key support lies below this zone at $105,634; a confirmed break and close below it could extend the downtrend further.
🧮 The RSI oscillator is currently fluctuating between 30 (support) and 50 (resistance). A breakout beyond either side — as highlighted in the chart — could add significant momentum to Bitcoin’s next move. These RSI levels are default static zones, which makes their reliability stronger.
🕯 After the massive flash crash that shook the crypto market, traders have shown a stronger inclination toward selling, keeping Bitcoin within this descending channel. As seen in the volume data, the flash crash was accompanied by extreme selling pressure, and whales broke the micro buyer zone with a large “whale candle.” Continued selling pressure could push Bitcoin toward lower supports, while renewed buying volume and whale re-entry could drive it back toward the channel top to test that resistance once more.
🧠 For those without open positions, here are two key scenarios to consider:
🟢 Long Setup: A breakout above the key static + dynamic resistance zone at $109,222, along with increasing buy volume and RSI crossing above 50, could be a solid long opportunity.
🔴 Short Setup: A confirmed breakdown below the nearest support at $105,634, accompanied by strong selling pressure and RSI falling below 30 into oversold territory, could present a strong short setup.
❤️ Disclaimer : This analysis is purely based on my personal opinion and I only trade if the stated triggers are activated .

BTC Outlook after the Dip. What to expect NOW? As I mentioned earlier, the price has reached the bottom of the channel and completed the final bearish wave. I'm hopeful that Bitcoin will respect the technical setup and begin a bullish wave from here.
!!! However, Bitcoin might surprise everyone and break the channel structure.so we need to wait for confirmation, which I believe will become clear by tomorrow.
Follow us for upcoming updates and market insights.
PREVIOUS ANALYSIS
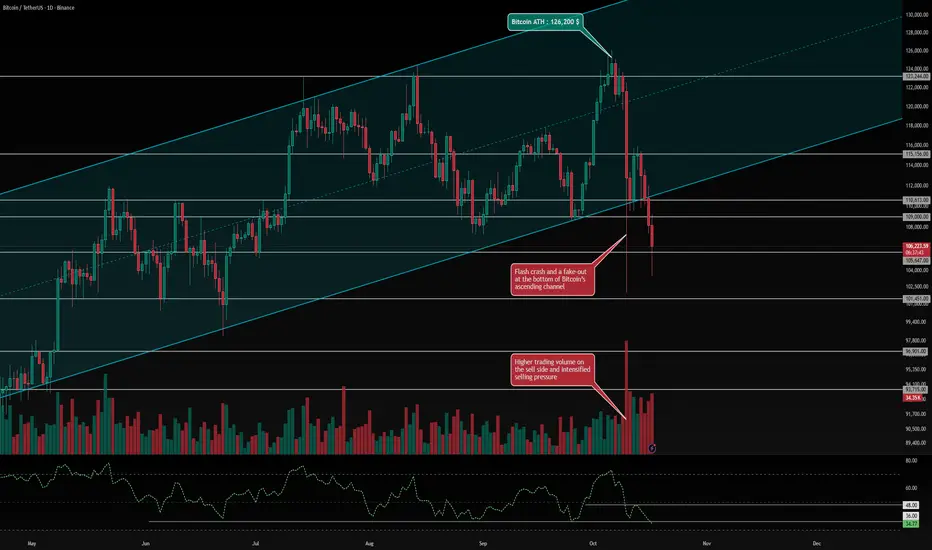
BITCOIN From ATH to Breakdown | BTC 1D Analysis D3😎 Hey everyone! Hope you’re doing great! Welcome to SatoshiFrame channel .
👍 Today we’re diving into the 1-Day BITCOIN analysis. Stay tuned and follow along!
👀 Bitcoin has been trading within a strong ascending channel, recently hitting the upper boundary and setting a new all-time high (ATH) at $126,200. However, this was immediately followed by a flash crash that wiped out roughly $20 billion in futures positions. During the crash, the lower boundary of the ascending channel was also fake-broken, after which buyers temporarily pushed the price back inside the channel. Yet, due to extreme market fear and uncertainty, Bitcoin lost its key support zone at $110,613, continuing the downtrend that began with the flash crash. With yesterday’s daily candle close, Bitcoin officially broke down from its ascending channel, and price action is now heading toward lower support levels. The nearest support lies around $105,647, and if this zone fails to hold, Bitcoin could extend its decline toward the next support at $101,451.
🔍 Bitcoin currently faces two major resistance zones at $109,000 and $110,613. A confirmed breakout above these could signal the start of a reversal, but the main long trigger is located at $115,156. If Bitcoin breaks and holds above this zone with strong buying volume, it could mark the beginning of a powerful bullish leg, potentially leading to a new ATH.
🧮 The RSI oscillator is now sitting near its support region around 36. A daily close below this level would strengthen bearish momentum and could push RSI into oversold territory. The midline resistance sits near 48, and a breakout above this would indicate a possible trend reversal toward renewed bullish momentum.
🕯 Recent candlestick volume shows extremely high selling pressure, marking one of the most intense liquidation waves in recent crypto history. The number of red candles has surged in recent days, suggesting a continuation sell-off pattern, with traders increasingly favoring short positions. The market is currently in extreme fear, and for any bullish reversal to occur, Bitcoin would need massive buy-side volume and strong support to push prices back up. Without that, more long-term holders may start selling as well.
🧠 Current Scenarios (Daily Timeframe) — Patience is key. If you haven’t already entered a short based on previous analyses, consider these setups:
🟢 Long Scenario: Enter on a confirmed breakout and consolidation above $115,156, accompanied by a spike in buying volume and an RSI move above 48.
🔴 Short Scenario: Enter on a confirmed breakdown and close below $105,647, which could trigger a deeper correction toward lower levels. This move would likely coincide with continued selling pressure and RSI dropping below 36 into the oversold zone.
❤️ Disclaimer : This analysis is purely based on my personal opinion and I only trade if the stated triggers are activated .
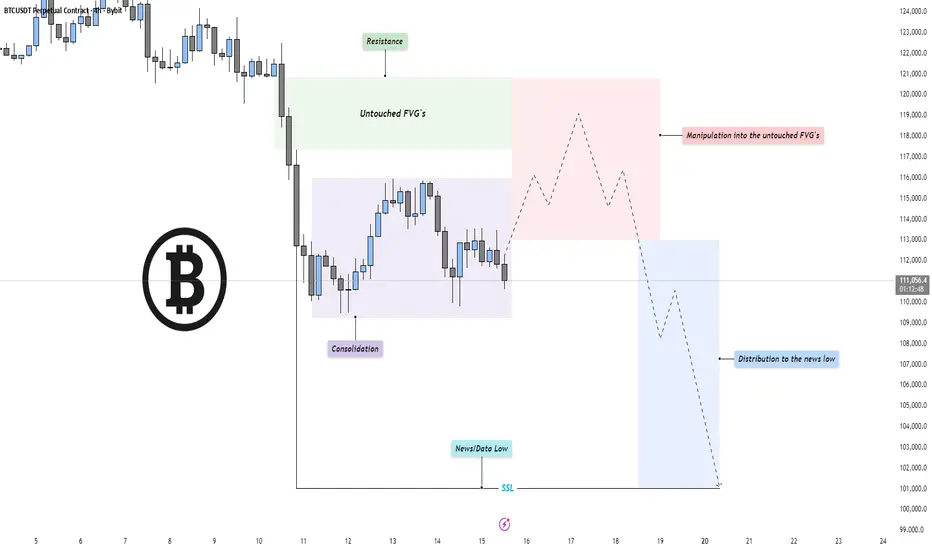
BTC - Perfect Power of 3 setup!Market Context
Bitcoin has entered a phase of compression after an extended bearish leg, with price currently consolidating near recent lows. The previous selloff created a clean structure of inefficiencies and untouched fair value gaps (FVGs) above, now acting as potential magnet zones for short-term retracements. The broader context remains bearish until those imbalances are efficiently mitigated.
Fair Value Gaps & Manipulation Zones
A clear pocket of untouched FVGs sits above the current range, aligning with resistance from prior breakdown points. Price could engineer a manipulation move into this zone, enticing late buyers before resuming the macro bearish direction. Such a move would serve as a liquidity grab and offer premium pricing for distribution before continuation lower.
Liquidity Dynamics
The market structure shows resting sell-side liquidity (SSL) below the recent “news/data low,” marked as a potential target for a deeper sweep. Once manipulation into the upper inefficiencies completes, the market could shift momentum to the downside, distributing into that liquidity and seeking new lows for rebalancing.
Final Thoughts
The current structure points toward a classic bearish continuation setup: consolidation, manipulation into premium inefficiencies, and a drive toward sell-side liquidity. Unless price breaks decisively above the untouched FVG chain, the expectation remains for a redistribution phase leading into the news low or beyond.
If this breakdown helped frame your bias, a like goes a long way — do you think price runs the FVG first, or dives straight into the liquidity below?
BTCUSD/XAUUSD where is the probability of equilibrium? 17/Oct/25BTCUSDXAUUSD ratio chart shown there is multi top pattern near 41 raio with price breaking the long term uptrend line. The Next major support could be at 1?! Gosh! BTC (fake money/ digital gold) same value with Gold ( real money /analog gold)?! WT....
