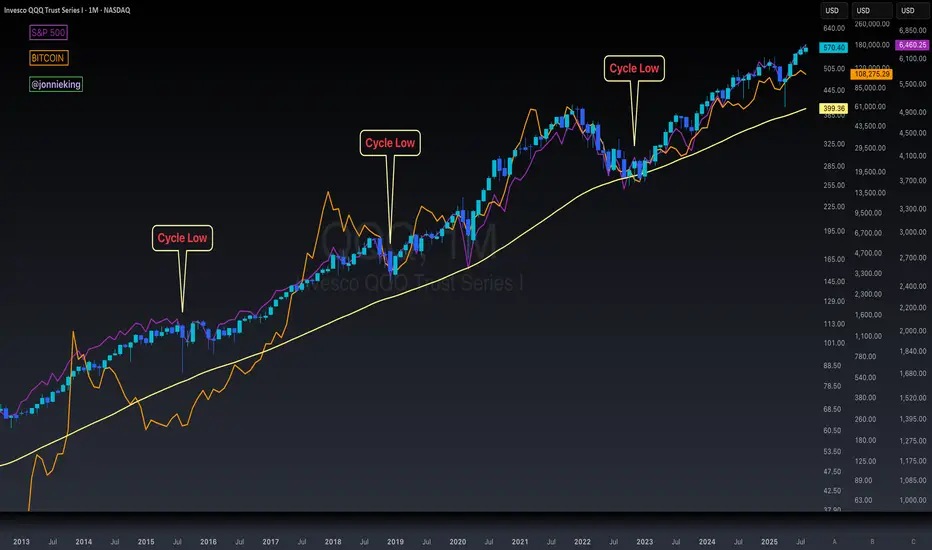
$BTC 4-Year Cycle Is NOT Dead According to $QQQ $SPXIt’s really weird cause everyone keeps telling me the ₿itcoin 4-year cycle is dead yet Nasdaq and S&P 500 follow nearly the exact same pattern with cycle lows 🤓
It’s almost as-if monetary and fiscal policy creates this boom and bust cycle every 4-years 🤔
Question for the “this time is different people”….
Will NASDAQ:QQQ and SP:SPX not have similar bear markets as we’ve seen in the past along with CRYPTOCAP:BTC ?
BTC-M
XRP | Looking for All-Time HighsXRP | Looking for All-Time Highs
📊 Market Sentiment
Overall sentiment remains bullish, supported by expectations of a 0.25% rate cut in the upcoming FOMC meeting. A weakening USD and increasing global risk appetite are creating favorable conditions for further upside in crypto assets.
📈 Technical Analysis
Price ran liquidity at $2.81 and closed above with a strong reaction.
A 4H demand zone formed after the break of structure, and price found support there.
Currently, price is moving towards the bearish trendline.
If price breaks and closes above this bearish trendline, I will be looking for long entries targeting new highs.
📌 Game Plan
I will wait for price to break and close above the bearish trendline.
Then, I will look for a retest and bounce slightly below or at the trendline before entering.
🎯 Setup Trigger
A 1H market structure shift will be my confirmation for entry.
📋 Trade Management
Stoploss: 1H swing low confirming the BOS
Targets: TP1: $3.14 | TP2: $3.38
💬 Like, follow, and comment if you find this setup valuable!
⚠️ Disclaimer: This content is for informational and educational purposes only and does not constitute financial, investment, or trading advice. Always do your own research before making any financial decisions.

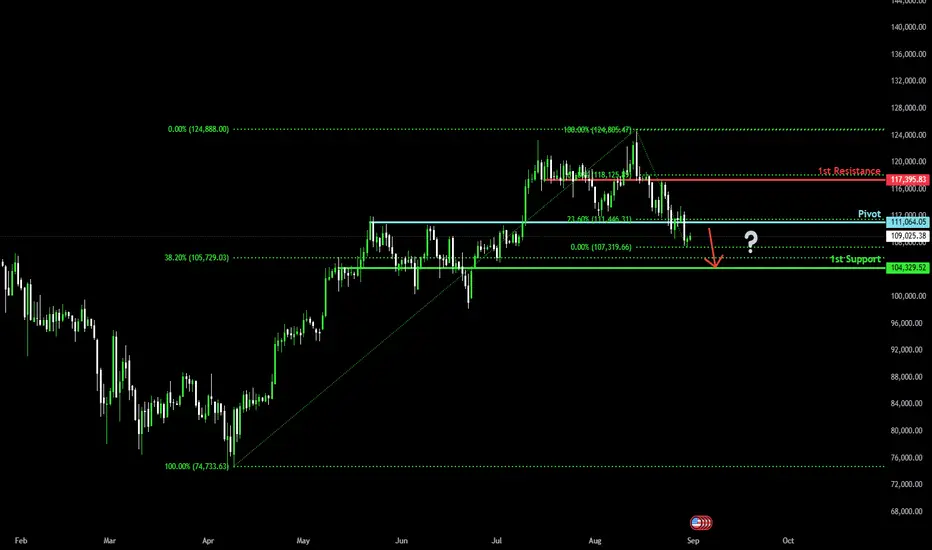
Price drop from overlap resistanceBitcoin (BTC/USD) is rising towards the pivot, which acts as an overlap resistance that lines up with the 23.6% Fibonacci retracement and could drop to the 1st support.
Pivot: 111,064.05
1st Support: 104,329.52
1st Resistance: 117,395.83
Risk Warning:
Trading Forex and CFDs carries a high level of risk to your capital and you should only trade with money you can afford to lose. Trading Forex and CFDs may not be suitable for all investors, so please ensure that you fully understand the risks involved and seek independent advice if necessary.
Disclaimer:
The above opinions given constitute general market commentary, and do not constitute the opinion or advice of IC Markets or any form of personal or investment advice.
Any opinions, news, research, analyses, prices, other information, or links to third-party sites contained on this website are provided on an "as-is" basis, are intended only to be informative, is not an advice nor a recommendation, nor research, or a record of our trading prices, or an offer of, or solicitation for a transaction in any financial instrument and thus should not be treated as such. The information provided does not involve any specific investment objectives, financial situation and needs of any specific person who may receive it. Please be aware, that past performance is not a reliable indicator of future performance and/or results. Past Performance or Forward-looking scenarios based upon the reasonable beliefs of the third-party provider are not a guarantee of future performance. Actual results may differ materially from those anticipated in forward-looking or past performance statements. IC Markets makes no representation or warranty and assumes no liability as to the accuracy or completeness of the information provided, nor any loss arising from any investment based on a recommendation, forecast or any information supplied by any third-party.
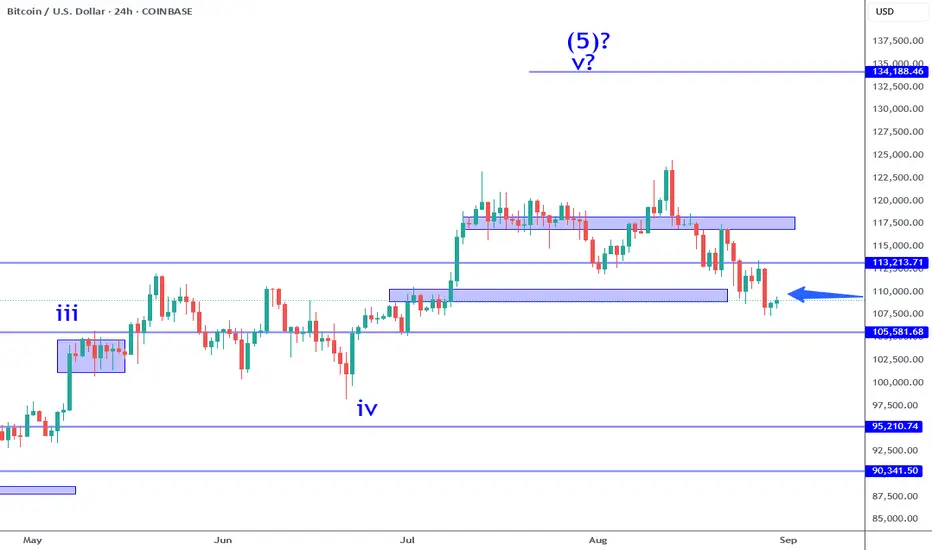
Bitcoin: Wave 4 Overlap Changes Expectations.Bitcoin has compromised the 108K area overlap which refers to the wave 1/wave 4 overlap rule for the broader wave 5 impulse that I have been measuring for months. While this can be very subjective, this fact prompts me to adjust my expectations in regards to trend structure, along with risk management.
The wave 4 overlap does NOT necessarily mean a bear market is ahead but it does justify considering a lower probability of new high (or wave 5), and a greater probability of a consolidation. So what does this mean for traders and investors? This pull back should not be treated like a typical pull back. In a corrective structure, after the completion of the A wave, which the current leg is likely to be, it is followed by the B wave. This typically establishes a lower high which can be expressed as a move from current prices back to the 115K area. Those who are unaware will get caught in this thinking new highs are just around the corner.
IF I am correct about this proposed corrective scenario, this can be very beginning of a very broad wave 2 which can eventually lead price back into the 80Ks. At this magnitude such a move can take a year to play out. Gold has shown similar patterns that persist for years before breaking out, so this scenario is within reason.
Key factors to watch for: there are many fundamental question marks that the market has to adjust to. There are numerous data points that are expected over the next few months like NFP, the FOMC rate cut, and how the FED hints at future quantitative easing. While this situation seems beneficial to Bitcoin, we can't take it for granted. This is a sentiment game, NOT a logical one. This is why I use prices to determine if risk is worth taking, not my economic opinion that is based on public information. This means it is possible to have a favorable easy money environment, and Bitcoin can still be stuck in a broad range.
With the 108K overlap in place, I will be mostly interested in whole number support levels like 105K, 100K, 95K ext. Even a retest of the 108K support for a double bottom, but if I consider any longs the profit objective will be low (like 1.5 to 1 or even 1:1). I am only interested in swing trades because in my opinion these are not investing levels.
Thank you for considering my analysis and perspective.
BRIEFING Week #35 : Monthly forecast for Q4Here's your weekly update ! Brought to you each weekend with years of track-record history..
Don't forget to hit the like/follow button if you feel like this post deserves it ;)
That's the best way to support me and help pushing this content to other users.
Kindly,
Phil

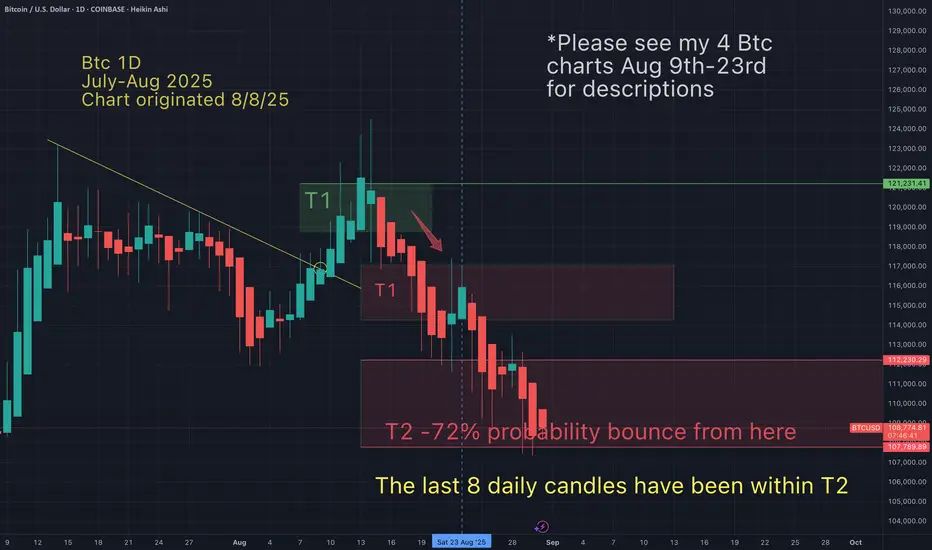
Btc price action unfolds exactly as anticipated-Bounce incoming?On Aug 9th I suggested the following:
As of today Btc has been bottoming at my T2 after following the anticipated price action suggested in the above chart. TA works!
May the trends be with you.
TradeCityPro | Bitcoin Daily Analysis #165👋 Welcome to TradeCity Pro!
Let’s dive into Bitcoin analysis. Over the past few days, I unfortunately couldn’t provide updates, but starting today I’ll try to bring you daily analyses again.
⌛️ 4-Hour Timeframe
Bitcoin is still continuing its downward trend and has managed to consolidate below the supply zone we had marked.
📊 At the moment, a descending trendline has formed, and the price has reacted to it multiple times.
⭐ I currently don’t have any open positions on Bitcoin and won’t be opening new ones yet. For new entries, I’m waiting until my triggers are activated.
📈 For a long position, with a break of the trendline and activation of the 110183 trigger we can enter. But the main position will be after consolidation above the 113000 zone.
🔽 For a short position, with a break of 107853 the price could make another downward leg. The next support would be 105370.
✔️ There’s a strong chance Bitcoin will continue this corrective move, possibly until the next interest rate announcement. But we still need to watch the market daily, so that once triggers activate, we can open positions accordingly.
❌ Disclaimer ❌
Trading futures is highly risky and dangerous. If you're not an expert, these triggers may not be suitable for you. You should first learn risk and capital management. You can also use the educational content from this channel.
Finally, these triggers reflect my personal opinions on price action, and the market may move completely against this analysis. So, do your own research before opening any position.

Oh my god, Bitcoin is crashing · Buy the dip · PerspectiveOh my god, Bitcoin is crashing. Notice the health of this chart. Doesn't it look strong? I mean, what do you see?
Do you really see a crash toward $40,000?
Are you truly seeing this?
Or, are you seeing a simple, classic correction or market flush?
A market flush toward $100,000.
Oh my god, Bitcoin is crashing.
Today I looked at Bitcoin's price and it was $107,000. I thought, "Wow, that is pretty high."
Oh my god, Bitcoin is crashing... And yet the trading is still happening above $100K.
If it takes this much force to produce just a minor retrace, from $120,000 to $100,000, do you really belief the bears will own this game? Do you really belief sellers will sell forever and Bitcoin will move below 80K?
It is not possible. "80K is already gone!" Remember?
$100,000 is already gone.
It doesn't look like a bear market, more like a market flush.
Keep this in mind about the current market event: It happens and ends in a day. If the flush starts now, it ends later today. As soon as the low is in, it is the start of the next bullish wave.
How long? 1 day, 2 days?
It doesn't matter. We are ready to buy and hold.
Buy the dip. The bull market is not over. Change your perspective.
Namaste.
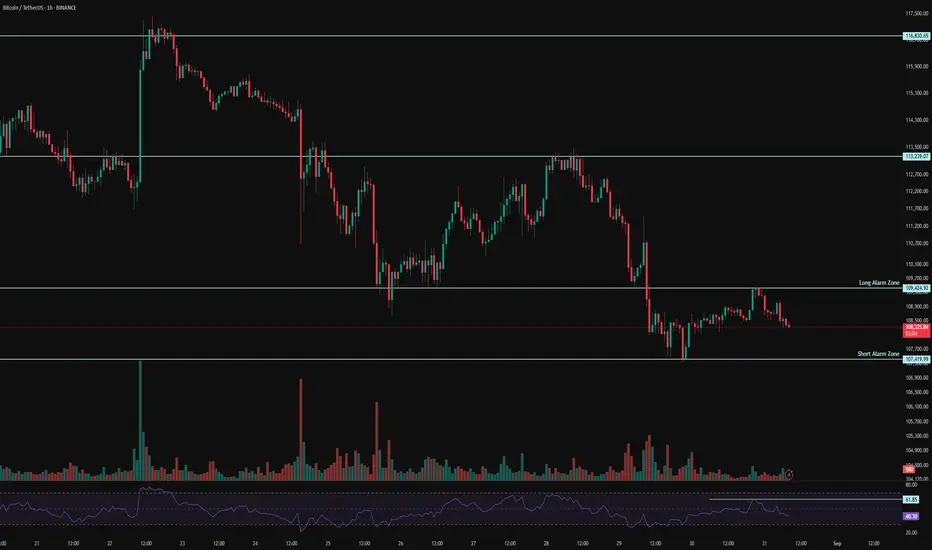
BTC 1H Analysis – Key Triggers Ahead | Day 28💀 Hey , how's it going ? Come over here — Satoshi got something for you !
⏰ We’re analyzing BTC on the 1-hour timeframe timeframe .
👀 With the breakout of this one-hour box, Bitcoin can give us either a long or short position. Keep in mind that the market is currently in the holidays and volume is decreasing. The start of the new week can be interesting for Bitcoin.
⚙️ A key RSI zone exists at 62, and with the swing limit breaking this number, Bitcoin can move upward again. The next key RSI zone is 30, which is the oversold boundary for Bitcoin.
🕯 Bitcoin’s volume has sharply decreased as we are in the holidays. The size and volume of red candles are increasing each time, but still micro buyers are present, leaving good reversal candles from supports. With increasing volume, Bitcoin can start a good trend in the new week.
📊 1H timeframe USDTDominance We observe that this dominance, upon hitting its ceiling at 4.56%, was rejected and moved down toward its support at 4.46%. Then it bounced from this area and hit the key resistance at 4.49%. With the breakout of this one-hour dominance box in either direction, good volume can flow into Bitcoin.
🔔 The alarm zone for Bitcoin is the ceiling and floor of this one-hour box, which has high price action value.
❤️ Disclaimer : This analysis is purely based on my personal opinion and I only trade if the stated triggers are activated .
Bitcoin testing 116k zoneIf we are successful in breaking above the 116k zone resistance. Bitcoin will pump hard to 120k and 123k next. As the high time frame trend continues to stay uptrend. Let's see if bitcoin breaks it now or has some other plans.
Stay tuned!

Ethereum’s Epic Climb: $10,000+ by Year-End 2025!New data and discoveries have come in, so my prediction for ETH has changed.
Back in March 2025, I saw this ETH pattern forming:
So far, everything is playing out as expected, but I believe the timeline has shifted to sometime at the end of December 2025.
We have one major liquidation event to play out before this happens in September, and I would not be surprised if we get a pullback to $3,500 before liftoff.
Bitcoin will most likely go down to $92,000 to close the CME gap:
You can check that out above, and when that happens, ETH should bottom out somewhere around $3,500.
The next major time Fibonacci will be on October 10th, 2025; this is most likely when we get the breakout. Until then, a massive trap is forming.
Ascending triangles are the name of the game in a bull market, especially with ETH:
As long as we keep putting in lower highs into ascending triangles, we are good to go higher; anything else is noise.
Invalidation for this thesis is simple: we close a weekly candle under the orange support, and chances are very high that we are done.
All I think is happening here is preparation for a massive bear trap, flushing out all the late leverage, as they always do. This is just a rite of passage before a major rally ensues.

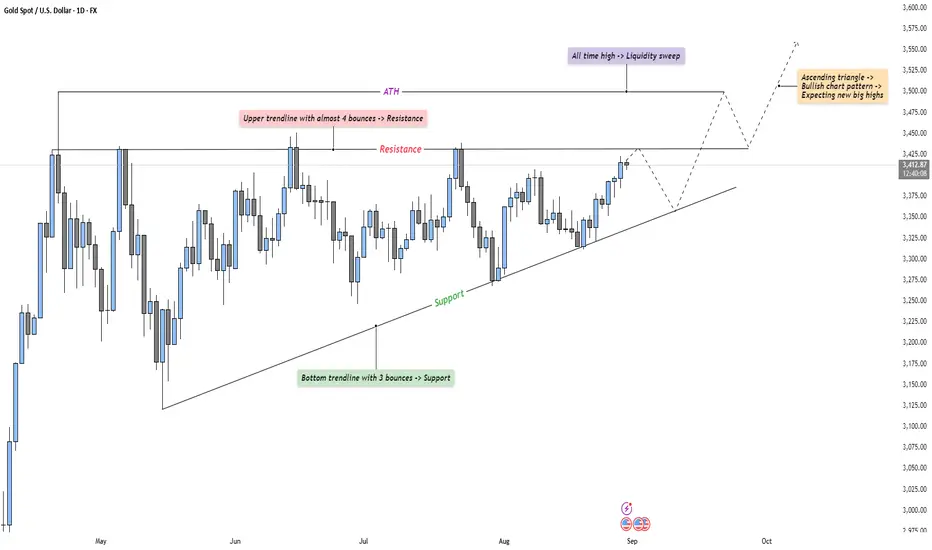
GOLD - Ascending Triangle into new All Time HighMarket Context
Gold has been steadily climbing, forming an ascending triangle pattern over the past few months. Buyers continue to defend higher lows, while sellers repeatedly reject price near resistance. This type of structure often signals building pressure, with volatility likely to expand once a breakout occurs.
Consolidation Phase
The range between the ascending support trendline and the horizontal resistance has created a textbook consolidation. Each bounce off support shows accumulation, while the repeated touches of resistance highlight where liquidity is building. The longer price compresses within this pattern, the more explosive the eventual breakout is expected to be.
Bullish Breakout Scenario
If price manages to break above resistance and sweep the all-time high, it would likely trigger a wave of liquidity from trapped shorts and breakout buyers entering. This move could fuel momentum into fresh price discovery, validating the ascending triangle as a bullish continuation pattern. The sweep of liquidity above ATH could serve as the catalyst for acceleration toward new highs.
Bearish Retest Scenario
On the other hand, if resistance holds once again, a deeper retracement back toward the ascending trendline is likely. This would test the conviction of buyers and determine whether the trendline support continues to act as the foundation for the structure. A clean break below support would weaken the bullish outlook and signal a potential shift in momentum.
Final Words
Patience here is key — ascending triangles often test traders’ resolve before making their decisive move. Let the market reveal its hand before committing to either direction.
If you found this breakdown helpful, a like would be much appreciated! Drop a comment and let me know: are you expecting the breakout to bring new highs, or do you see sellers defending this level once again?
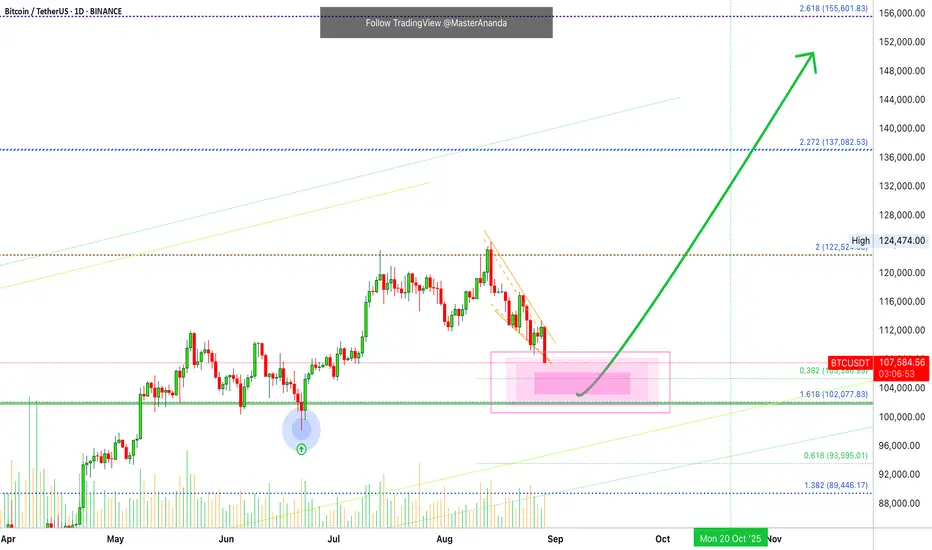
Bitcoin · Futures Trading Trade-NumbersI want your opinion. Too early?
Normally a retrace would pierce half-way through the previous consolidation range before reversing. Bitcoin hit a low today of $107,488. The lowest since 8-July.
I don't see much bearish momentum but the retrace is a perfect decline. Two weeks prices moving lower. Bitcoin is now trading within a strong support zone. The price range that launched the all-time high.
We have some mixed signals. Bitcoin is mixed as usual, in some ways, while everything else is crystal clear. And so we conclude that Bitcoin is doing what everything else in the crypto market is also doing. Consolidating, building up strength, before moving higher.
Yes it is true Bitcoin is moving lower. Not kidding. But this is a minor decline, truly. Months ranging and lower but the price is down only a few ks and the trading continues to happen safely above 100K.
We will see additional growth.
I see some altcoins-projects growing so strong... Bitcoin is already fairly priced.
I just wanted to share with you some numbers...
________
LONG BTCUSDT
ENTRY: $107,600 - $110,000 (STOP: $105,000)
TARGETS: $122,500, $137,000, $155,600
________
Thanks a lot for your continued support.
Namaste.
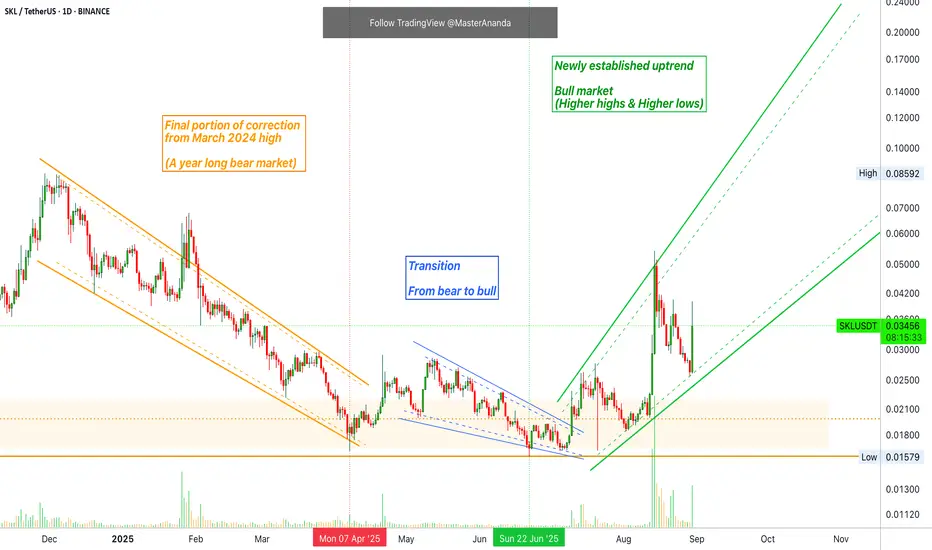
A Newly Established Uptrend Means Higher Highs · Skale NetworkThis is another perfect example of a trading pair "not dropping with Bitcoin." This is the theme today as I am trying to share some strength for those who need most, those who need to wait.
This market proof will show you, without a shadow of doubt, that the Cryptocurrency market is actually rising and will continue to do so. Which means that the best option is to hold or buy, not to sell because prices are going up and are doing so strong.
Bitcoin peaked 14-Aug and has been dropping until this day, producing the lowest price in almost two months. Since early June.
Skale Network (SKLUSDT) produced a peak 14-August followed by a fast retrace. This peak comes from a bullish breakout that is supported by the highest buy volume ever.
See this: Yesterday as SKLUSDT ended its retrace, a higher low, we have today a massive green candle with high buy volume again. As prices were moving lower, no volume basically. As soon as support is found, volume goes up.
You can see the same with Bitcoin. It was retracing, the retrace ends, now it starts (will) to grow.
Notice how SKLUSDT is moving within a newly formed uptrend. Not an old one, brand new. Notice the left side of the chart, the downtrend. The end of the downtrend. The initial bullish breakout and retrace (blue) and finally the new uptrend, higher highs and higher lows.
If Bitcoin were to start a bear market now, this pair wouldn't be starting a bull market now, it would crash.
The only reason why Skale Network can continue to grow, is because Bitcoin is simply retracing, not crashing, and soon will resume with its growth. Since the smaller projects know, they just keep on going... Many are going up. Buy and hold.
Namaste.
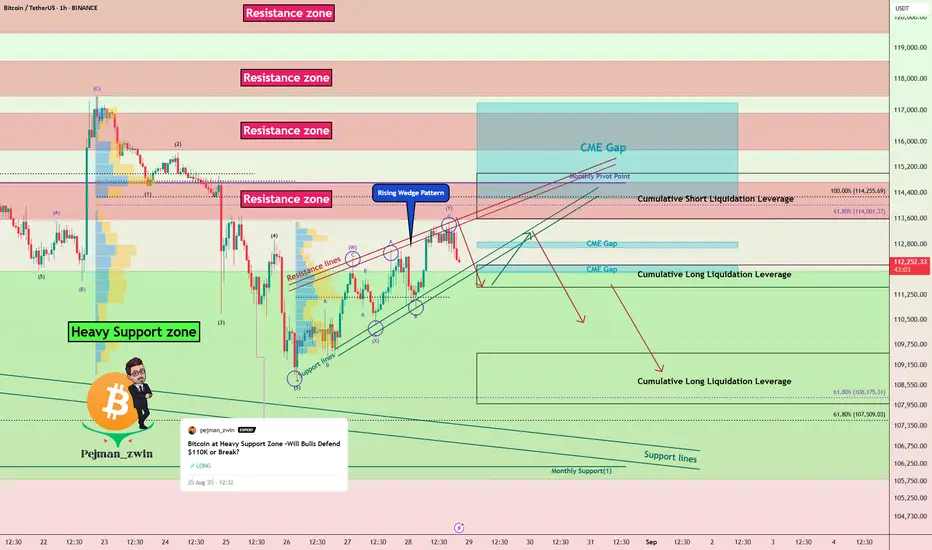
Bitcoin at Make-or-Break: Will BTC Fill the CME Gap?Bitcoin ( BINANCE:BTCUSDT ) increased to $113,500 as I expected in my previous idea .
Do you think Bitcoin can fill the upper CME Gap($117,235-$113,800) !?
Bitcoin is currently moving near the Resistance zone($114,720-$113,580) , Cumulative Short Liquidation Leverage($115,000-$113,588) , Resistance lines , and Monthly Pivot Point .
In terms of Elliott Wave theory , Bitcoin’s movement over the past 2 days has been in the form of corrective waves and has had low momentum . The corrective wave structure is a Double Three Correction(WXY) .
From a Classic Technical Analysis perspective, Bitcoin appears to be completing a Rising Wedge pattern .
I expect Bitcoin to move towards Cumulative Long Liquidation Leverage($109,500-$108,000) after volatile movements over the next two days .
CME Gap: $112,870-$112,700
CME Gap: $112,155-$111,940
Stop Loss(SL): $115,510(Worst)
Please respect each other's ideas and express them politely if you agree or disagree.
Bitcoin Analyze (BTCUSDT), 1-hour time frame.
Be sure to follow the updated ideas.
Do not forget to put a Stop loss for your positions (For every position you want to open).
Please follow your strategy and updates; this is just my Idea, and I will gladly see your ideas in this post.
Please do not forget the ✅' like '✅ button 🙏😊 & Share it with your friends; thanks, and Trade safe.
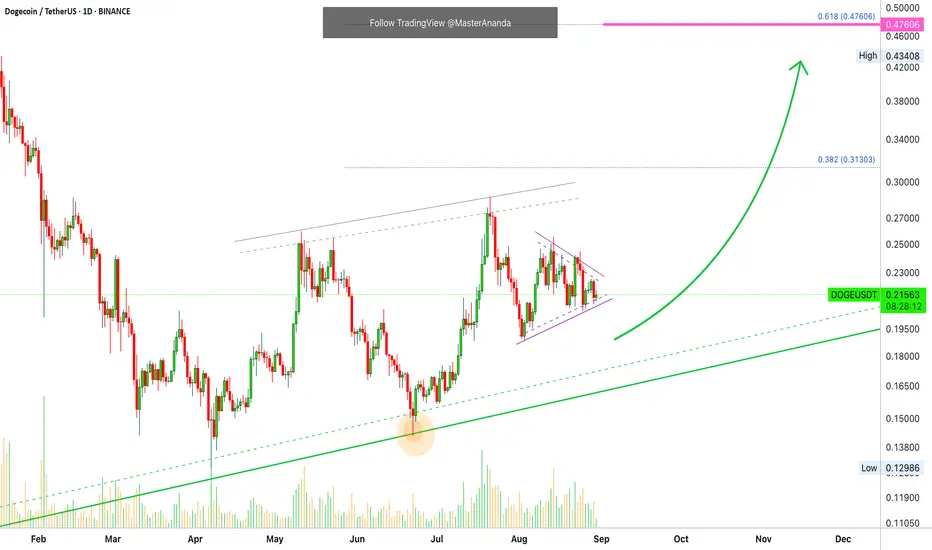
Dogecoin Isn't Dropping While Bitcoin Drops? ConsolidationThe theme this time around is "not dropping with Bitcoin." I chose Dogecoin to start because Dogecoin is a big project—market cap wise—so it shows that this isn't happening only with the smaller altcoins. This is a marketwide phenomenon.
Bitcoin has been dropping since 14-August, producing major lows. The lowest price today since early July, almost two months ago and that's ok.
The down-move is extended through time and weak. After weeks of bearish action support remains intact. Then we have Dogecoin.
Dogecoin has been moving within a bullish consolidation pattern. It has been producing higher lows since early this month. Here is the disparity, Bitcoin is retracing but Dogecoin is consolidating. The truth is, both Bitcoin and Dogecoin are consolidating but Dogecoin has an upward bent on the lows while Bitcoin has a downward one.
We know that a continuation will lead to a resumption of the bullish trend, higher highs.
DOGEUSDT has a very strong bullish bias with a target of $0.47 in the coming weeks. Short-term. As Dogecoin rises, all related projects, those that move together, will follow and do the same. Bitcoin, Cardano, ADA, XRP, Ether, they all move together.
Thank you for reading.
Namaste.
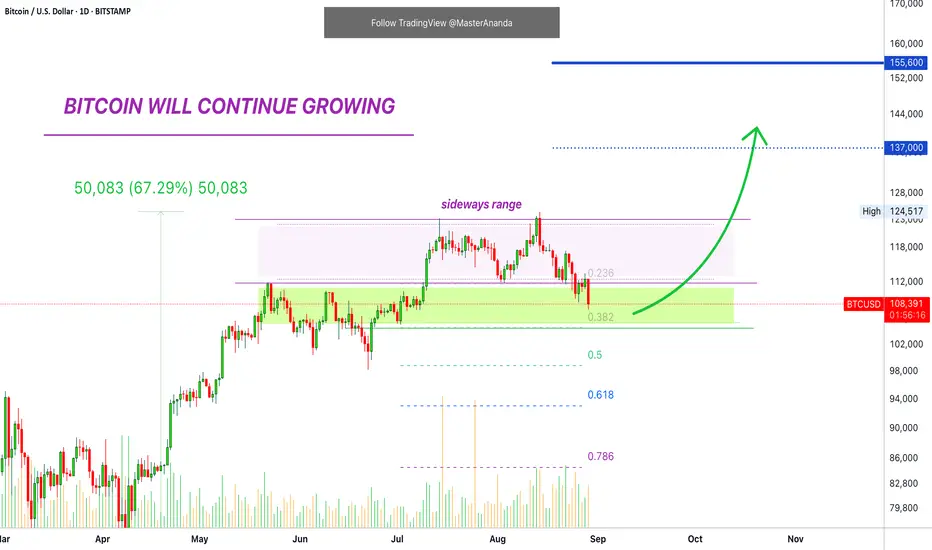
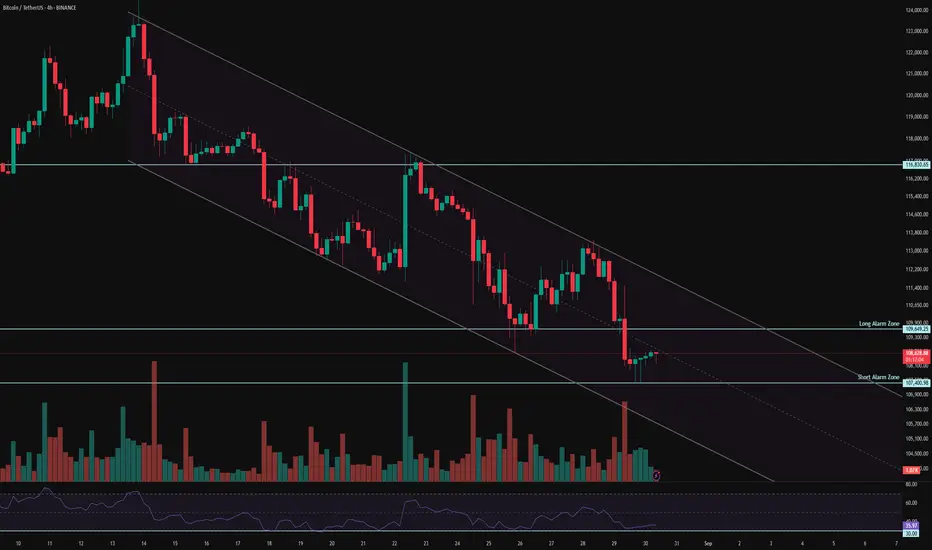
Full Sideways Range Activated · Bitcoin Continues BullishWe are looking at a repeat of May-June. Bitcoin just activated its full long-term, sideways consolidation range. When the lower end of this range is activated, support, we are very likely to see a market reaction in the inverse direction. See the green zone on the chart and from this point forward prices start rising.
There is the possibility of lower, just a bit lower. And this can happen slowly just as it can happen in a flash. It can happen. Right now though we are focusing on a swift, fast and strong recovery. That is, we are betting that there won't be lower prices while at the same time prepared if lower does show up.
Since we keep a map of the bigger picture, a longer or stronger retrace is not a problem because we know that the market will continue to grow. Instead of going SHORT at this point, which can certainly produce a loss of focus, we wait for support and go LONG.
Since $110,000 is already a strong support zone, we are active. Right now $110,000 is obviously resistance because the action is happening below this level. There is something important to keep in mind, keep reading below.
What Bitcoin is actually doing is consolidation. You can focus on Bitcoin, track Bitcoin and lose focus of the altcoins and even while Bitcoin consolidates the altcoins continue to grow. This is my next task.
I will show you many altcoins that are going bullish right now, the last three days, sometimes more. At the time same, from this chart, you can see how Bitcoin has been moving lower since the mid-portion of this month. This disparity reveals what comes next.
A bearish move from $120,000 to $80,000, for example, would be a very strong correction bear market size. As soon as this move starts to develop, if it were happening, the altcoins would either explode into a massive bull market, or would crash that many times harder than Bitcoin. None of this is happening now.
As Bitcoin retraces within a wide range, the altcoins market continues simply to grow slowly, build up bullish momentum, and consolidate. That's all there is and I will now show you some charts.
With all that said, know that we are clear, sure and certain that the best portion of the bull market is yet to come. It is still early, we are missing the bull run phase. Basically, the bull market is still yet to happen, we have to wait for the fireworks and after the fireworks, we have dance, drinks and food and then the bull market ends. In this analogy, we are still at the early stages. Patience is key.
Namaste.

BTC 4H Analysis – Key Triggers Ahead | Day 27💀 Hey , how's it going ? Come over here — Satoshi got something for you !
⏰ We’re analyzing BTC on the 4-hour timeframe timeframe .
👀 In the 4-hour timeframe of Bitcoin, we can see that Bitcoin is moving inside a descending channel where each time it touches the top or bottom of the channel, it shows a reaction to these levels and then leaves a reversal move. Currently, Bitcoin has an important support at the 107,400 area, and if this level breaks, it can move towards its lower supports. On the other hand, there is a resistance at the 109,700$ area, and breaking this resistance could give us a long position.
⚙️ Our key RSI zone is at the 30 level, and the fluctuation is ranging above this level in a close environment. With an increase in volatility and selling pressure, if RSI passes below 30, it could be a confirmation for a deeper correction.
🎮 With a Fibonacci tool, we are going to identify Bitcoin’s key levels. The Fibonacci is drawn from the 117,000$ breakout area down to the 107,300$ support area. The price behavior at the 0 and 0.236 levels can help us for taking trades.
📊 In the 4-hour timeframe of Tether dominance, we can see that similar to Bitcoin but with an ascending difference, it is moving inside a channel. The 4.52% area is very important, as the midline of the channel is located here. In the previous leg of movement, it also reacted to this area and got rejected. Breaking this area could bring more selling pressure into the market and also on Bitcoin.
🕯 The size and volume of the red candles at the breakout zones are getting bigger, each time accompanied by higher selling volume. The presence of maker buyers is seen between the two highlighted zones. With an increase in Bitcoin’s volume, it can start its main trend. Keep in mind that we are in the holiday season.
🔔 The zones considered as alarm zones are the 107,400$ area and the 109,600$ area. The price action in these zones can help us with our trades. With an increase in Bitcoin’s volume, it could break one of these levels and move either up or down. Keep in mind that August has ended, and in the new month we have 3 important news events from the Federal Reserve, which could either bring strong inflows into the market or pull money out of it.
❤️ Disclaimer : This analysis is purely based on my personal opinion and I only trade if the stated triggers are activated .
1000CAT Breakout Alert! 🚨 1000CAT Breakout Alert! 🚨
1000CAT is currently testing the red resistance zone 🔴
If buyers manage a confirmed breakout, the first target will be the green line level 🎯
👉 A breakout here would signal bullish continuation and could push price higher ✅
⚠️ Always wait for confirmation before entering — resistance zones often attract strong sellers first.

RED Market Update📊 RED Market Update
RED is currently retracing after its recent move 📉
If you missed the first entry or are looking for a re-entry / more accumulation, the smart play is to wait for price to reach the green support zone 🟢
👉 Volume Profile shows strong buyer accumulation at this level.
👉 If price pulls back and confirms a bounce, it could provide a high-probability long setup 🎯
⚠️ Reminder: Patience pays — entering at support with confirmation gives the best risk/reward.

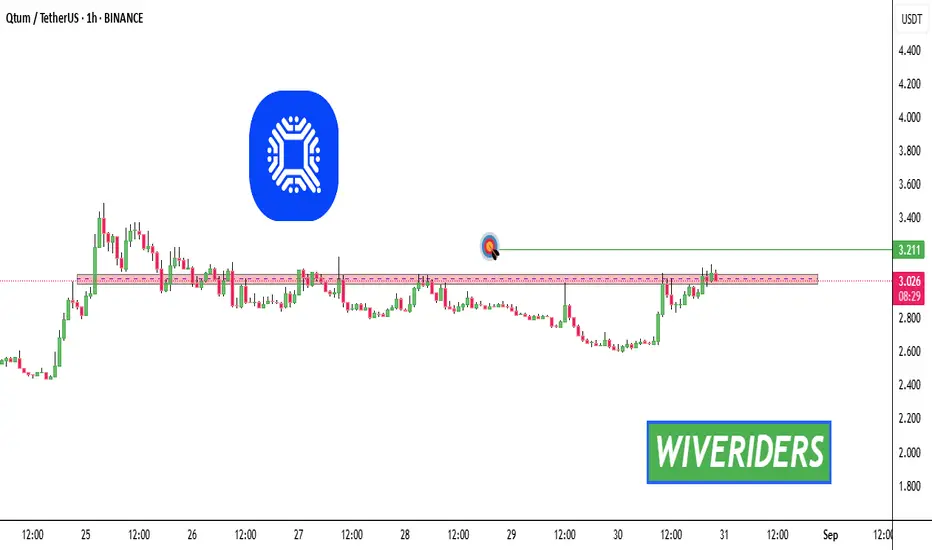
QTUM Market Update📊 NASDAQ:QTUM Market Update
NASDAQ:QTUM is now testing the red resistance zone 🔴 where sellers remain active.
If buyers achieve a confirmed breakout, it could signal the continuation of the bullish trend ✅
👉 The first target on breakout is the green line level 🎯
👉 Clearing this zone would show strong buyer momentum and open the path for further upside.
⚠️ Reminder: Always wait for confirmation — resistance zones often trigger fakeouts before a true move.
Bitcoin is bullish now & many Traders don't see it !!!Well , so far, the price has broken the triangle and the pullback is being completed. From here on, if nothing unusual happens, we can be hopeful that Bitcoin will reach $150k.
previous analysis

MSTR Bottoming Soon?NASDAQ:MSTR continues to range while weekly RSI heads into oversold without a significant pullback, a good sign for a bullish long term outlook.
My downside target for this move remains the High Volume Node, weekly pivot and golden ratio Fibonacci retracement at $290.
The R3 weekly pivot is a solid terminal target at $1039 but could overextend in an irrational environment.
Analysis is invalidated below wave (IV)
Safe trading
