AI Stocks — Bubble? Yes. About to Burst? Not Yet.There is a lot of discussion across the web about a potential bubble in AI-related stocks. While I do agree that we are, indeed, in a bubble, I strongly disagree with the idea that it is about to burst.
To cut through the noise, it’s better to step back from individual names and look at the index, which offers a clearer view of the broader picture.
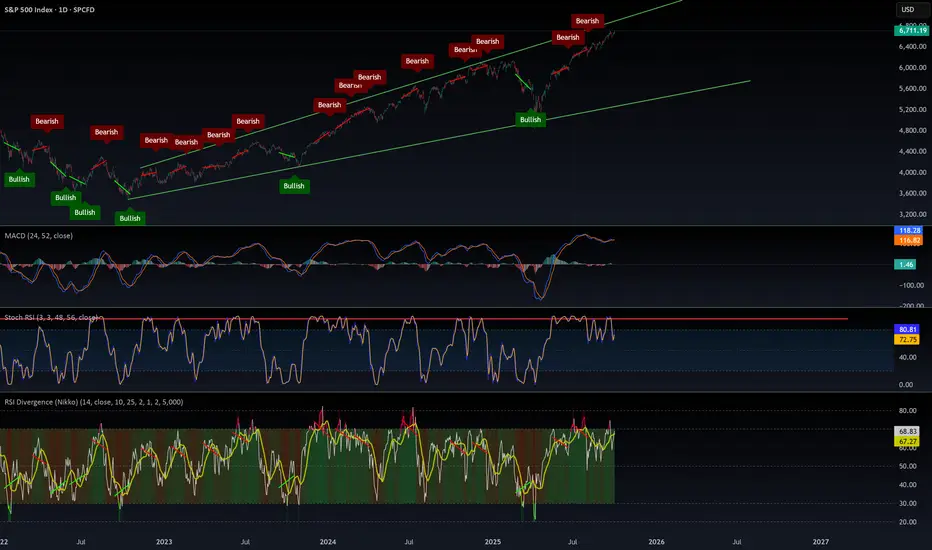
🔎 The Bigger Technical Picture
As seen on the chart:
- After the early-April drop, triggered by the tariff-related headlines, the index resumed a healthy and well-structured uptrend
- Since that low, price has almost doubled, a clear sign of strong and persistent demand
- The correction that began in early November stopped just above the former resistance and the psychological 3000 level
- From there, price resumed higher and is now testing the previous resistance / ATH zone
This type of behavior — old resistance acting as support, followed by a renewed push higher — is textbook bullish structure, even in an overextended market.
⚖️ Valuation vs. Reality
There is no doubt that:
- Price is very extended
- From a fundamental standpoint, valuations is overpriced
- A lot of “phenomenal” future expectations from the AI sector are already priced in
That said, markets do not top simply because something is expensive.
📌 Conclusion
In my view, this is not yet the moment for the bubble to burst.
As long as price structure remains intact, there may still be room to the upside, potentially toward:
➡️ 4500, if not even higher
Timing a top in a momentum-driven market is one of the hardest things to do — and often the most expensive.
As John Maynard Keynes, the father of modern macroeconomics, famously said:
“The market can stay irrational longer than you can stay solvent.”
A reminder worth keeping in mind — especially in environments like this. 🚀
Bubble

NVDA Hagia Sophia CRACKING! CAUTION!NVDA is starting to fall apart. Nice rounding top followed by mini towerspike (as shown in the picture) that is now starting to roll over.
The price was rejected after the first crack that bounced lower. That's the big warning CRACK! Now we wait for the bigger CRACK! to occur.
Despite how small it looks on the chart, the reality is that NVDA has lost 20% or 1/5 of its total value already.
There is only so much B.S. they can come out and say to pump the stock. Eventually, that dies off along with the stock.
Remember! Circular financing is flat-out illegal because it fabricates the appearance of real demand, real capital, or real creditworthiness when none actually exists. It’s the financial version of forging a signature. This administration has gutted the SEC, and no one will dare call it out for what it is in AI. But the markets will always correct for theivery in the end.
NVDA should never have gotten this high. But that is the beauty of Reflexivity. We should all be used to it by now.
Eventually, it will all come crashing down. I hope not with you in it. I urge caution to the bulls!
THANK YOU for getting me to 5,000 followers! 🙏🔥
Let’s keep climbing.
If you enjoy the work:
👉 Boost
👉 Follow
👉 Drop a solid comment
Let’s push it to 6,000 and keep building a community grounded in truth, not hype.

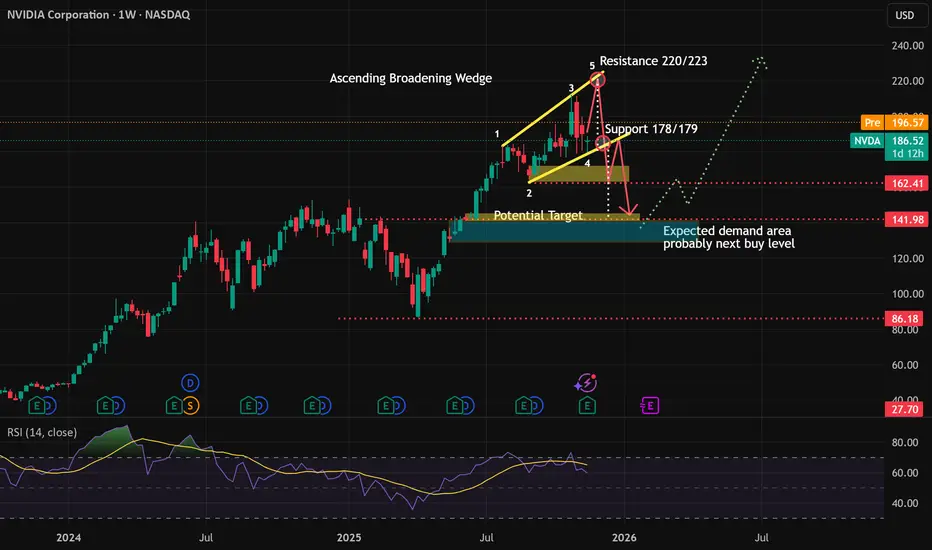
Ascending Broadening Wedge for NVIDIA Weekly ChartThe downtrend probably won't be happen in the near term, but the rebound alson have limited upside. But at least there are 2 possibilities ahead of the price.
I suspect Ascending Broadening Wedge is in process in weekly chart for Nvidia. The concern is the potensial downtrend pressure, especially if support trendline break.
I devide it on 2 scenario :
1. Rebound to 220/223 first. This mean no immediate breakout support anytime soon based on the count. The price will have to raise first with maximum target 220/223 before followed with rejection. But the raise don't have to be exactly 220/223. It can also retest the previous high (3) before rejected and fall.
2. No rebound, support 177/178 immediately broken, the downtren continues to the target area.
There area possibilities to go up first if Santa Claus Rally succeed to push the price above or near resistance, then after the seasonal trade for Santa Claus or January effect will face the profit taking and underpressure through the supportline.
After the pressure, we probably will see some demand on blue area to push the price back on the uptrend..that ofcourse..if no "AI-buble" coming in coming months
DISCLAIMER
Do with your own risk!
This is not suggestion! This is my personal view on the opportunities that could happen to Nvidia.
Jobless Market boom!📉 Job Openings Are Nowhere Near Where They Should Be — and QQQ Is Laughing in Their Face
If you map the post-GFC job-growth trend from the 2009 bottom, we should be sitting at **11 million job openings** today. Even if you throw out the 2022 spike as a COVID distortion, we’re still at **just 7 million**.
That’s a **massive shortfall** — and nowhere close to a healthy labor market.
Meanwhile, QQQ has historically **tracked** job openings…
but this time it’s **completely detached** and gone **vertical** instead.
You can argue feelings, vibes, narratives, bar-stool opinions — but the **data** is screaming one thing:
**We are in a bubble.** Like it or not.
I can only show you the evidence. What you choose to do with it is your business.
But here’s my advice, blunt and simple: GTFO and STFO No Matter where prices go! . Nobody is forcing you to play hero at the top of a cycle, trying to cosplay Warren Buffett for a week.
Most of you are under 40.
Meaning you were maybe 20–23 years old during the last real recession and bear market.
You have *no idea* how fast you can lose money when the trend truly dies.
You’ve spent 17 straight years being trained to “Buy The Dip,”
as if markets only go one direction — up.
That’s not your fault…
But you’re about to learn what a real cycle feels like.
And it’ll be **sooner, not later.**
When the cracks appear, you’ll start doubling down…
rotating into new “opportunities”…
trying to pick bottoms…
revenge trading…
chasing cute stories…
Repeating the same lines every bull market teaches:
“Money on the sidelines,”
“This is the bottom.”
“It’s oversold,”
“Time to load up,”
“You have to be in for the bad to enjoy the good.”
All of it is designed to **soften your fear** and **trigger your greed** right before the trapdoor opens.
Stay sharp. The data doesn’t lie — people do.
Sorry, but it has to be said by somebody!
THANK YOU for getting me to 5,000 followers! 🙏🔥
Let’s keep climbing.
If you enjoy the work:
👉 Boost
👉 Follow
👉 Drop a solid comment
Let’s push it to 6,000 and keep building a community grounded in truth, not hype.

Markets Looking SOFT at highs - Correction Underway (Key Levels)October 10th candle is a very important low for all US Markets
-S&P
-Nasdaq
-Dow
-Russell
The rally from that Oct 10 candle low (Friday) was met with aggressive
support but was only showing rallies in Mag 7 and AI related plays
Earnings for the most part are coming in meeting or exceeding expectations, but
price action is certainly looking soft with the market making lower highs and lower
lows for now
We have plenty of technical support, but given the longest US Government Shutdown
in history with dot.com like valuations (there is bubble and non-bubble evidence),
sentiment and elevated volatility are taking their toll and dragging the markets lower
I've closed a lot of open positions and de-risked the portfolio pretty severely this week
with the intention of finding ways to participate in a cautiously bullish environment. As I mention in the video, markets tend to V bottom, but round out the tops so the longer we
stall at these highs and the more "rounded" look we have near these highs, the more
fragile and support can be if we eventually see a break lower - TBD
Day to day, we continue to do good work carving out short-term winners and properly
position for what is next - good or bad
Thanks for watching. See you in the live markets
-Chris

AI bubble is just startingKeeping it very simple.
It looks like Tech just broke out of the trend to the upside similar to 2nd Stage trend of the Internet bubble.
Compounding factors
-debt cycle turned spiral
-AI circle economy/ Ponzi

$SPX500 by all metrix this is overboughtMarkets can stay irrational longer than we can stay solvent. Right now, we’re at the top of this megaphone pattern, with everything extremely overbought in epic fashion.
⚠️ Caution: the odds of a serious correction are high — the chart points to a potential target around $5,650.
Sure, the madness can continue. The Fed can keep printing USD that pours into stocks instead of the real economy — until people are jobless, starving, and rioting for food.
📈 Enjoy the rally while it lasts, but use stop-losses. This market is dangerously overheated.
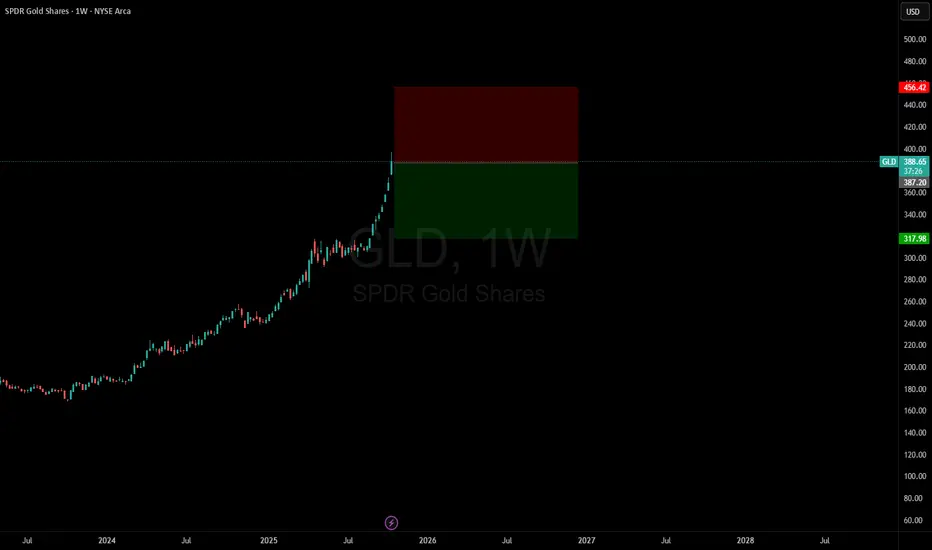
Short GLDGold is now over $4,200 and I believe there is a trade to the down-side.
Understand, it VERY hard to call a top in such a powerful bull market move. Most of the time, you WILL lose this trade.
Even when you do win these type of trades, the price action will usually go against you before it goes in the right direction.
It is a market. You WILL be tested.
That’s how price discovery works.
The truth is that if you're trying to outperform market-level returns, you MUST take risks.
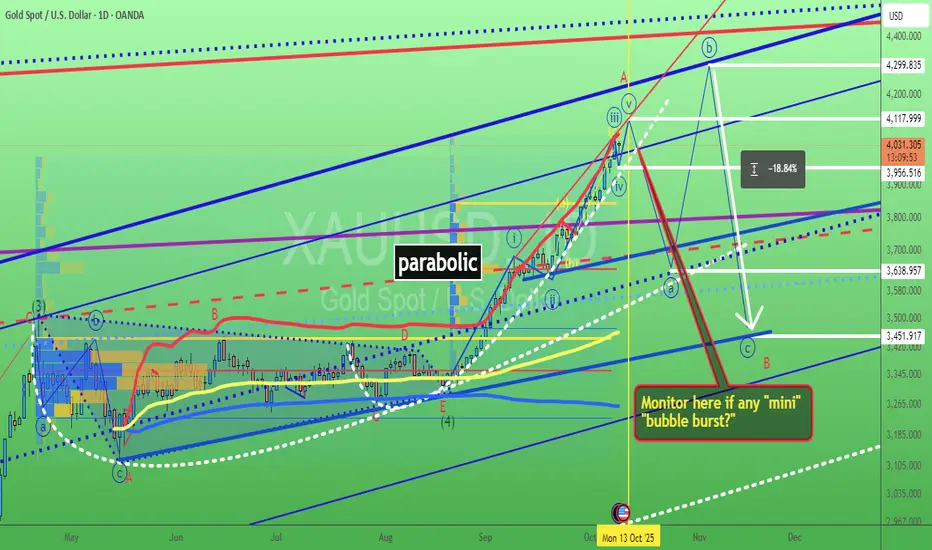
Gold waiting for its "mini" bubble burst? 9/Oct/25XAUUSD is forming another parabolic moves = the basic sign of bubble after triangle breakout. It has surged nonstop with many "mini bubble" inside big bubble So Watchout sudden small bubble burst first before surging for bigger bubble.
The Bursting House Bubble- Like usual, all details are marked simply on the chart :
- Notice that after the 2007 crash, the trend was halted by a major resistance.
- Also note that during the Covid crash, the rebound occurred at the same zone, where resistance had transformed into support.
- The housing market is inflating beyond fundamentals. Prices are being pushed by speculation and unsustainable leverage. History shows that no bubble lasts forever.
- Between 2027 and 2030, the real estate market faces a high probability of a major crash.
- Don’t forget, since Covid-19 they haven’t printed money, but sooner or later, they’ll need an excuse to restart the printing machine… and it’s coming.
Be careful, protect your capital now and diversify, buy when fear floods the streets, that’s how new wealth is created.
Happy Tr4Ding !

Why The Bubble Theory Makes No SenseIt seems like every other week with tech stocks making new all time highs, there is a constant chatter of claiming we're in a bubble. One of the classic signs of a bubble, is excessive leverage betting on ever higher returns.
This is a chart of securities margin loans provided by the Fed updated quarterly. As you can see since the 2008 financial crisis speculators have been very conservative with their use of leverage. It's almost like 2008 scared people so badly people more than a decade later are still behaving financially conservative.
Some of the rational for the talk of a bubble is historically high PE ratios, but this can be explained by massive reinvestments into AI infrastructure by the biggest tech companies. The more investments they make the higher the PE ratios look.
The key ingredient of a bubble is leverage and besides the small spike of it post-covid, there is no sign of excessive speculation.
Remember tech stocks are absolutely going to have a pullback likely next year or 2027, but the fear of a dot-com era bubble is just simply unfounded.

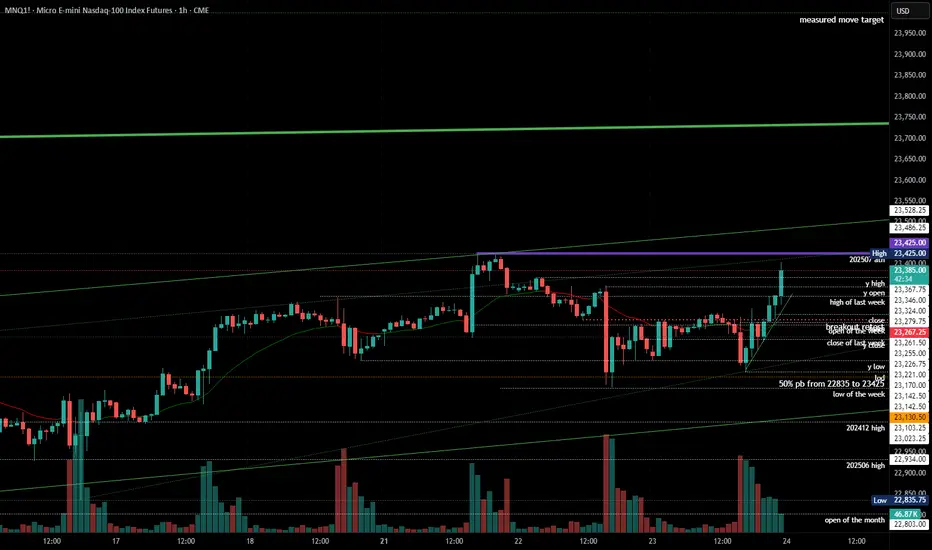
2025-07-23 - priceactiontds - daily update - nasdaqGood Evening and I hope you are well.
comment: Very tight channel up from 23142 but only 1 bear bar since then and in the absence of bear bars, we can only assume sideways to up movement.
current market cycle: bull trend
key levels: 23000 - 24000
bull case: Bulls want to print more higher highs. We are in this bull channel for the whole July now without breaking it and bulls now confirmed the breakout above 23100ish - 3 times. That is the 50% retracement of the last big leg up and very important. A measured move for this leg gives us 24000. Bears have tried with two decent legs to get down to 23000 and failed. I think many will give up on this after hours buying and we can have more meltup into the weekend. Anything bearish would be a big surprise.
Invalidation is below 23250ish.
bear case: Bears tried and failed again. Everything is bought. 1h close below 23250 would certainly stop the max bullishness but bears are really not doing much. We are almost printing daily new ath. Focus on longing pullbacks until the bull channel is broken.
Invalidation is above 24000.
short term: Bullish on any pullback until it stops working.
medium-long term - Update from 2024-06-29: No change in plans. I expect 20000 to get hit over the next 3 months and maybe 19000 again.
trade of the day: Long 23200 has been profitable since Friday.
Ethereum Looks Identical to Early-Day AmazonToday I look at Ethereum versus early-day Amazon and the similarities between the internet bubble and the 2021 crypto bubble. Everyone talks about how the internet bubble popped, but few people talk about what came afterward. There was a strong recovery in the markets, and the internet was mass adopted by the public—along with the technology of home computers.
I believe we are heading into a mass adoption phase for crypto. We've had a bubble-and-pop scenario, and now that major institutions are investing in crypto, we are set up for mass adoption—very similar to what happened with home computing and the internet as a technology. I see Ethereum as being the "Amazon" of this new wave, and Bitcoin as being the "Apple." Big things are coming in these markets.
As always, stay profitable.
– Dalin Anderson

Gold's Surge: Flight to Safety or Foreshadowing Fear?🚨 Gold just saw its largest weekly inflow in history as shown in the chart by BofA Global Research. The metal is soaring above $3,400/oz while most other assets are crashing hard.
This isn't just bullish momentum — it's panic capital. When fear dominates markets, investors rush to safety. And historically, that safety has always been gold.
But here’s the catch: when fear becomes too crowded, even safe havens can become dangerous. If gold fails to hold these levels and begins to correct, it won’t be a slow bleed — it’ll be a free fall, and a lot of people will get caught.
💬 What do you think? Is this just the beginning of gold’s golden age, or are we seeing the early stages of a bubble?

NDX / M2 Double Top? Echoes of the Dot-Com BubbleThis chart compares the NASDAQ 100 (NDX) to the M2 Money Supply, revealing a potentially critical inflection point. The NDX/M2 ratio has reached levels not seen since the dot-com bubble — and now appears to be forming a textbook double top.

SPX to dump 30% - 50% for Inflated Expectations in 2026I like to say the narrative follows the price . This was bound to happen after such an overheated year, couple years. Blame whomever you want, in the end its your wallet if you aren't ready to have your expectations met.
Best case scenario, the breakout of macro is confirmed after the retest (blue arrows). Worst, more likely case, it smashes down to confirm a double bottom with a strong foundation to form a macro support. The sawtooth can provide opportunities for volatile scalps, but its gonna get gnarly I can already tell.

Tracking the Bubble PhasesThe amount of hyper speculation in quantum stocks is still mind boggling. I see this tracking a classic bubble pattern where we may start to flip from the "return to normal" phase to a "fear" sell off as we get closer to earnings (early March). Short this back to under $6 from the bull trap.

Corporate earnings Versus SPXCorporate earnings and stock market getting balanced after 50 years weighted to M2 or money supply. We are entering a bubble territory.

Nvidia Wyckoff Distribution- Volume Decreasing
- Reversal Descending Wedge
- Wyckoff Entered Phase E
If this Scenario comes true, AI Bubble will Burst and we will see Market Crash.
Or at least a recession.
Any Upside Move Wil Invalidate This Analysis.

Quantum Bubble Ready to PopRGTI looks like the poster child of irrational exuberance in quantum stocks. New Year Dump incoming after a 1000% in a little over a month and around 2,500% from the 52-week low. No fundamental new sales or orders to back this new increase which is driving the price to sales to all-time highs.
50-60% pullback imminent. scale in.

BITCOIN Why Do you think I am long PUTS ???The chart from an ELLIOT WAVE Perspective I have now completed 5 of 5 or will need one last pop to 109100 But from a position trade the option are to be placed NOW .I am long In the money PUTS the decline that is about occur should be painful for LONGS in 2025 ,happy holidays WAVETIMER Look at the RSI

Gold - The Next Bitcoin?The markets are beyond stretched—they’re squeezed all the way to the moon.
Today, I heard some major news: Big Money has already left the party, and others are following suit. This is HUGE. It’s also that classic moment when the barber starts sharing his “secret” stock tips.
Now, if you pair this with my recent Bitcoin post—where I outlined how a tulip-like crash could unfold—you’ll see we’re staring at the perfect recipe for a stock market KABOOM.
So, where will traders, investors, and even grandmas rush to when this unwinds? My bet: Gold. Where else? This is when the Gold Rocket ignites, replacing Bitcoin and the MAG7, creating yet another bubble—a glittering tulip 5.0. And just like before, it’ll burst when the fuel runs out.
Buckle up! 🚀

High precision version - BTC log trend DEC/JAN PEAKThis is an updated version of my first logarithmic price trend.
This trend is in line with Bitcoin since it first started to trade.
With highly precise curves that better match the cycles, I now expect to see a
peak in BTC price of $90,400 set to hit somewhere between 14th of November and New Year.
I think the trend will be followed even on the downturn,
forming the 'Mother-of-all Head and shoulders patterns'.
