$PSX Long - bounce off bottom bullish channel and 200 MAGood risk reward, risking $2 to make $3, ideally exit before earnings
Bulish

#XMR - Remins Bullish Aiming for Equal HighsI entered around 190, BY THE timr I posted this it was already 194. In tough timers, look to monero to get you out from under. I've been scalping BTC and ETH. bUT Longing Monero aklways at thje right time. Started with a $100 account for fun in futures, nit at $449 in 2 wees.
Now, a larger time frame it did get rejected zt bearish order block (Chart in messae) fahard but rebounded even harder. There's Natural iquidity sitting above the doyble eual highs. That.s where U believe you can take A BULK of you positino off and continue to see where the trade is headed.
HTF CHART
I don't think ETH amd BTC have hit their lows yet, But Monero will be the one to watch as it continues to climb.

long in amazonwe see a break of bearish trend with a big volume so amazon can go to 2465 as a target

Just a possibility on Bitcoin! Have a look at my Elliot wave analyze, this small triangle is more probable. I expect price goes to 37500 and an small bullish move to 44000. As still haven't finish wave 4 we need to trade very carefully. I have updated last analyze. I am holding all my Long position and I am adding more margin to my long position at 38050. this means, in my opinion in mid-term still we have a bullish move to about 50000 dollars , in case price can be low till 34000 dollars before touching 50000. which will be a good opportunity to add more margin for long.
This analyze will be wrong if 34000 breaks.

EUR/CAD SENDS CLEAR BULLISH SIGNALS|LONG
Hello, Friends!
EUR/CAD appeared on my radar today
With the recent news and corresponding price action
Making me bullish on the pair
Therefore, a move up is to be expected
BUY!
✅LIKE AND COMMENT MY IDEAS✅

USDZAR THis is my trade of the week. usdzar. it has a lot of great structures , i put some descriptions on it, so you may take advantage of it. we hit the first target 860+ pips this week✅. . have a nicce weekend.

Upcoming Months are described clearly.BTC/Kings-Coin Monthly stroll.
The above-mentioned chart stands aiming to explain something about the possibility.

WAVESUSDT WAVES#Crypto Idea ; 037
#Exchange ; Binance
@khancryptoschool
#WAVESUSDT
#WAVES
There have Bullish Falling Wedge
BINANCE:WAVESUSDT

ALGO in Daily Fixing the price above the $ 1.326 range could move the price towards the targets on the chart
Targets around :
1 Fibo at $ 1.1326 - 43%
1.618 Fibo at $ 1.4355 - 82%
2.618 Fibo at $ 2.1063 - 167%
3.618 Fibo at $ 3.0906 - 292%

$V momentum play$V entering the squeeze as MACD crossing and possible curling up to the upside. no latest news about the V some of the news is so so but nothing serious.
in terms of inflation people are being more conservatives about their spending. but in the same time people are out and about after the covid restriction get
lifted up and most stores and amusement park doesn't required face mask.
V average move per day is $3.00-4.00
Day trade or scalp target play: 04/04 /22
Buy call above 227.92 sell at 229.00 or above.
Buy puts below 224.45 sell at 223.24 or below.
option open interest: ideal expiration date: 4/14/22 or 6/17/22
Hello everyone,
welcome to this free technical analysis . ( mostly momentum play )
I am going to explain where I think this stock is going to go over the next day or week play and where I would look for trading opportunities
for day trades or scalp play.
If you have any questions or suggestions which stock I should analyze, please leave a comment below.
If you enjoyed this analysis, I would definitely appreciate it, if you smash that LIKE button and maybe consider following my channel.
Thank you for stopping by and stay tune for more.
My technical analysis is not to be regarded as investment advice. but for general informational proposes only.

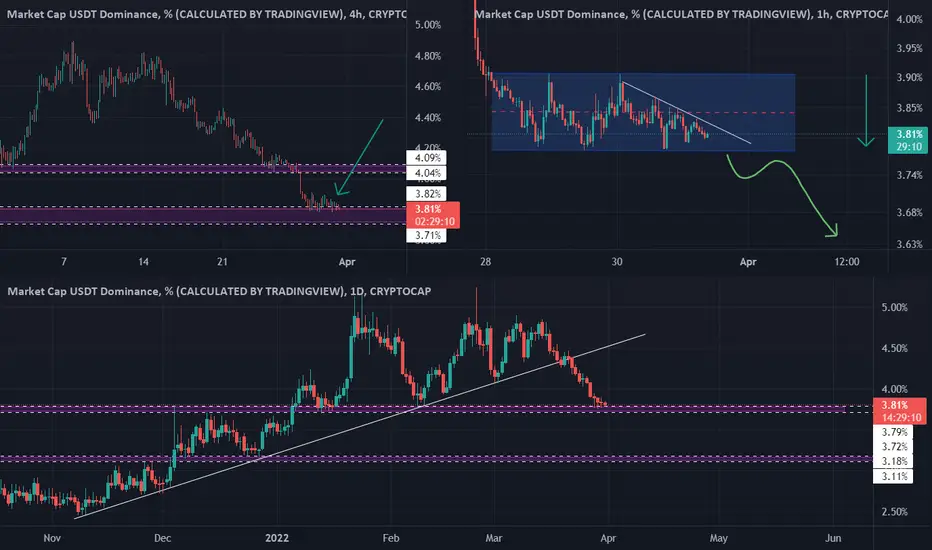
USDT.DAccording to candlesticks in usdt.d in daily time , 4h , as well as the 1h channel
Support is likely to be broken
So bitcoin continues to be positive
Conditions for failing:
Channel breakage from above
XLM (STELLAR) Started Shooting 28/01/2021Hi
as we had specified in the chart
very intuitive
please comment your opinions

$AUDIO 10-20x opportunityMid term (1-3 month).
Take profit 1: 10$
Take profit 2: 20$
Stop loss: 0.7$
Do your own research.

$XCH 17-25x opportunityLong term (6+ month)
Take profit 1: 1400$
Take profit 2: 2000$
No stop loss. #GEM
Do your own research.

FANTOM is bullish$FTM is bouncing off it’s major bullish trendline and the support level. After the bounce off, bullish movement is possible to continue and reach the resistance at 3,1$

$FLOW 4-5x opportunityMid term (1-3 month)
Take profit 1: 28$
Take profit 2: 35$
Stop loss: 5$
Do your own research.

$BNB 2-2.5x opportunityMid term (1-3 month)
Take profit 1: 800$
Take profit 2: 1000$
Stop loss: 275$
Do your own research.

$SAND 2-3x opportunityLong term (3-6 month).
Take profit 1: 8$
Take profit 2: 12$
Stop loss: 2.5$
Do your own research.

$SKL 8-10x opportunityLong term (3-6 month).
Take profit 1: 1$
Take profit 2: 1.5$
Stop loss: 0.08$
Do your own research.

$TWT 5-6x opportunityLong term (3-6 month).
Take profit 1: 2.5$
Take profit 2: 3$
Stop loss: 0.2$
Do your own research.

$ETH 2-3x opportunityLong term (3-6 month).
Take profit 1: 6000$
Take profit 2: 8000$
Stop loss: 1200$
Do your own research.

$TFUEL 3-5x opportunityMid term (1-3 month).
Take profit 1: 0.7$
Take profit 2: 1$
Stop loss: 0.13$
Do your own research.

$ENJ 7-10x opportunityMid term (1-3 month).
Take profit 1: 12$
Take profit 2: 15$
Stop loss: 1$
Do your own research.
