TOMOUSDT is inside a bull flag 🦐After previous Idea the price had a rejection from daily and historical resistance, and the price is starting to create a bull flag. IF the price will have a breakout from it and flip the daily resistance into new support, According to Plancton's strategy (check our Academy), we can set a nice order
–––––
Follow the Shrimp 🦐
Keep in mind.
🟣 Purple structure -> Monthly structure.
🔴 Red structure -> Weekly structure.
🔵 Blue structure -> Daily structure.
🟡 Yellow structure -> 4h structure.
⚫️ Black structure -> <4h structure.
Here is the Plancton0618 technical analysis, please comment below if you have any question.
The ENTRY in the market will be taken only if the condition of the Plancton0618 strategy will trigger.
Bullflagpattern

Waiting for a bull flag before buyingWe are waiting for a bull flag, which will be a continuation pattern for the current up trend.

$fb - buyers in rangenice close today. I like this going into next week.
lots of buyers in this range. bull flagging potentially.

Bull Flag on DOTDOT is building a bull flag with a breakout likely if confirmed. First target would be $10.70 and then onto $11.00 for next target.

GOLD: BULL FLAG BACK TO 1875$ 🧙♂️We have XAUUSD forming a beautiful Bull Flag pattern on the H1 timeframe. The bull flag pattern is usually seen as a bullish breakout pattern among many traders. This sentiment can cause gold to climb back to 1875$. Safe trades, fam!

Bull Flag on COTY: Breakout Would Bring Big UpsideBull flag has formed on COTY. I will be watching price action in anticipation of COTY attempting another breakout of that top resistance line...If a breakout occurs we could see some bigtime upside to $12+....COTY will release its earnings on February 3rd and with all signs pointing to a beat, I believe this could be the catalyst for that breakout and big upside.

XMR/BTC Bull Flag Pattern - Possible breakout upcomingBINANCE:XMRBTC
1st price target around 0.006383
Monero is looking strong and undervalued right now. Fundamentals also point to a higher price.

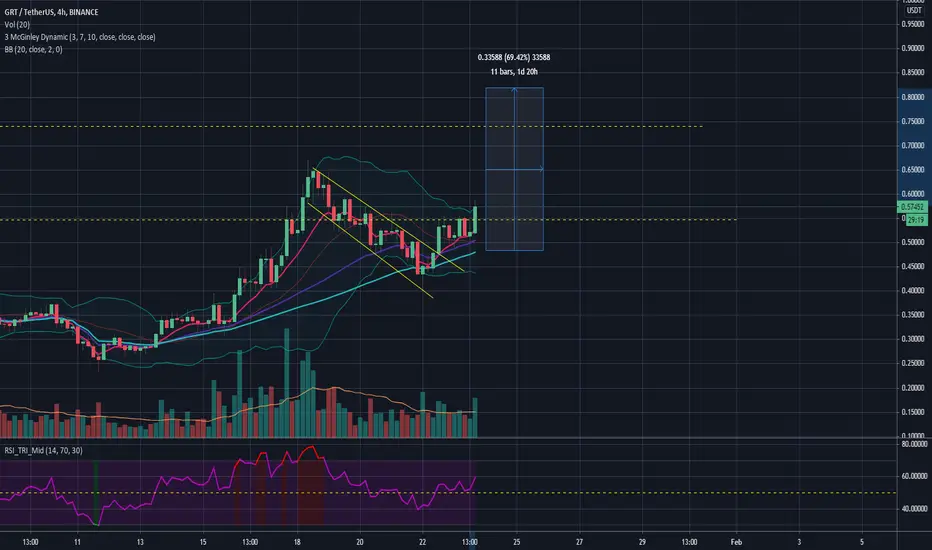
GRT should go to ATHI've entered this trade late because I didn't want to risk. I've sacrified 19% gain but now that the chart has broken out it still have 42% of profit (according to my TA) and should touch ATH
NEOBTC – Another bullflag? 🦐IF $NEO.X will have a breakout upward and flip the 4h resistance into new support, According to Plancton's strategy (check our Academy), we can set a nice order
–––––
Follow the Shrimp 🦐
Keep in mind.
🟣 Purple structure -> Monthly structure.
🔴 Red structure -> Weekly structure.
🔵 Blue structure -> Daily structure.
🟡 Yellow structure -> 4h structure.
⚫️ Black structure -> <4h structure.
Here is the Plancton0618 technical analysis, please comment below if you have any question.
The ENTRY in the market will be taken only if the condition of the Plancton0618 strategy will trigger.

DGB triangle transformed into a bull flagBecause the BTC dump the previous TA I had pubblished changed shape into a bull flag rising the target (+54%). Worst case scenario is that the target won't be reached completely but as you can see it's on the bottom of daily BB and there's a bullish DIV on RSI. Moreover I think some news is on the way which could help speed up the process. I remain optimistic on this one as I'm all in right now (I'm not an holder).

Gold Still Trending Inside Bull FlagGold price has created a descending parallel channel on the chart, and since it occurred after a significant move up it is more commonly referred to as a ‘bull flag’ due to the overall structure of the move resembling that of a pole and flag. The anticipated move here if price can remain inside of the upper half of the bull flag is a continued move higher and a break through and above the upper channel line. Should that happen price will likely march back up to test the recent all-time high made on Aug 10th of $2075/oz, which I’d expect to be taken out and a new all-time high near $2200/oz be made based on other charts that will be shared later with more detailed analysis.
Looking back at 2020 gold price performed extremely well, gaining roughly +43% from the March lows near $1450/oz to the August high of $2075/oz. I’d attribute most of those gains to gold being a fear hedge during times of uncertainty in markets, which we saw plenty of in 2020. Gold also by nature performs well when the underlying currency it is priced in is being inflated(money printing). With a new round of $600 checks recently having been sent out by the outgoing administration, and $1400 checks on the way from the incoming administration, gold should continue to outperform over the next few years as stimulus checks and corporate bailouts appear to be the new norm and a necessity for the economy during these unprecedented times. Regardless of the reason, money printing is inherently bullish for gold so physical and mining shares will continue to be a portion of the portfolio.

BAND/BTC testing median line of channel BAND/BTC looks to have formed a bull flag with a high volume surge followed by a channel formation with decreasing volume. Currently testing the median of this channel, ideally want to see a break upwards of this channel with high volume and continuation.

bullish flag on THETAThe chart is clear, I did this TA some days ago but in the middle BTC messed up the market. The only thing I'm not sure about is if this weird break out would invalidate the TA. Use stop loss, I think the worst case scenario is it won't pump as much it should though....
If you like my work, please support me with coins or BTC/alts donations. You can find addressess on my "about me" section in my profile.
Thank you

Preemptive Bull Flag Target If The Pennant Fails To Breakout~35% retrace from ATH's if the total market cap reaches my target.
Obviously only in play if the pennant breaks to the downside.
Goodluck And Safe Trading.

bullish flag is breaking outUNI has broke out and entered back but it's already popping out again so don't miss this one!

ORCLBull Flag Idea. I would Buy on breakout $64.00 with a stop loss at $62.60 and take profits at the fib extensions . If breakout is hit within the first 30 minutes of market open id wait for a break of that 30 minute high to buy to avoid possibly getting faded to the downside after open. If it takes off running at the open and explodes higher i wouldn't chase it and idea would be void

Bull flags explainedBull Flags are one of the most well known & easily recognized chart patterns.
The most important factor in identifying any flag pattern is the clear "staff" or "flagpole"; there should be a straight run upwards leading up to the pattern or it is not a valid pattern.
After the straight run upward price starts to Zig Zag between two converging trendlines forming a tight wedge (it can be slanted, or even symmetrical) until the price "breaks out" above the upper trendline signifying a possible continuation in trend upwards.
Bull Flags have the highest success rate out of any pattern and work extremely well when paired with long term support & resistance areas. Enter at the invalidation point of the pattern (A), second entry on the bullish retest (B). Pennants that are “tighter” have higher success rates, look for patterns forming on top of long term resistances (not below) to increase probability of success also. Pattern height is measured and added to swing low before breakout for possible target.
Sometimes large size traders can generate liquidity by faking out under the pattern support as we can see on some of the examples. The liquidity generated by triggering stop losses underneath the pattern can fill large position sizes for whales and is a good indicator for a long position once the price confirms support back inside the pattern.


bullish setup of NQ on 30m(bull flag pattern)The zone has already been touched. It's a bit aggressive cuz my setup was based on 4H. From the 30m/15m/5m, I didn't spot any reversal pattern yet.
So this is not a confluence trade. We only got the 4H and trend on our side. No price reaction on smaller tf yet.
Be cautious! First target should be 1:1, and then trail your stops.
Bullish Pennant for Bitcoin?Bitcoin has been creating so many moderately predicable bullish patterns, however, it's tricky swing trading due to fake-outs occurring regularly.
Clearly, BTC is trading in a Bullish Pennant, however, that's always subject to change if the green upward sloping support of the pattern doesn't hold. I have colored the bullish pennant green for ease of visualization because I like leaving previous patterns on my chart to get a sense of the Macro trading environment and areas of confluence, looking back at patterns in hindsight can be a learning experience, no matter how good you are at trading there's always more to learn, especially trading crypto.
RSI is showing a descending triangle with a noticeable bearish divergence. since Jan 5th we've seen the price rise but the RSI traded sideways and downward creating lower high after lower high... It's very likely the bulls defend the bottom area of the descending triangle, expect a bounce near term.
The KST's seen a bearish cross & is trading in a not so perfect descending channel, I am expecting a bullish cross near term because we're oversold and it would characteristic given the trend thus far.

SIEMENS - Bull Flag Breakout with Good Volume support - SwingThis analysis is done purely on basis of price action and chart patterns
Analysis is done on Daily TF hence it may take few days to few weeks for price to reach the given target.
This is not a trade recommendation. Do your own study before entering into any trade.
Trade with your own risk & money management.
Feel Free to comment for any query or suggestion.
Check below in the image, the previous idea/set up in the same stock (for understanding another price action chart pattern.

