AMC - Bullish Butterfly - Swing Trade + 3 TargetsThe Butterfly is one of my favorite Harmonic Patterns for a nice long position. Low Risk with potential High Reward! =)
I don't think the Fundamentals are going to hold it down this season.
Low Risk Entry: < $35
Targets : 15% 30% 50%
Stop Loss: 5%
MEME Stock
Going to accept Bitcoin
Class A Bullish Divergence on the Daily time frame
Butterlfy

The beautiful butterfly is flyingIt seems a butterfly pattern is going to be formed in the BTCUSD weekly chart. If it happens, we will see BTCUSD chart on the prices more than 20K in the early months of 2021.

Bearish Butterfly on AAPLWe can see that the stock is forming probably bearish butterfly harmonic pattern here on Daily chart. Confirmation on 80 RSI level. We will wait and watch it every day, that when i will be forming in blue demand zone. The maximum of supply is 290.00 price at 1,618 Fibonacci retracement level. When it will be forming candlestick pattern SHORT it to the 250 price (take profit). Be careful. Happy trading. -DaveGoody

#GBP_USDnew higher high of the channel and reflexing from prz at butterfly pattern can alarmed us the short signal .....
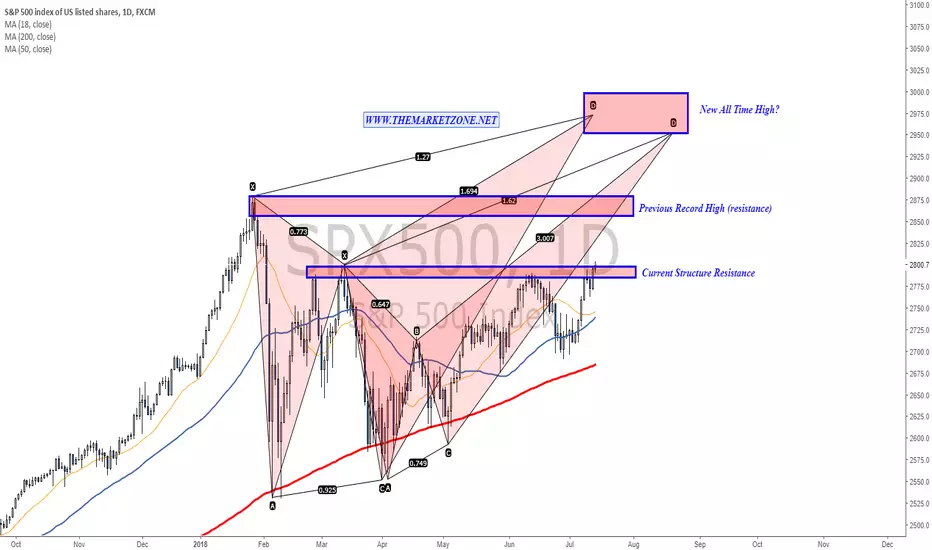
2800 breakout? These are the next Price Zone to watch SPX continues higher and tries to break the 2800 handle.
In case of a successful breakout, a visit to previous record high can be its next destination.
Extremeley bullish? How about new record high just below 3000 as the harmonics suggest?
A fail to break 2800 can lead to a short term correction back to 2750.
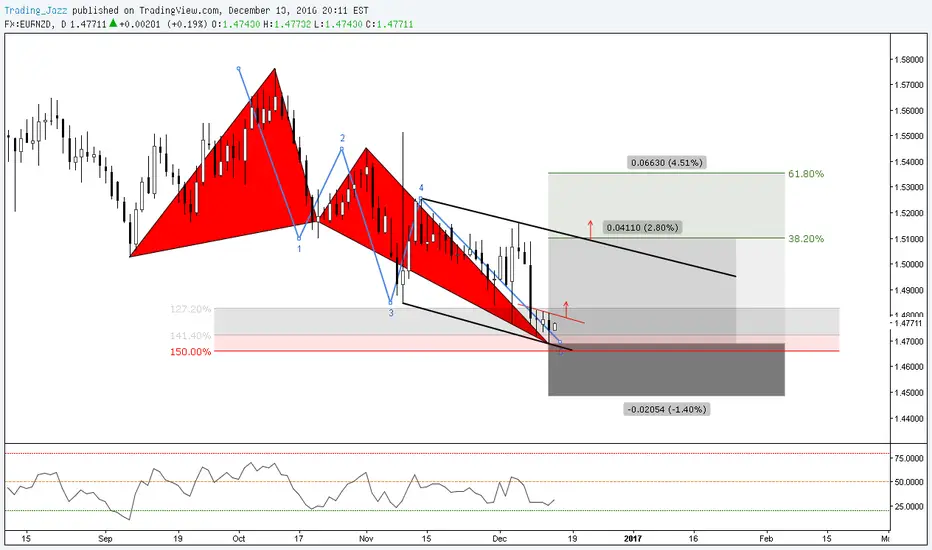
EUR/NZD maybe will create Bearish Butterfly Pattern in D1My view EUR/NZD in time frame D1
Remember to see news high impact for EUR or NZD
Thanks :)

(Weekly) 1dbl bottom 2shoulders 1head 2necks & 1butterflyTVC:SX5E
The amazing price action...
-Reversal double bottom;
-Major bearish trendline broken, the double bottom "neck" broken, validating the double bottom;
-Found resistance at Bearish Butterfly territory;
-Two targets for the Butterfly, the second @2933$ (618% retracement) will forge the 2618 bullish setup with initial and default targets around 3600$, the 127% extension, eventual ab=cd as 2nd target, a 3th and 4th targets above the 161% extension and 224% extension...
-Ascending structure (at yellow) also with a possibility to "support" the price inside it, forging an eventual 3drives pattern in case of a failed Butterfly... directly testing the highs.
-Bearish RSI and MACD Divergence, but looking left/back on previous price action history on similar divergences, the price just forged small degree corrective structures, resuming major trend later...
That said...
Safe Trades;

GBPEUR Bullish ButterflyFirst of all this a beginner's analysis. Bullish butterfly on GBPEUR. Im going short and then going long.
Input welcome

(4h) Structure for Bears Advanced Patterns for BullsFX:CADJPY
Short the Breakout, buy the Bulls Patterns
Bearish Structure Breakout & Eventual Bullish Patterns completion zones.
Safe Trades;

#USDJPY Short Idea Butterfly Pattern with Previous Resistance#USDJPY Short Idea Butterfly Pattern with Previous Resistance

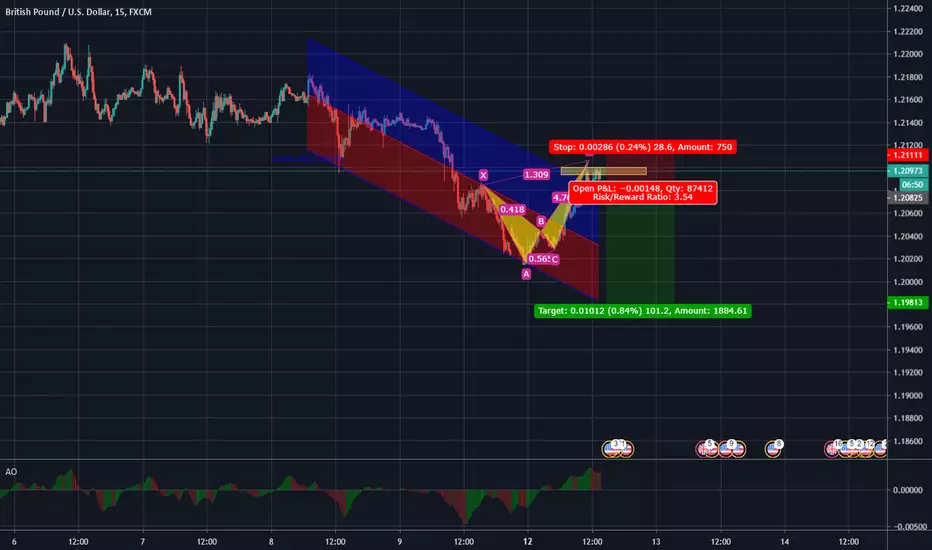
GBPUSD Harmonic Patternsx1 opportunity on GBP/USD with Harmonic Pattern formations on the 1H time frame. Targets at the 38.2 Fib Retrenchment with stops being at the 1.414 Extension of the C-D leg.
Currently Short with the Butterfly completion.

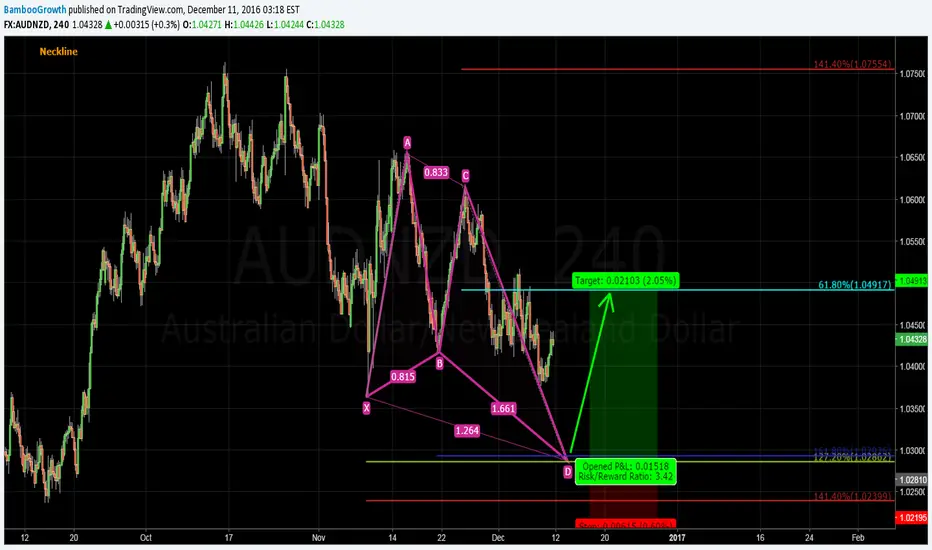
Butterfly Pattern AUDCAD 4 hourButterfly pattern completion on 1.272 area of XA and it false on the 50.0 and 61.8 of the downtrend

NZD/JPY Short - Bearish Butterfly I am somewhat iffy about this trade as the zone where point D could be is HUGGEEEE. I probably won't be trading a lot of butterfly patterns because of this.

The Butterfly Pattern - Rules of EngagementThe Butterfly Pattern
Created by Bryce Gilmore, the perfect Butterfly pattern - here are the rules of engagement for this pattern:
Rule 1:
The Butterfly Pattern begins with a market move/impulse leg that establishes our X and A points.
Once X and A points have been identified, we then look at rule 2...
Rule 2:
The Market forms B completion point by fulfilling at Least 78.6% retracement of the XA leg.
AB move remains valid as long there is at least a 78.6% retracement of XA and does NOT close above the 88.6%
Rule 3:
If rule 1 and 2 has been met, then the market forms the C completion point by fulfilling at least a 38.2% retracement of the AB leg.
Point C remains valid as long as there is at least a 38.2% retracement of AB and there is not a candle close at or beyond the 88.6% retracement of AB.
Rule 4:
If rule 1,2 and 3 have been met, then the market forms the D completion (this will be the entry point) by fulfilling a 127.2% extension of XA.
In a valid CD move, the 127% retracement of XA shows ratio confluence with the 161.8% of AB.
The D completion point must extend past X
Trade Rules/Trade Management:
Entry at D, stop loss 141.3% extension of XA and target 61.8% retracement of AD
GREAT RISK REWARD RATIO
Bearish ButterflyWaiting for valid entry. Bullish trendline has to be broken as long as the pattern is valid.


Possible Bullish Butterfly Looking for a possible reversal with a butterfly combined with HS keep an eye, it is also possible it breaks all the way down, Invalidation is below .66500

USD/JPY bearish butterfly Do not know if this pattern was already finished at 1.27 Fib extension of XA "criteria for take profits would match" . Or it might be finished right at this point at 1.61 Fib extension?!
happy trading :)

#EURUSD Butterfly Pattern Also in Mix with 3 Others#EURUSD Butterfly Pattern Also in Mix with 3 Others

USOIL Daily Chart.Reversal Patterns.So , price can test the daily resistance , if it bounce we can short that if it doesn't could buy that till the next zone Weekly Resistance , where bearish butterfly pattern and gartley pattern confirm.. That would be the most exciting scenario , but we reach there , happy pips!

Bearish formation wait for D completion within PRZ around 88.6%
good amount of confluence Resistance lvl lining up with 88.6% fib
stop loss 40 pips above entry
look to target towards the 0.75332 trail if needed and next towards 0.73921

SPX500. Possible bearish butterflyWe are heading to a possible correction on SPX500 which would mean more sideways action in the nearest term.
Will looks for longs at 2176 level. SL: 2185, TP: 2138
