FireHoseReel | WIF at Decision Point Will 0.317 Hold or Collapse🔥 Welcome To FireHoseReel !
Let’s dive into Dogwifhat (WIF) analysis.
⛳️ WIF Fundamental Overview
Dogwifhat (WIF) is a Solana-based meme coin focused on community-driven trading and speculation. Ranked #121 on CoinMarketCap, it has ~998.8M supply and strong daily volume fueled by hype.
👀 WIF 4H Overview
WIF is currently experiencing a strong bearish trend on higher timeframes. On the 4H timeframe, price is moving inside a large range (box) and is now attempting to break down below the lower boundary of that range.
📊 Volume Analysis
During upward pullbacks, trading volume tends to decrease, while selling volume expands during bearish continuation. If the box support breaks, an increase in sell volume is expected to confirm the breakdown.
✍️ WIF Trading Scenarios
🟢 Long Scenario:
A breakout above the descending curve trendline, followed by a reaction toward the $0.361 resistance, accompanied by a strong surge in buying volume, could initiate a bullish leg relative to the recent decline.
🔴 Short Scenario:
A breakdown below the box structure and loss of the $0.317 support, confirmed by increasing sell volume, could provide a solid short opportunity.
🧠 Protect your capital first. No setup is worth blowing your account. If risk isn’t controlled, profit means nothing. Trade with rules, not emotions.
Candlestick Analysis

FireHoseReel | BNB Daily Analysis #26🔥 Welcome To FireHoseReel !
Let’s dive into Binance Coin (BNB) analysis.
👀 BNB 4H Overview
BNB has reached the vicinity of its key resistance but was rejected after forming a lower high compared to the previous peak. Price is now rotating downward and moving toward the lower boundary of the range (box).
📊 Volume Analysis
As price approached the $876.76 resistance, buying volume weakened and failed to support a breakout. This lack of demand caused a rejection from the level, allowing sellers to take control of price action.
✍️ BNB Trading Scenarios
🟢 Long Scenario:
Our risky pre-breakout trigger has shifted slightly lower and is now located above the newly formed lower high at $869.32. A breakout above this level, accompanied by rising buying volume, would activate our long trigger.
🔴 Short Scenario:
A breakdown of the maker buyer zone, ranging from $819.90 to $807.46, is expected to occur with a strong impulsive (whale) candle. If this level is broken, we will wait for a pullback to enter short positions.
🧠 Protect your capital first. No setup is worth blowing your account. If risk isn’t controlled, profit means nothing. Trade with rules, not emotions.

USD/JPY(20251224)Today's AnalysisMarket News:
The US economy expanded at a rate of 4.3% in the third quarter, the fastest growth in two years, but the US consumer confidence index declined for the fifth consecutive month.
ADP Weekly Employment Report: In the four weeks ending December 6, 2025, private sector employers added an average of 11,500 jobs per week.
Trump: Those who disagree with him will never become Fed Chair. Next Fed candidate Hassett: Predicts monthly job growth may return to 100,000+, and the Fed is far behind the times on interest rate cuts.
Technical Analysis:
Today's Buy/Sell Threshold:
156.30
Support and Resistance Levels:
157.71
157.18
156.84
155.76
155.42
154.90
Trading Strategy:
If it breaks above 156.30, consider buying, with a first target price of 156.84.
If it breaks below 155.76, consider selling, with a first target price of 155.42.

NZDUSD SHORT Market structure bearish on HTFs DH
Entry at Daily AOi
Weekly Rejection At AOi
Daily Rejection at AOi
Potential Head And Shoulder forming on the Daily
Previous Structure point Daily
Around Psychological Level 0.58000
Touching EMA H4
H4 Candlestick rejection
Rejection from Previous structure
Potential Head And Shoulder forming on the H4
TP: WHO KNOWS!
Entry 90%
REMEMBER : Trading is a Game Of Probability
: Manage Your Risk
: Be Patient
: Every Moment Is Unique
: Rinse, Wash, Repeat!
: Christ is King.

Nifty Analysis EOD – December 23, 2025 – Tuesday🟢 Nifty Analysis EOD – December 23, 2025 – Tuesday 🔴
The 26235 Ceiling: Nifty Pauses After Early Volatility.
🗞 Nifty Summary
The Nifty opened with a 44-point Gap Up above the PDH, but the optimism was short-lived as the first minute candle immediately filled the gap.
The index slipped 87 points from the high to mark the day low at 26,119.05. A sharp 77-point recovery ensued, bringing the index back to the 26200 level, where it spent the majority of the session oscillating in a narrow 35-point range (26165 ~ 26200).
Around 2 PM, an attempt to break out was met with heavy rejection at the 26220 ~ 26235 resistance zone.
Nifty eventually closed virtually flat at 26,177.15 (+0.02%), signaling a period of digestion after the recent rally.
🛡 5 Min Intraday Chart with Levels
🛡 Intraday Walk
The session was characterized by a quiet, range-bound environment post the initial volatility. Most of the action took place within the Initial Balance (IB), indicating a lack of directional conviction among institutional players during this weekly expiry.
The failure to sustain above the 26220 zone for the second time is a technical warning that supply is building at these elevated levels.
However, the successful defense of the 26119 low suggests that bulls are not ready to retreat just yet.
📉 Daily Time Frame Chart with Intraday Levels
🕯 Daily Candle Breakdown
Open: 26,205.20
High: 26,233.55
Low: 26,119.05
Close: 26,177.15
Change: +4.75 (+0.02%)
🏗️ Structure Breakdown
Type: Small-body indecision candle (Spinning Top).
Range (High–Low): ≈ 115 points — moderate intraday movement.
Body: ≈ 28 points — minimal real body, reflecting a lack of directional conviction.
Upper Wick: ≈ 28 points — selling pressure confirmed near the 26233 high.
Lower Wick: ≈ 58 points — significant buying response defending the 26119 level.
📚 Interpretation
The Spinning-Top formation at these heights typically indicates exhaustion or consolidation. While the buyers defended the lower levels aggressively (evident in the longer lower wick), the rejection at the top suggests that the bulls are struggling to maintain the momentum required for a breakout. This is a classic “wait-and-watch” candle.
🕯 Candle Type
Spinning-Top / Indecision Candle near Highs — Signals a tug-of-war; the next session will determine if this is base-building for a move to 26320 or the start of a reversal.
🛡 5 Min Intraday Chart
⚔️ Gladiator Strategy Update
ATR: 184.86
IB Range: 87.50 → Medium
Market Structure: Balanced
Trade Highlights:
11:10 Long Trade: SL Hit (Trendline Breakout)
Trade Summary: The market’s refusal to trend today made breakout attempts difficult. The 11:10 long attempt on a trendline break was caught in the range-bound chop, resulting in a stop-loss hit as the price reverted to the mean (26180).
🧱 Support & Resistance Levels
Resistance Zones:
6220 ~ 26235 (Key Supply)
26277
26320 (Major Target)
Support Zones:
26155 (Immediate Pivot)
26104 (Major Support)
26070 ~ 26045
26030
🧠 Final Thoughts
“The 26220 zone is the gatekeeper.”
The market is at a crossroads. For the bulls to regain control, we need a gap-up above 26235 followed by a sustained hold of the 26180 level; this would open the path toward 26320. Conversely, if the index opens below the current range and faces rejection again, we are likely to see a test of the deeper support levels at 26104 and 26070.
✏️ Disclaimer
This is just my personal viewpoint. Always consult your financial advisor before taking any action.

US 100 Index – Can the Year End Rally Continue?News released yesterday that Alphabet were going to buy data center partner Intersect in a deal worth around $5 billion to give it more power generation, alongside the on-going battle between Netflix and Paramount for Warner Bros has thrown the spotlight back on US stock indices, especially now that Larry Ellison, Chairman of Oracle and the world’s 5th richest man is now heavily involved in the deal.
Turning focus to the US 100 index, traders may now be wondering if it can turn its current 3 day winning streak into a longer string of daily gains, even pushing itself back up to challenge its record high set on October 30th at 26277, or whether the rally could run out of steam around current levels (25445, 0630 GMT).
With the Christmas Day holiday less than 48 hours away, today’s volatility driver could be the release of two pieces of US economic data. First up at 1330 GMT is the latest Q3 GDP growth update. Although it’s a second estimate, this could provide further insight into the current health of the US economy and shed some light on whether the market’s expectation of 2 further 25bps interest rate cuts from the Federal Reserve in 2026 is spot on, overblown or understated.
Then, next up is the US consumer confidence reading at 1500 GMT. This number has been under pressure in recent months with households worried about their financial situation and job security. Traders may be looking to see if the number has rebounded at all, which if it has, could be good news for spending and corporate profits over the important festive period.
Technical Update: Santa Rally Only Extends Sideways Range
If the latest 3.7% rally in the US 100 index from its December 17th low at 24644 can even be described as a “Santa rally,” it hasn’t so far at least brought too much in the way of Christmas cheer. As the chart below shows, price action is still trapped between the October 30th high at 26277 and the November 21st low at 23834, suggesting the index remains caught within a broad more balanced range at best.
As we move into the Christmas–New Year trading period, traders may be looking to identify key support and resistance levels to monitor in case a confirmed breakout triggers a more sustained move in the direction of the price break.
Potential Resistance Levels:
Following the latest price strength, the December 10th high at 25844 could now mark the first resistance level. While not a guarantee of further gains, closing breaks above 25844 may now be needed to open the way for additional price strength.
As the chart above shows, if the 25844 resistance were to give way on a closing basis the focus could then shift to the high from October 30th which stands at 26277. A break above that level could then open the way for scope for further upside.
Potential Support Levels:
Of course, the resistance levels highlighted above currently remain intact, and while they do price weakness can still emerge. If that happens, traders could be monitoring how the 25094 level is defended on a closing basis. This level represents half of the latest rally and could be the first support focus.
Closing breaks below 25094 could signal further price weakness, possibly leading to a test of 24644, which is the December 17th low. Closes below 24,644 could then warn of a deeper decline toward 23834.
The material provided here has not been prepared accordance with legal requirements designed to promote the independence of investment research and as such is considered to be a marketing communication. Whilst it is not subject to any prohibition on dealing ahead of the dissemination of investment research, we will not seek to take any advantage before providing it to our clients.
Pepperstone doesn’t represent that the material provided here is accurate, current or complete, and therefore shouldn’t be relied upon as such. The information, whether from a third party or not, isn’t to be considered as a recommendation; or an offer to buy or sell; or the solicitation of an offer to buy or sell any security, financial product or instrument; or to participate in any particular trading strategy. It does not take into account readers’ financial situation or investment objectives. We advise any readers of this content to seek their own advice. Without the approval of Pepperstone, reproduction or redistribution of this information isn’t permitted.

Those who are bullish are right, new highs are not the top.#XAUUSD OANDA:XAUUSD TVC:GOLD
Fueled by escalating geopolitical tensions over the weekend, market risk aversion intensified, driving gold prices higher and easily breaking previous highs to new records. This aligns with our consistent bullish outlook, but we avoid blindly chasing the rally.
Short-term support levels to watch are 4385-4375. If gold prices pull back to this level for the first time during the European session, we can consider taking a small long position in gold.
However, be aware of the current overbought market, suggesting a technical need for a correction. If this correction extends further, it could be substantial. At this point, we need to pay attention to the important support level of 4355-4345. This is where the daily MA5 is located, and it is also the point where the moving averages and the middle Bollinger Band converge in multiple timeframes such as the hourly and 4-hour charts, which provides strong support. Therefore, if gold prices fall further to this level during the day, we can still consider going long on gold.
In short, the most prudent trading approach is to avoid chasing rallies and wait for a pullback before going long

GOOGL low resistance liquidity run to ATHI think this GOOGL 24 hour chart has a great set up to take us back to All-time high.
We got the formation of a bullish fair value gap today.
We have relative highs sitting at 321.31.
Most definitely a low resistance run on liquidity at 332.98.
There was a gap on the weekly timeframe that got filled, and we got a bounce out of it two weeks in a row, and this would be the third week of a bounce .
The only thing that could disrupt this move up, is that there is a bearish weekly Fair value gap that needs to get broken through.
We clear that and it could be smooth sailing.

$GOLD Reached ANOTHER Weekly ATH CloseMaybe Peter Schiff was right 🥸
TVC:GOLD has its highest Weekly Close EVER, again.
If history repeats itself, crypto has a world of hurt ahead of it.
Is the Santa Rally cancelled!? 🤬🎅

BTC bull market is not over, how should we plan for the future?#BTCUSD BINANCE:BTCUSDT BITSTAMP:BTCUSD BITSTAMP:BTCUSD
The BTC market did not experience much volatility over the weekend, and today it only rose to near the 90500 resistance level before falling back again. Judging from the hourly and 4H charts, BTC still has room for a pullback and adjustment, and may need to consolidate again before breaking through the upper resistance. Short-term support is at 87800-87000. If it falls back to this level, we can consider taking a small long position in BTC. The key support level remains at 85500-85000. As long as this range holds, the bullish trend for BTC remains intact

The Sun May Be Setting On EJ's Break of HighsOANDA:EURJPY has made an impressive Bullish Rally after breaking out of the Resistance that was holding price down around 183 - 183.1, but currently seems to be showing a great deal of exhaustion with a strong Bearish Reversal pattern forming, the Evening Doji Star!
The Evening Doji Star consists of 3 candlesticks:
1) Large Bullish Candle
2) Doji Candle
3) Large Bearish Candle
If Bears are able to Close this candle strong down at the Lows of the large Bullish Candle that started the pattern, this will be great Confirmation of the pattern and we can expect that price will continue to push down!
The next level of structure expected to be visited will be the Previous Resistance at the 183 - 183.1 level.

Long trade Buyside trade 3
Mon 22nd Dec 25
LND Session AM
10.55 am
Entry 1.4662
Profit level 1.4970 (2.10%)
Stop level 1.4609 (0.36%)
RR 5.81
SUIUSDT.P — Sentiment Analysis Summary- Buyside trade
5min TF entry
Sell-side liquidity has been exhausted below the NY session low, with price now accepting above prior value and targeting buy-side liquidity resting in premium inefficiencies — short-term bullish bias remains intact while HTF structure remains rotational
🧭 Structural Context
Price has successfully defended the prior NY Session Low (19th Dec) and the 5-min demand zone, confirming sell-side exhaustion. Subsequent price action shows higher lows and impulsive displacement, indicating bullish intent rather than corrective relief. The most recent London-to-early NY price action indicates acceptance above the prior value, not rejection.
PD Arrays & Imbalances
Multiple 5-min FVGs below the price have been mitigated, reducing downside draw.
The current structure is trading inside bullish inefficiency, supporting continuation.
💧 Liquidity & Order-Flow Narrative
Sell-side liquidity, which has been below recent lows, has been fully consumed.
No sustained acceptance below that zone → assume bearish continuation invalidated.
Price is now gravitating toward buy-side liquidity resting above:
Prior London & Tokyo session highs
NY Session High (19th Dec) ~1.4970
Untapped premium FVGs
🧠 Smart Money Read:
Downside liquidity was engineered to reload long inventory, followed by controlled upside expansion.

HAYW - US LongPrice holding old historic level with fast price action above it.
Above weekly 200ma
RSI Above 50
Poss tweezer bottom on the support
3 TPs

NZD/JPY: Bullish Rally ContinuesIt appears that NZDJPY is expected to continue its upward trend, potentially reaching the 91.43 level.
A confirmed break of structure on the intraday chart suggests a strong presence of buyers.
Given the lack of high-impact news today, the market is anticipated to maintain a robust bullish sentiment.

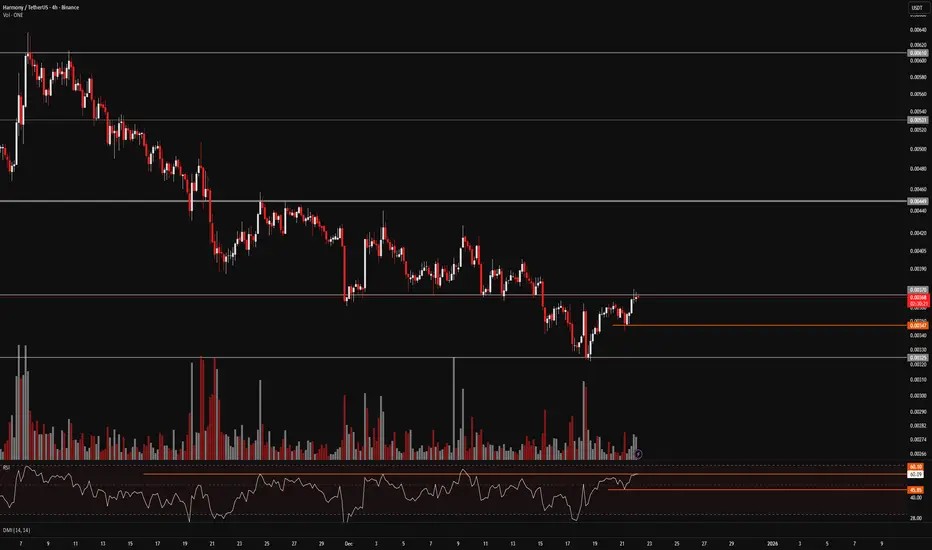
FireHoseReel | ONE Compression Below 0.0037 Signals Expansion🔥 Welcome To FireHoseReel !
Let’s dive into Harmony (ONE) analysis.
⛳️ ONE Fundamental Overview
Harmony (ONE) is a layer-1 blockchain focused on fast, low-fee transactions and sharding scalability. ONE is currently ranked around #330 on CoinMarketCap and is used for fees, staking, and governance.
👀 ONE 4H Overview
ONE has been trading inside a 4H range and is now testing the top of the range and its key resistance at $0.0037. A breakout above this level could trigger a bullish leg, potentially retracing part of the previous downside move.
📊 Volume Analysis
During the recent declines, ONE showed strong selling pressure. Now, as price trades just below resistance, the move toward this level has been supported by rising buy volume, which increases the probability of a breakout.
✍️ ONE Trading Scenarios
🟢 Long Scenario:
A breakout above $0.0037, with sustained buying volume and active buyer participation, along with RSI breaking above 60.1, could provide a solid long setup.
🔴 Short Scenario:
A breakdown below $0.00347, combined with increasing sell volume, a strong rejection from the current resistance, and RSI dropping below 45.85, could activate a short trigger.
🧠 Protect your capital first. No setup is worth blowing your account. If risk isn’t controlled, profit means nothing. Trade with rules, not emotions.
LDO Forming Higher Low Under Daily Resistance🔥 Welcome To FireHoseReel !
Let’s dive into Lido DAO (LDO) analysis.
⛳️ LDO Fundamental Overview
Lido DAO (LDO) is a leading liquid-staking governance token ranked around #84 on CoinMarketCap, enabling ETH staking rewards while keeping assets liquid and driving DeFi participation.
👀 LDO 4H Overview
LDO bounced from a monthly support level and moved higher, forming a higher low at $0.5267. Price is now trading just below its daily resistance at $0.5591.
📊 Volume Analysis
After testing the daily resistance, LDO experienced declining volume and selling pressure. Following the higher low formation, buyers stepped in again. If buying volume continues, the $0.5591 resistance could be broken.
✍️ LDO Trading Scenarios
🟢 Long Scenario:
A breakout above $0.5591 with increasing buy volume, along with RSI breaking above 56.58, increases the probability of a breakout and can trigger a long setup.
🔴 Short Scenario:
A breakdown below the current low at $0.5267, combined with rising sell volume and RSI dropping below 41.94, can activate a short setup.
🧠 Protect your capital first. No setup is worth blowing your account. If risk isn’t controlled, profit means nothing. Trade with rules, not emotions.

EURCAD: Another Bullish Pair 🇪🇺🇨🇦
EURCAD looks bullish to me too.
The price nicely reacted to the underlined horizontal support
and violated a strong intraday falling trend line.
The market will grow more now.
Goal - 1.618
❤️Please, support my work with like, thank you!❤️
I am part of Trade Nation's Influencer program and receive a monthly fee for using their TradingView charts in my analysis.

EURGBP: Bullish Move From Trend Line 🇪🇺🇬🇧
EURGBP will likely rise after a test of a major rising trend line on a daily.
A formation of a bullish imbalance candle on an hourly time frame
provides a strong confirmation.
I expect a pullback at least to 0.8749
❤️Please, support my work with like, thank you!❤️
I am part of Trade Nation's Influencer program and receive a monthly fee for using their TradingView charts in my analysis.

FireHoseReel | BNB Daily Analysis #25🔥 Welcome To FireHoseReel !
Let’s dive into Binance Coin (BNB) analysis.
👀 BNB 4H Overview
BNB is currently trading near a key resistance level and is likely to show a reaction at this zone before attempting a breakout. As you can see, buying volume is gradually increasing, which supports a potential upward move.
📊 Volume Analysis
As mentioned in the previous analysis, a significant amount of capital from buy-side makers was deployed within a single 4-hour candle. With buyers’ momentum continuing, BNB still has the potential to push higher.
✍️ BNB Trading Scenarios
🟢 Long Scenario:
A confirmed breakout above the current resistance around $876.56, accompanied by strong buyer participation and increasing volume. Additionally, the RSI oscillator should break above the 60.68 level to validate the long setup.
🔴 Short Scenario:
A breakdown below the buy-side maker support zone between $819.69 – $808.06 could trigger a sharp downside move. Losing this zone may occur via a whale-driven move, so the preferred entry would be on the pullback after the breakdown.
🧠 Protect your capital first. No setup is worth blowing your account. If risk isn’t controlled, profit means nothing. Trade with rules, not emotions.

Nifty Analysis EOD – December 22, 2025 – Monday🟢 Nifty Analysis EOD – December 22, 2025 – Monday 🔴
26150 Conquered! Bulls Charge Into New Territory.
🗞 Nifty Summary
The Nifty opened with an explosive 119.25-point Gap Up from the PDC, positioning itself more than 87 points above the PDH.
After a brief 32-point step back to mark the day low at 26,047.80, buyers took charge with immediate conviction. Within the first five minutes, the index crossed the strong resistance of 26104 and began a confident climb toward 26155.
After multiple attempts during the afternoon session, Nifty successfully breached 26155, marking a day high of 26,180.70. The session concluded at 26,172.40, gaining a massive +206.00 points (+0.79%).
While the bulls successfully held the ground and closed above the critical 26155 mark, the relatively narrow intraday range of 133 points (post-gap) suggests that while momentum is high, a retracement might be on the cards if rejection occurs at the 26220 ~ 26235 zone tomorrow.
🛡 5 Min Intraday Chart with Levels
🛡 Intraday Walk
The primary story of the day was the market’s ability to sustain such a large gap up without immediate profit booking. Breaking 26104 so early in the session converted a major resistance into a rock-solid floor.
The subsequent grind toward the day high showed controlled buying. However, traders should note that the actual intraday expansion was limited compared to the opening gap, which sometimes hints at “exhaustion gaps” if follow-through is missing tomorrow.
For now, the successful close above 26155 keeps the short-term bias firmly in the bulls’ court.
📉 Daily Time Frame Chart with Intraday Levels
🕯 Daily Candle Breakdown
Open: 26,055.85
High: 26,180.70
Low: 26,047.80
Close: 26,172.40
Change: +206.00 (+0.79%)
🏗️ Structure Breakdown
Type: Strong Bullish candle (Near Marubozu).
Range (High–Low): ≈ 133 points — healthy intraday expansion after the gap.
Body: ≈ 117 points — reflecting strong bullish dominance and price acceptance.
Upper Wick: ≈ 8 points — almost no rejection near the day’s high.
Lower Wick: ≈ 8 points — buyers immediately absorbed the minor early dip.
📚 Interpretation
The candle is a classic momentum indicator. The close near the day’s high with minimal wicks suggests that participants were comfortable holding positions at elevated levels. It reinforces the breakout from the previous week’s consolidation and places the index within striking distance of the next major psychological barriers.
🕯 Candle Type
Bullish Marubozu-Style / Momentum Candle — Shows strong continuation strength; bulls firmly in control.
🛡 5 Min Intraday Chart
⚔️ Gladiator Strategy Update
ATR: 192.68
IB Range: 89.95 → Medium
Market Structure: ImBalanced
Trade Highlights:
No Trade
Trade Summary: The strategy rules restricted an IBH breakout trade today. The combination of an imbalanced market structure and a large Gap Up (covering nearly half the expected daily range), followed by a very narrow initial move, correctly led to a “no-trade” day. This preserved capital in a session that offered limited R:R once the initial gap was priced in.
🧱 Support & Resistance Levels
Resistance Zones:
26220 ~ 26235 (Immediate Hurdle)
26277 (All-Time High / Major Target)
26320
Support Zones:
26104 (Major Support)
26070 ~ 26045
26030
25985
🧠 Final Thoughts
“The bulls are breathing thin air at 26170.”
While the price action is undeniably strong, the narrow intraday range compared to the massive gap suggests we might see a brief cool-off.
Tomorrow’s session is critical: a breach of 26235 opens the doors to a new All-Time High. However, if Nifty faces a sharp rejection at the 26220 zone, expect a retracement back toward the 26104 support level to fill the “hidden” liquidity void created by today’s gap.
✏️ Disclaimer
This is just my personal viewpoint. Always consult your financial advisor before taking any action.

USDJPY – Shorts Left Reeling after Position SqueezeThe Bank of Japan hiked interest rates 25bps (0.25%) last Friday and the outcome in FX markets was for USDJPY to rally 1.4% from 155.46 to close at its highest level since January 14th at 157.76. Not what the shorts were hoping for! These types of moves usually occur when the outcome of a risk event is widely anticipated in advance and traders’ have already positioned accordingly.
In the case of USDJPY, Bloomberg reported on Friday that all 50 economists it surveyed ahead of the interest rate decision, expected a rate hike, and the move was already around 95% priced into Japanese government bond markets. Looking closer at the price action going into the BoJ meeting, USDJPY had spent most of the previous 3 weeks probing lower levels between 154/155 (see main chart) as traders positioned for what they expected to be a stronger JPY and weaker US dollar.
Once the press conference, led by Governor Ueda, failed to provide more specific details on the timeline for future interest rate hikes from the Japanese central bank in early 2026, traders were forced to cut weak short USDJPY positions in thin pre-Christmas liquidity which then exacerbated the squeeze to the topside.
Looking forward, Japanese authorities may not be happy with USDJPY pushing to even higher levels above 158, or possibly more concerning the 160 level, which hasn’t been seen since July 2024. They could consider the idea of intervention to stop the upside momentum in its tracks, something that may add an extra layer of volatility to FX markets during the holiday period.
With this backdrop in play, staying apprised of the technical situation, alongside identifying potential support and resistance levels could be useful to assist trade planning.
Technical Update: Can the Latest Price Strength Re-engage an Uptrend?
USDJPY posted an impressive gain of more than 2% last week, supported by the market’s reaction to what traders interpreted as a ‘dovish’ rate hike from the Bank of Japan, which weighed on the JPY side of the currency pair. This move has brought USDJPY toward the first potential resistance at 157.89, which is the November 20th high.
Traders may now be asking whether this potential resistance can prove strong enough to halt the current advance and even turn activity lower once more, or if a closing break above 157.89 could occur, suggesting the possibility of further price strength.
Potential Resistance Levels:
Having marked the highest USDJPY trade since November 20th, the 157.89 level may initially be the first resistance focus over the Christmas period. How this level is defended on a closing basis may be pivotal with successful breaks above 157.89 potentially skewing the risks towards USDJPY pushing on to higher levels.
As the weekly chart above indicates, if resistance at 157.89 does give way on a closing basis, the focus might then shift to the January 2025 high at 158.88. A break above this level could then expose the potential for moves toward 161.95, which is the July 2024 high.
Potential Support Levels:
Of course, the resistance at 157.89 may still cap USDJPY prices, allowing fresh price weakness to develop. In this scenario, the focus could turn to 156.48 as the first possible support level. This is the 38.2% Fibonacci retracement of last week’s range. Closing breaks below 156.48 may be required to open potential for moves to lower levels.
A confirmed closing break below 156.48 in USDJPY could trigger further downside pressure, with 155.69, the deeper 62% retracement, emerging as the next support. If this level also gives way, the downside potential may extend toward a test of 154.39, which is the December 16th low.
The material provided here has not been prepared accordance with legal requirements designed to promote the independence of investment research and as such is considered to be a marketing communication. Whilst it is not subject to any prohibition on dealing ahead of the dissemination of investment research, we will not seek to take any advantage before providing it to our clients.
Pepperstone doesn’t represent that the material provided here is accurate, current or complete, and therefore shouldn’t be relied upon as such. The information, whether from a third party or not, isn’t to be considered as a recommendation; or an offer to buy or sell; or the solicitation of an offer to buy or sell any security, financial product or instrument; or to participate in any particular trading strategy. It does not take into account readers’ financial situation or investment objectives. We advise any readers of this content to seek their own advice. Without the approval of Pepperstone, reproduction or redistribution of this information isn’t permitted.

Elite | XAUUSD | 4H – Weekly Market Structure Outlook New ATH |OANDA:XAUUSD
After rejecting from the ATH double-top region, price corrected deeply into higher-timeframe demand, where buyers regained control. The market respected trend support and printed a clean structural continuation, followed by consolidation and breakout. Current price is approaching a critical resistance band where reaction is expected before the next directional expansion.
Key Scenarios
✅ Bullish Case 🚀
If price holds above the recent breakout zone and shows acceptance:
🎯 Target 1: Previous ATH zone
🎯 Target 2: ATH extension
🎯 Target 3: New price discovery highs
❌ Bearish Case 📉
If price rejects strongly from resistance and breaks below the bullish structure:
🎯 Downside Target 1: Broken structure retest zone
🎯 Downside Target 2: Trend support / demand area
Current Levels to Watch
Resistance 🔴: ATH / Weekly supply zone
Support 🟢: Breakout base & ascending trend support
⚠️ Disclaimer: This analysis is for educational purposes only. It is not financial advice. Please conduct your own research before trading.

XAUUSD Dec 18th 2025 Daily BiasBias: Bullish above 4,315
Resistance :
4,354 – 4,360 → Supply / TP1
4,381 → ATH liquidity
4,400 → Psychological extension
Support :
4,310 – 4,315 → Decision zone
4,285 – 4,290 → Demand
4,265 → Bias invalidation ❌
Execution will be shared only on confirmation.
Caution: Not a financial advice , Trade at your own risk
