Gold: Next Big Move🌟 Gold: Preparing for the Next Big Move
Gold has been consolidating between $4,260 and $4,170 since November 28, building pressure for its next major breakout. This tight range suggests accumulation, similar to previous setups before strong impulsive rallies. These weeks require patience, discipline, and solid risk management.
Today is crucial:
📉 If the Fed cuts rates, gold could enter its final bullish rally of the year.
📊 Current market surveys show ~90% probability of a 25 bps cut, which historically boosts gold as real yields drop and safe-haven demand increases.
Additional context:
🔥 Geopolitical tensions (Venezuela–USA, Middle East) continue to support a risk-off environment.
💵 The US Dollar Index (DXY) has been weakening ahead of the decision — another bullish factor for gold.
📈 CFTC data also shows increasing net long positioning in gold futures, signaling strong institutional interest.
Gold is coiling.
The breakout — when it comes — will be massive.
OANDA:XAUUSD
Candlestick Analysis

GC daily trade plan for Dec 10, 2025Gold is in the consolidation range. Market is awaiting FOMC meeting. I do not expect any big moves ahead of that meeting however I will watch for trade signals at the extremes of that consolidation

FireHoseReel | Uniswap Is Approaching a Market Decision Zone🔥 Welcome To FireHoseReel !
Let’s jump into Uni Swap (UNI) market analysis.
👀 UNI 4H Overview
UNI is currently trading inside a range box, with resistance at $5.858 and support at $5.445.
A breakout from either side can lead to a major move. Looking at the chart history, every strong upside move has been followed by a deep correction, yet the impulses themselves have been very sharp and aggressive.
📊 Volume Analysis
UNI volume on Binance is currently not very strong, so clear confirmation is still missing.
However, when UNI starts printing high volume on Binance as well, it signals increased trader attention.
A rise in volume would be a logical confirmation for the next price move.
✍️ UNI Trading Scenarios
🟢 Long Scenario:
A breakout above $5.858 can activate our long trigger, but this setup requires a clear increase in buying volume for confirmation.
🔴 Short Scenario:
A breakdown below the $5.44 support can push price toward the next demand zone.
This move should be confirmed with a strong rise in selling volume, making it a valid short opportunity.
🧠 Protect your capital first. No setup is worth blowing your account. If risk isn’t controlled, profit means nothing. Trade with rules, not emotions.

FireHoseReel | BNB Daily Analysis #19🔥 Welcome To FireHoseReel !
Let’s dive into BinanceCoin (BNB) analysis.
👀 BNB 4H Overview
BNB is currently trading inside a large 4H range box. A breakout from this box could trigger a major move.
The $922 level stands as both the top of the range and the 38% Fibonacci retracement of the previous bearish leg.
On the downside, $881 is acting as a freshly formed support zone.
📊 Volume Analysis
Volume slightly increased during the attempt to break $922, but buyers lacked enough strength and selling pressure followed.
A strong and sustained increase in volume will significantly raise the probability of a valid breakout.
✍️ BNB Trading Scenarios
🟢 Long Scenario 1:
A confirmed breakout above $922 creates a solid long opportunity.
Entry confirmation should come from a stable increase in buying volume.
🟢 Long Scenario 2:
You may enter on the 4th test using a stop-buy order with a wider stop, targeting around RR = 2.
⚠️ This type of entry should be executed with maximum 0.5% risk per trade to avoid heavy losses.
🔴 Short Scenario:
Since the broader structure behind price is strongly bearish, and the market previously experienced an aggressive drop from a distribution zone,
a break below the newly formed $881 support can activate a short position, confirmed by rising sell volume.
🧠 Protect your capital first. No setup is worth blowing your account. If risk isn’t controlled, profit means nothing. Trade with rules, not emotions.

GBPUSD – Bearish BiasWe are calling a bearish bias on GBPUSD for today.
Yesterday’s price action gave us a textbook sign of weakness:
Price took the previous day’s high and low, cleared both sides of liquidity, and still closed bearish — and importantly, it closed outside the previous day’s low.
This confirms a clear continuation narrative with institutional sell-side delivery likely.
What this means:
As long as GBPUSD trades below yesterday’s low, the market is signaling further downside expansion.
Bearish Expectations:
Potential continuation into lower liquidity pools
Retracements into premium zones can offer high-probability sell setups.
Bias remains bearish unless we close back above yesterday’s high
Stay aligned with the flow. 👌

EUR/CAD: Dead Cat bounce?An interesting bearish setup may have emerged on EUR/CAD. After breaking below trend support on Friday, the pair has held beneath that level and is now consolidating tightly near the lows. Both the broken trendline and the October trough are acting as resistance, reinforcing the risk that any rebound may prove shallow.
If downside momentum resumes, support layers around the 1.60 handle and the 200-day moving averages become natural targets for sellers.
Matt Simpson, Market Analyst at City Index.

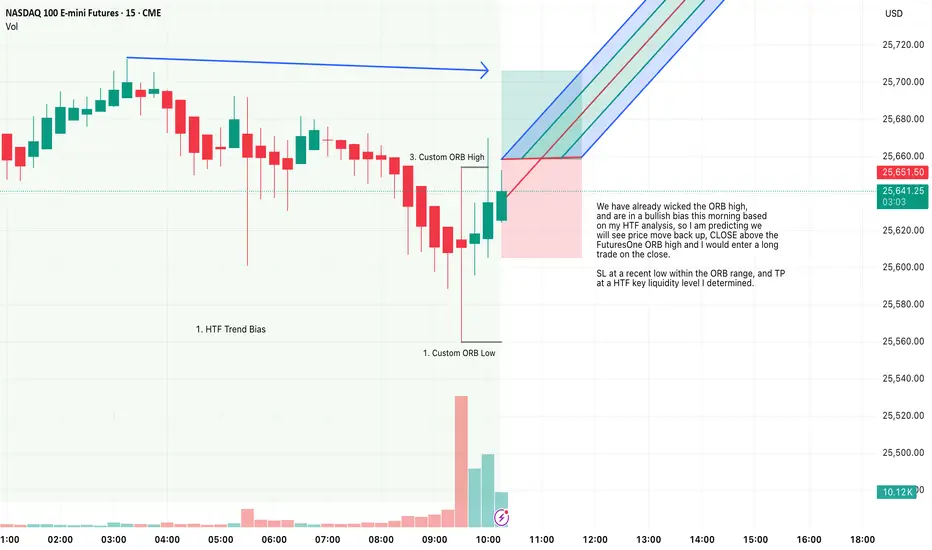
FuturesOne ORB, Long, NQ1, HTF Bias EntryFor this Idea, I am looking at a Long on NQ1.
Price has already wicked the ORB high,
and are in a bullish bias this morning based
on my HTF analysis, so I am predicting we
will see price move back up, CLOSE above the
FuturesOne ORB high and I would enter a long
trade on the close.
SL at a recent low within the ORB range, and TP
at a HTF key liquidity level I determined.
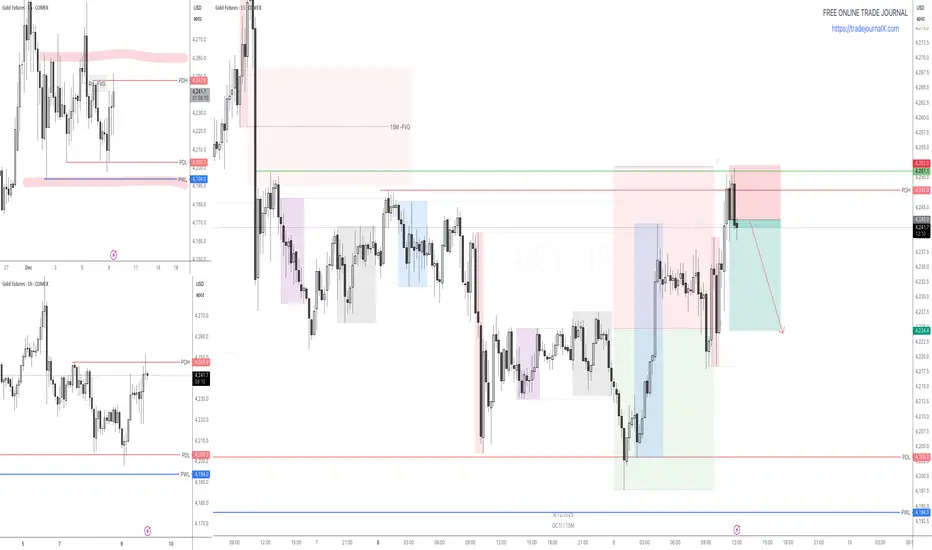
Selling GCBased on my morning analysis selling GC from Daily range high to the middle of the range. Going for 1:2 RR
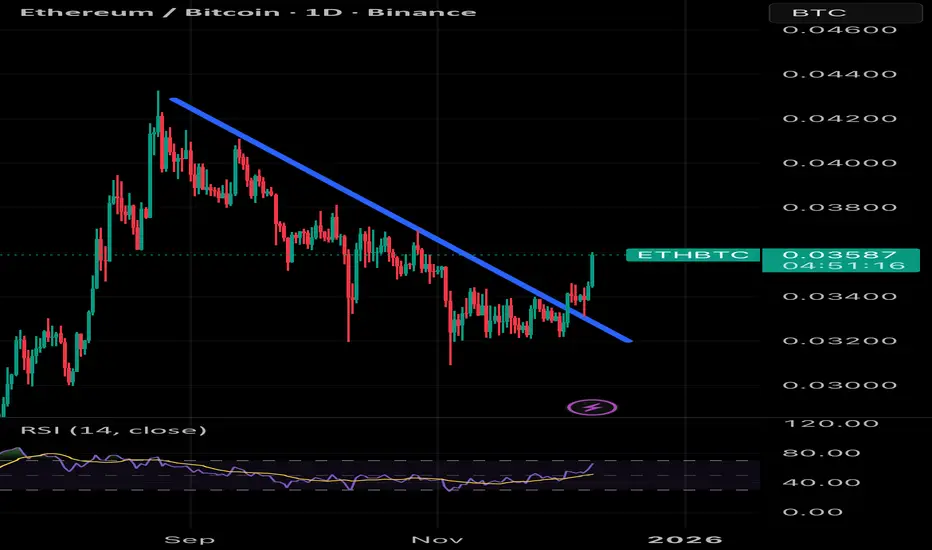
$ETH / $BTC Breakout on Daily TimeframeETH/BTC has appeared to breakout on the daily timeframe, with a successful backtest and continuation higher. This is a great sign for alts in general, but remaining cautious with all the volatility that comes with FOMC decisions. Would like to see this hold and have a strong weekly close to give a clearer picture on mid term direction!
AUDJPY 2ND SELLS2nd sells on AJ. Manage risk well.
Breakeven when price breaks structure at that line.

CADCHF Active!Gave the trade out for free. Buys at OB after liq sweep.
You can wait for ltf confirmations to join the buys.


XAU/USD Daily Outlook – Tuesday Strategy
The Tokyo session offered a decent buying opportunity, which I utilized by opening a position at 4175.5 and closing at 4185. This early move reinforces the view that intraday selling pressure remains limited, aligning with my mid-term bullish bias.
Market Context
Investors have largely priced in a Federal Reserve rate cut, but the real risk lies in the magnitude of the easing cycle. A milder-than-expected approach could disrupt linear bullish momentum and introduce volatility. With the Fed decision scheduled for Wednesday, the market is in a cautious stance, balancing technical setups with macro uncertainty.
Technical Outlook
Key Resistance: 4200 (psychological benchmark)
Bullish Scenario: I’ll remain on the sidelines until we see a clean break above 4200.
Once confirmed, I’ll engage long positions targeting 4219 as the next resistance zone.
Bearish Scenario: Price action below 4176 could give sellers momentum, but I’ll avoid shorts unless 4164 is invalidated.
If that happens, targets will be 4152 and 4135.

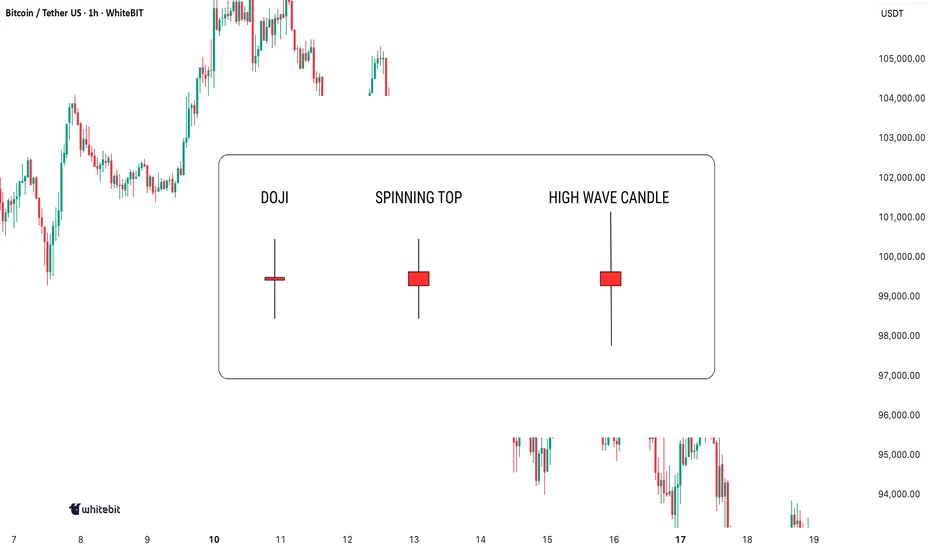
Indecision on the Chart: What These Candles Really MeanIndecision in the market? You're not alone. Every trader has faced those moments when the charts seem to scream confusion. But here's the thing: indecision candlestick patterns aren't just noise. They hold secrets that, when decoded, can give you the upper hand. Let's dive in and learn how to spot these patterns and use them to your advantage.
Mastering Indecision Candlestick Patterns
The most well-known indecision candles are the Doji, Spinning Top, and High Wave Candle. These candlesticks might seem tricky at first, but once you learn to recognize them and understand their context, they can serve as valuable tools in your trading strategy.
Doji
A Doji has a small body with nearly identical open and close prices, and long upper and lower wicks, indicating market indecision—neither buyers nor sellers gain control during that period.
When to look for confirmation: A Doji alone isn’t enough to trade. Wait for confirmation from the next candle: a bearish one after an uptrend may signal a reversal, while a bullish one after a downtrend might indicate the start of a rally.
Spinning Top
A Spinning Top is an indecision candle with a small body and longer upper and lower shadows. It indicates uncertainty, with more volatility than a Doji.
When to look for confirmation: A Spinning Top is more meaningful after a strong trend. Following an uptrend, it could signal weakening momentum. Wait for the next few candles to confirm the market’s direction.
High Wave Candle
The High Wave Candle is like the Spinning Top but with even longer wicks. It shows high volatility with no clear direction, as the price fluctuates widely but the open and close remain close, indicating indecision.
When to look for confirmation: Use the High Wave Candle with trend analysis. If it appears during consolidation or after a major move, it may signal a breakout. As with other indecision candles, wait for confirmation before acting.
Combining Indecision Candles with Indicators
While indecision candle patterns can provide useful insights, they are most effective when combined with other technical indicators. Here are some ways to use them in combination:
Moving Averages: Use moving averages (like the 50-period or 200-period) as a trend filter. If a Doji or Spinning Top forms above a moving average and the next candle confirms a reversal, it may signal trend continuation.
Relative Strength Index (RSI) : If an indecision candle forms when RSI is at extreme levels (above 70 or below 30), it may signal an upcoming pullback or reversal.
Volume: A high-volume candle following an indecision candlestick often confirms strong follow-through. Without volume, these patterns may be less reliable.
Where to Avoid Using Indecision Candles
While indecision candles are useful, there are some scenarios where relying on them without confirmation can be misleading:
Choppy Markets: Indecision candles appear frequently and may not signal real reversals.
During News Events: Sharp price spikes can create false indecision signals.
Lack of Context: A Doji in sideways price action has less significance than one after a strong trend.
Indecision candles signal uncertainty, but don’t act on them blindly. Always combine them with other analysis and make decisions based on your own judgment!
GBPAUD SHORT Market structure bearish on HTFs 3
Entry at Daily AOi
Weekly Rejection at AOi
Previous Weekly Structure Point
Daily Rejection at AOi
Previous Daily Structure Point
Daily Head and Shoulder Pattern, Retest of the neckline
Around Psychological Level 2.01500
H4 Candlestick rejection
Rejection from Previous structure
TP: WHO KNOWS!
Entry 105%
REMEMBER : Trading is a Game Of Probability
: Manage Your Risk
: Be Patient
: Every Moment Is Unique
: Rinse, Wash, Repeat!
: Christ is King.

NZDCAD SHORT Market structure bearish at HTFs 3
Entry at both Weekly And Daily AOi
Weekly Rejection at AOi
Previous Weekly Structure Point
Daily Rejection at AOi
Daily EMA retest
Around Psychological Level 0.80000
Touching EMA H4
H4 Candlestick rejection
TP: WHO KNOWS!
Entry 115%
REMEMBER : Trading is a Game Of Probability
: Manage Your Risk
: Be Patient
: Every Moment Is Unique
: Rinse, Wash, Repeat!
: Christ is King.

EURUSD Pullback analysis chart.EUR/USD – Structure & Trend Summary
EUR/USD is moving inside a descending channel, respecting both the upper trendline (lower highs) and the lower trendline (lower lows). Price continues to react from the channel boundaries, confirming a bearish market structure.
Recent price action shows:
Rejections from the upper trendline, forming repeated HH (lower high attempts) but failing to break the bearish channel.
Strong bearish impulses from each lower high, creating symmetrical downward legs.
Support touches on the lower trendline, followed by corrective pullbacks.
The latest swing has again rejected the upper channel line and is showing momentum toward the downside.
Bias: Bearish
Expectation: If structure continues to hold, EUR/USD may extend toward the lower trendline once again, aligning with previous –0.37% measured moves.
Key Notes:
Channel resistance remains strong.
Market respecting HH → HL swings but still failing to break bullish structure.
As long as price stays below the trendline, bearish continuation remains likely.
What you think about EURUSD, write your feedback in comment section.

GOLD (XAU/USD): Consolidation ContinuesGold is currently consolidating within a horizontal parallel channel.
We spotted a notable bullish reaction to its support:
the price formed a small double bottom pattern and subsequently started to rise, violating its neckline with a bullish imbalance.
It is highly probable that the price will reach the 4220 level soon.

Mother line provides support to falling Nifty. Mother line or 50 EMA has provided today incredible support to Nifty which rose 111 points from low of the day to close at 25839. Still the Nifty closed 120 points below previous close. Now of the Mother line support is held we can see comeback of Nifty and rally can restart from there on. For the rally to restart we need a closing above 25930. The next resistance if we get a closing above 25930 will be 26062. Further resistance can be at 26194, 26352 and finally the channel top is near 26596. Supports for Nifty will be at 25728 (Mother Line support), Mid-Channel support is near 25608, 25338 is the final support. If this support is broken the father line support is at 24917.
Disclaimer: The above information is provided for educational purpose, analysis and paper trading only. Please don't treat this as a buy or sell recommendation for the stock or index. The Techno-Funda analysis is based on data that is more than 3 months old. Supports and Resistances are determined by historic past peaks and Valley in the chart. Many other indicators and patterns like EMA, RSI, MACD, Volumes, Fibonacci, parallel channel etc. use historic data which is 3 months or older cyclical points. There is no guarantee they will work in future as markets are highly volatile and swings in prices are also due to macro and micro factors based on actions taken by the company as well as region and global events. Equity investment is subject to risks. I or my clients or family members might have positions in the stocks that we mention in our educational posts. We will not be responsible for any Profit or loss that may occur due to any financial decision taken based on any data provided in this message. Do consult your investment advisor before taking any financial decisions. Stop losses should be an important part of any investment in equity.

GOLD (XAUUSD): High Chance for a Pullback
Gold may go up after a test of a key intraday/daily support
and a little trap below that.
Expect a rise at least to 4216
❤️Please, support my work with like, thank you!❤️
I am part of Trade Nation's Influencer program and receive a monthly fee for using their TradingView charts in my analysis.

How to find an entry point within a trading range#XAUUSD TVC:GOLD OANDA:XAUUSD
Gold rebounded as expected after retracing to around 4170. Those who followed this strategy and executed long trades may consider taking profits and exiting the market. From the daily chart, the short-term gold price is below the MA5 and MA10, indicating a weak market. If it cannot effectively break through the short-term resistance of 4185-4195 and hold above the daily MA5 and MA10, then gold still has room for a pullback. Meanwhile, looking at both the daily and weekly charts, in the absence of major news events, there is strong support at 4150-4140, which may trigger short-term fluctuations. The first pullback to this level could present an opportunity to go long on gold.

Nifty Analysis EOD – December 9, 2025 – Tuesday🟢 Nifty Analysis EOD – December 9, 2025 – Tuesday 🔴
Deep Plunge and V-Shape Recovery: Buyers Defend 25700 Zone on Expiry Day.
🗞 Nifty Summary
The session began with a bearish continuation, gapping down 52 points below the PDL and immediately slipping a further 152 points. This aggressive sell-off was halted precisely at the Gap Zone of 25740 ~ 25715, where a strong V-shaped recovery began.
A rapid 120-point bounce tested the 25840 resistance, and bulls subsequently pushed the index above the Initial Balance High (IBH). However, the 25920 ~ 25930 zone, which had acted as support yesterday, now flipped polarity and aggressively pushed the Nifty back down toward 25800. After struggling to hold this level, the market closed at 25,839.65.
Despite the early selling pressure, the strong buying interest emerging from the lower levels allowed the index to close within a critical support zone. If this is a base-building process, today’s low must be held firmly in the upcoming session.
🛡 5 Min Intraday Chart with Levels
🛡 Intraday Walk
The overall day was characterized by the market remaining within the IB range, indicating action after the Initial Balance (IB) was formed. The early plunge confirmed the short-term bearish sentiment from yesterday’s close. However, the strong V-shaped rally from 25728 shows resilience and active defense from buyers.
The most important observation is the polarity flip: 25920 ~ 25930 is now confirmed as a strong overhead resistance zone that bears are defending.
The recovery effort was significant, but the inability to close above 25850 keeps the short-term bias negative.
📉 Daily Time Frame Chart with Intraday Levels
🕯 Daily Candle Breakdown
Open: 25,867.10
High: 25,923.65
Low: 25,728.00
Close: 25,839.65
Change: −120.90 (−0.47%)
🏗️ Structure Breakdown
Type: Bearish candle with a Long Lower Wick, forming a spinning top structure.
Range (High–Low): ≈ 196 points — moderately high volatility.
Body: ≈ 27 points — very small body showing intraday indecision.
Upper Wick: ≈ 57 points — buyers attempted to push higher but failed to sustain momentum.
Lower Wick: ≈ 112 points — strong buying attempt from lower levels (25700 zone).
📚 Interpretation
The small body and the long lower wick are highly suggestive of base-building or base formation near the crucial 25,700 support. The strong recovery from the deep low minimizes the bearish impact of the open. Although the close was below the open, the size of the lower wick signals resilience and suggests that sellers may be exhausting their supply at these lower levels.
🕯 Candle Type
Indecision Candle with Bullish Lower-Wick Support — Shows potential base-building; the next session’s action will confirm trend continuation or reversal.
🛡 5 Min Intraday Chart
⚔️ Gladiator Strategy Update
ATR: 205.82
IB Range: 162.95 → Large
Market Structure: ImBalanced
Trade Highlights:
14:04 Short Trade - Target Hit (R:R 1:1.24) (Contra Trade: PDL + IBH + trendline failure)
Trade Summary: Given the extreme opening volatility (Large IB) and the IBH forming below the PDL, the system correctly avoided the standard IBL breakout long trade. It later capitalized on a successful contra short trade during the brief failure near the high.
🧱 Support & Resistance Levels
Resistance Zones:
25930 ~ 25920 (Immediate Polarity Flip Resistance)
25985
26030
Support Zones:
25800 (Immediate Psychological)
25740 ~ 25715 (Critical Base Support)
🧠 Final Thoughts
“The test of 25,700 determined the day’s recovery.”
The strong defense of the 25700 zone is the primary victory for the bulls today, preventing a catastrophic breakdown. The key challenge for tomorrow is the flipped resistance at 25920 ~ 25930. Bulls must reclaim and hold this level to negate the bearish short-term bias. If today’s low (25,728) breaks, the next major target will be much lower.
✏️ Disclaimer
This is just my personal viewpoint. Always consult your financial advisor before taking any action.

AUDCAD: Move Up is Expected 🇦🇺🇨🇦
There is a high probability that AUDCAD will continue rising.
A bullish change of character and a formation of an imbalance
candle after the Australia interest rate decision this night,
suggest a strong buying sentiment.
Goal - 0.9218
❤️Please, support my work with like, thank you!❤️
I am part of Trade Nation's Influencer program and receive a monthly fee for using their TradingView charts in my analysis.
