USDCAD: Time to Recover?! 🇺🇸🇨🇦
USDCAD may finally start recovering after a test of a daily
historic key support.
After a liquidity grab below that, I see some signs of strength of the buyers
on an hourly time frame.
Goal will be 1.36395
❤️Please, support my work with like, thank you!❤️
I am part of Trade Nation's Influencer program and receive a monthly fee for using their TradingView charts in my analysis.
Candlestick Analysis

GBPCAD LONGMarket structure bullish on HTFs 3
Weekly Rejection at AOi
Previous Weekly Structure Point
Daily Rejection at AOi
Previous Daily Structure Point
Around Psychological Level 1.86500
Touching EMA H4
H4 Candlestick rejection
Rejection from Previous structure
TP: WHO KNOWS!
Entry 120% TPT 115%
REMEMBER : Trading is a Game Of Probability
: Manage Your Risk
: Be Patient
: Every Moment Is Unique
: Rinse, Wash, Repeat!
: Christ is King.

Gold VS Silver 80 Year distributive range. Textbook Wyckoff Distribution #2 schematic on GOLD vs SILVER.

EURUSD LONGMarket structure bullish on HTFs 3
Entry at Both Weekly And Daily AOi
Weekly Rejection at AOi
Weekly Previous Structure Point
Daily Rejection at AOi
Daily EMA retest
Around Psychological Level 1.17500
H4 Candlestick rejection
Rejection from Previous structure
TP: WHO KNOWS!
Entry 115% / 145% TPT
REMEMBER : Trading is a Game Of Probability
: Manage Your Risk
: Be Patient
: Every Moment Is Unique
: Rinse, Wash, Repeat!
: Christ is King.

Long trade 🟡 MGC1! — Buy-Side Sentiment Analysis (5-Minute)
Observed: Tue 27th Jan 2026
Session: London Session AM
Time: 3:55 am
Trade Details
Entry: 5,077.1
Take Profit: 5,108.1 (0.61%)
Stop Loss: 5,068.5 (0.16%)
Risk–Reward: 3.6R
🟢 Directional Bias
Buy-side continuation:
Price action reflects sustained institutional accumulation, with a higher-low structure holding and price compressing beneath upside liquidity.
🧠 Market Sentiment Overview
Early-session pullback failed to gain acceptance lower
Sellers were absorbed in the inside discount
Buyers defended value and reasserted control
This is controlled accumulation, not reactive short covering.
🧩 Structural Context
Higher-low structure remains intact
No bearish BOS or displacement observed
Price respects internal range lows before rotating higher
Structure supports continuation rather than distribution.
📊 Volume Profile & Value
Acceptance above key value areas
No sustained trade below POC
Value continues to follow price higher
This confirms a bullish auction environment.
🟦 PD Arrays / Fair Value Gaps
Entry aligned with bullish FVG mitigation
Clean reaction from inefficiency confirms demand
No unfilled downside imbalance of significance
Downside liquidity appears largely neutralised.
⏱️Session Behaviour
Asia consolidated and built a structure
London AM delivered continuation, not manipulation
Typical profile for trend continuation into NY
Session timing supports buy-side intent.
🧾 Summary
MGC1! shows buy-side sentiment during the London AM session, with price holding above value and respecting bullish FVG support. Compression beneath equal highs suggests continuation toward upside liquidity.

Long trade GBPJPY — Buy-Side Sentiment & News Context (15-Minute)
Date: Mon 26th Jan 2026
Session: NY Session PM
Time: 12:30 pm
Bias: Buy-side continuation
Trade Details
Entry: 210.847
Take Profit: 212.590 (0.82%)
Stop Loss: 210.473 (0.17%)
Risk–Reward: 4.66R
Market Sentiment Overview
Sharp sell-off cleared sell-side liquidity below prior equal lows
Rejection from the imbalance zone shows aggressive absorption
Rapid reclaim of value signals institutional participation, not retail short-covering
🧩 Structural Context
Sell-side liquidity sweep completed into the lower range
Bullish displacement back into the prior structure
Formation of a higher low relative to the sweep
📊 Volume Profile & Value
Price re-entered and held above POC / value low
Value acceptance confirms a bullish auction
Volume no longer supports lower prices
⏱️ Session Behaviour (Why NY PM Matters)
London set the range
NY AM delivered the liquidity sweep
NY PM shows continuation intent, not reversal
Textbook London manipulation → NY expansion sequence.
📰 News & Macro Backdrop (Contextual, Not Event-Driven)
JPY remains structurally weak due to persistent yield differentials
No immediate BoJ tightening catalyst priced into this session
GBP sentiment supported by relative yield stability vs JPY
Absence of high-impact NY releases → technicals dominate price
Macro conditions do not conflict with the buy-side GBPJPY continuation model.
🎯 Trade Logic
Sell-side liquidity cleared
Price accepted back above the value
Buyers defended pullbacks
Buyside liquidity is resting higher within the range
🧾 Summary
GBPJPY shows buy-side continuation following a sell-side liquidity sweep and strong absorption during NY. Acceptance above value and supportive macro conditions favour continuation toward premium liquidity.

NZDCHF LONG Market structure bullish on HTFs 3
Entry at Daily AOi
Weekly Rejection at AOi
Previous Weekly Structure Point
Daily Rejection At AOi
Previous Daily Structure Point
Touching EMA H4
H4 Candlestick rejection
Rejection from Previous structure
TP: WHO KNOWS!
Entry 105%
REMEMBER : Trading is a Game Of Probability
: Manage Your Risk
: Be Patient
: Every Moment Is Unique
: Rinse, Wash, Repeat!
: Christ is King.


EUR/CAD - SELLH4 Engulf trapped in H4 supply zone and cllsing inside previous day range. Empty space to the downside to fill.

Cup and Handle formation in SYMMETRYPrice has formed a clear Cup & Handle structure, indicating accumulation followed by controlled consolidation. The pattern remains valid above 14.50, with resistance levels at 15.10, 16.90 (neckline), and 21.00 based on classical cup projection.
A daily close below 13.30 would invalidate the setup.

AUDUSD: Ready to Fill the Gap?! 🇦🇺🇺🇸
It looks like AUDUSD is finally going to fill the gap.
Today's early morning price action looks bearish to me
and I anticipate a downward movement to 0.6899 level.
❤️Please, support my work with like, thank you!❤️
I am part of Trade Nation's Influencer program and receive a monthly fee for using their TradingView charts in my analysis.

USDJPY – Intervention Risks ElevatedLast week G10 currency markets started moving again after a period of low volatility. It was initially led by a resumption of the ‘sell America’ trade that gained traction when President Trump threatened European allies with new tariffs over his pursuit of Greenland and his constant political attacks on the Federal Reserve independence, which weighed on the dollar.
For USDJPY, the shift to the downside was given more impetus when the Ministry of Finance (MoF) stepped in to check prices with local dealers, after the Bank of Japan (BoJ) left interest rates unchanged at their meeting on Friday morning. This move gathered further momentum when the Federal Reserve of New York did the same later Friday afternoon, adding weight to the theory that the US administration is ready to assist in lowering the USDJPY exchange rate.
FX markets opened on Monday (Jan 26th) in a similar fashion, with traders reacting to comments from Japanese PM Sanae Takaichi on Sunday, where she stated that the MoF would take all necessary measures to address speculative and highly abnormal movements. Taken together these events saw USDJPY fall over 500 points or around 3.7% from a high of 159.21 on Friday morning to a low of 153.30 yesterday.
It could be argued that Japanese and US authorities have stepped in ahead of the important psychological 160.00 level in USDJPY to voice their disapproval at the exchange rate, giving investors a chance to reduce their long exposure, while at the same time providing a warning that they may co-ordinate a future intervention that could result in unwelcome volatility and losses if their message is ignored.
While this seems to have been received loud and clear in the short term, whether that continues as traders react to the potential outcome from tomorrow’s Federal Reserve rate meeting and the future policy decisions of the Japanese PM moving toward the elections on February 8th remains to be seen. USDJPY prices have already rebounded slightly, trading back around 154.50 at the time of writing (0630 GMT).
Technical Update: Deeper Retracement Risk on Intervention Concerns?
Speculation regarding possible intervention triggered increased concerns around overstretched USDJPY levels and prompted position‑squaring into last weekend. Those fears have carried into the new trading week, with prices seeing a sharp continuation lower, and the pair falling 3.7% from Friday’s high to Monday’s low.
However, as the daily chart above shows, the latest price activity is currently testing what could be viewed as the first potential support at 154.12, which is the 38.2% retracement of the September to January advance. Closing breaks below 154.12 could raise questions over whether this can mark the start of a deeper downside phase or is just another brief pullback before buyers return.
In this situation, being able to identify potential key support and resistance levels to monitor could become especially important for traders in the days ahead.
Potential Support Levels:
A closing break below the 38.2% retracement at 154.12 could shift the bias toward risks of a deeper decline, opening potential for tests of lower support levels. If those supports fail to hold, the downside moves could extend further over upcoming sessions.
As the chart above shows, if support at 154.12 is broken to the downside this week on a closing basis, attention may shift to the lower Fibonacci retracements as the next potential supports. The 50% level at 152.48 is the next area that could steady the current decline, however a close below this level may signal further deterioration and even open the door for a deeper fall toward 150.85, which is the 61.8% retracement support.
Potential Resistance Levels:
There is no guarantee that the recent price weakness will extend, so monitoring the next resistance levels could also be key to judging whether a more sustained recovery may materialise. The 38.2% retracement of the latest decline sits at 155.64, and if prices rebound this week, this level may become a marker for assessing how far recovery themes could develop.
While not an outright positive signal, a closing break above 155.64, could open scope toward 156.37, the 50% retracement, and potentially even 157.08, which is the higher 61.8% level.
The material provided here has not been prepared accordance with legal requirements designed to promote the independence of investment research and as such is considered to be a marketing communication. Whilst it is not subject to any prohibition on dealing ahead of the dissemination of investment research, we will not seek to take any advantage before providing it to our clients.
Pepperstone doesn’t represent that the material provided here is accurate, current or complete, and therefore shouldn’t be relied upon as such. The information, whether from a third party or not, isn’t to be considered as a recommendation; or an offer to buy or sell; or the solicitation of an offer to buy or sell any security, financial product or instrument; or to participate in any particular trading strategy. It does not take into account readers’ financial situation or investment objectives. We advise any readers of this content to seek their own advice. Without the approval of Pepperstone, reproduction or redistribution of this information isn’t permitted.

EUR USD Bullish run needs to be activated. always wait for your area of interest to be mitigated before diving in.


USD/JPY: True Bullish Reversal?!The 📈USDJPY pair formed a well-defined inverted head and shoulders pattern following a test of a significant historical support level.
A decisive bullish breakout above its neckline, confirmed by a strong bullish candle, would provide a reliable indication.
I anticipate a correctional movement to at least 155.20.

FreseniusGood monthly setup for Fresenius. Broke up descending channel, then confirmed. Now we have beautiful monthly candle giving probabilities for an upside move (hopefully above 34.60). The 3 years distance from MA shows almost the same (broke up, retest, now moving).
Very clear Fibonacci resistances around 41-44. It seems to me a good defensive play for long term. It pays nice dividend as well.
Always do your own research!

NZD/CAD: Trend-Following SignalThe NZDCAD appears to be showing bullish tendencies following a retest of a significant daily horizontal support level.
It seems the current intraday correction is over.
Further confirmation is provided by a bullish breakout of the resistance line of a bullish flag pattern observed on the hourly timeframe.
The target is set at 0.8221.

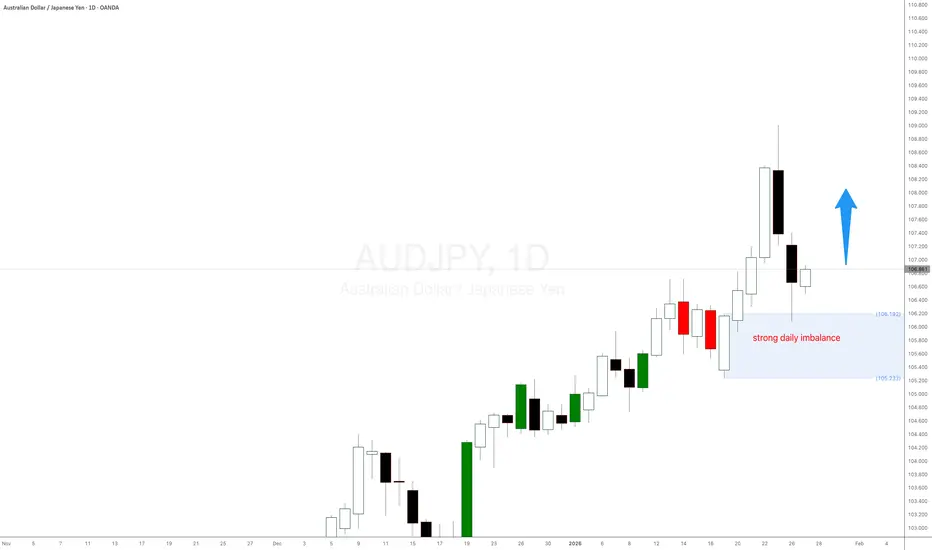
AUDJPY forex pair strong daily imbalanceAUDJPY forex pair strong daily imbalance took control and is trying to push the australiann dollar to higher grounds. The Japanese Yen is very weak accross the board. Let's see if this imbalance wants to play out.
USDHKD Forex long term demand level is playing outUSDHKD Forex long term demand level is playing out. This strong imbalance was mentioned several times in my previous update and it 's playing out well, as expected. There is still a lot of margin for profit. Long positions should be managed.

NZDJPY: Bullish Outlook Explained 🇳🇿🇯🇵
NZDJPY is going to rise more after a confirmed bullish change of character
on an hourly time frame.
I expect a bullish movement at least to 92.485 level.
❤️Please, support my work with like, thank you!❤️
I am part of Trade Nation's Influencer program and receive a monthly fee for using their TradingView charts in my analysis.

BITCOINI believe Bitcoin is brewing up a couple of big moves for this year. However, I also think that it's going to trick a lot of people before the true move takes place.
I analyze four "main charts" for directional bias, and I use the others as fillers. Currently, I'm getting half & half with my bias, where two is telling me bear and the other two is leaning towards bull. The two smallest TFs is bear at the moment, and I'm viewing that as a precursor for what's to come in the future.
In my opinion, Bitcoin's price must bleed before the next bull run takes place. Price action is near not only the daily low, but it's hovering over the current weekly & monthly low, too! I would like to see the bulls takeover on the daily and weekly TFs in order for price to rally to the highs, but only for it to run into huge bear barriers.
Bear Barriers:
1. Monthly IMB (untouched)
2. 3M wick (untouched)
3. Bear range ($130K - $160K)
4. S/R ($122,100K)
If the bears do come into the market around the $130K - $160K range, I'm anticipating a massive drop in price around $40K - $60K. Sounds crazy right?! I have my reasons why, but I'll keep it close to the chest until things starts to unfold with this crypto.
In conclusion, I'm currently stuck in the middle with my bias until the two smallest TFs flip back to bull, but price can throw a curve ball and demolish the monthly low to turn it bear... we shall see how this plays out, and I'll share my thoughts as it progress.

Gold long term targetsAs I personally think we will see gold hitting 5600$!
Based on what?
Well this is why I think what I think !
My first target hit long ago(as you can see in the image) and I sold all my Long term position already...Sadly.
I honestly thought price would have retraced a bit but instead it didn't even stop.
This strongly convince me , now that we have created a monthly FVG above 0.75 DRT level, that price will retrace in it and that will give me an advantage to open a light swing trade to last target 5600$.
Check it out and see if you like the idea.

Long trade
Trade Details
Entry: 25,651.00
Take Profit: 25,827.50 (0.68%)
Stop Loss: 25,623.50 (0.10%)
Risk–Reward: 6.42R
🟢 Directional Bias
Buy-side continuation:
The market shows acceptance back above intraday value following a sell-side liquidity purge, indicating bullish order-flow control.
🧠 Market Sentiment Overview
Early session weakness engineered sell-side liquidity
Sharp rejection from the lows confirms sell-side absorption
Subsequent impulsive moves higher signal institutional accumulation
This is a re-accumulation after a stop-run.
🧩 Structural Context
Sell-side liquidity swept below the Asian range
Immediate displacement higher created a bullish BOS
Price transitioned from discount → equilibrium → premium
Structure supports continuation higher, not mean reversion lower.
📊 Volume Profile & Value
Reclaim of intraday POC / value low
Acceptance above the value confirms a bullish auction
Volume shifts higher → value following price.
🟦 PD Arrays / Fair Value Gaps
Entry aligned with a bullish FVG inside discount
Clean mitigation followed by continuation
No inefficient gaps left below → downside fuel reduced.
⏱️ Session Behaviour
London AM delivered the liquidity sweep + reversal
Follow through into NY, the overlap is likely.
classic London manipulation → NY expansion profile.
🎯 Trade Logic
Sell-side liquidity cleared early
Market reclaimed value with displacement
Buyers defended pullbacks aggressively
Buyside liquidity resting above prior highs.
⚠️ Invalidation Criteria
Failure to hold above the reclaimed value
Bearish displacement back into discount
Until then, buy-side bias remains intact.
🧾 TradingView-Ready Summary
MNQH shows buy-side continuation following a sell-side liquidity sweep and strong bullish displacement. Acceptance above value and clean FVG mitigation support further upside expansion.
