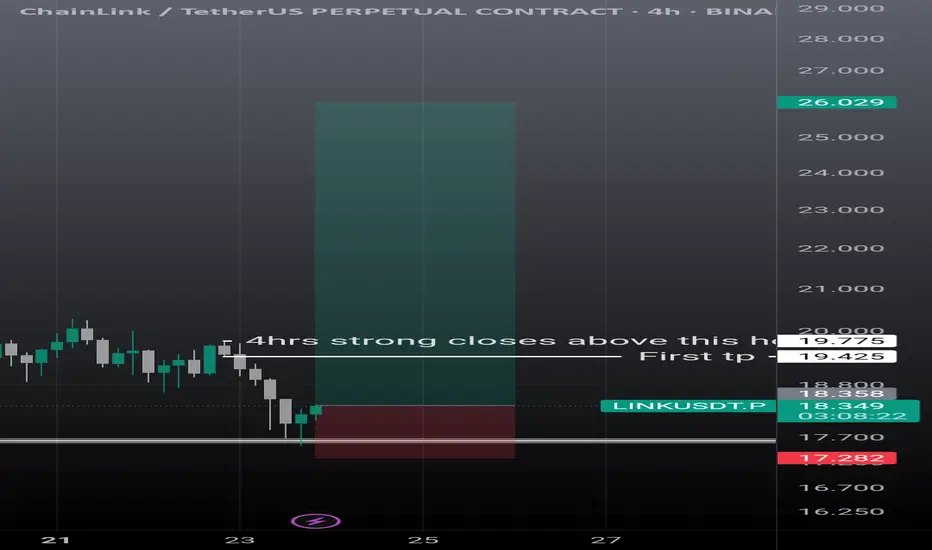
ChainLink LINK price analysis, $15 - sooon Two months ago, we posted a “signal” suggesting that CRYPTOCAP:LINK was likely forming a bottom.
Since then, the rally has basically never stopped. Sure, OKX:LINKUSDT hasn’t delivered any crazy multiples yet, but it looks like the $15 level may be getting close. And from our area of interest, that’s neither more nor less than a simple 2x. 🙂
We know many #Chainlink holders would like to see the price much higher. And that’s absolutely possible.
Our previous scenario for a move toward $22
Chainlinkusdt
CHAINLINK LINK - 1D - 1W TFAfter the end of the bear trend, price started forming a clean ascending channel.
The midline of the channel (dashed zone) marks a phase of uncertainty, often leading to shakeouts or temporary consolidations.
Area between the white dashed and green line can be viewed as a position-building zone, where smart money accumulates before a short-term or long-term upward move (ellipses).
Once the price breaks and confirms above this range, the probability of a move toward the upper boundary of the c
LINK – Back Inside the Bullish FlagOn Friday night, Chainlink lost its confluence support from the 18.50 zone and dropped sharply to just under $10.
However, looking at the chart, we can clearly see the importance of this area, marked by both the 2022–2023 accumulation resistance and the 2024 lows.
From there, the coin rebounded fast, managing to reclaim the 18.50 support and re-enter the bullish flag that started forming at the end of August.
This recovery shows strong buying interest — but no clear buy signal has yet appeared.
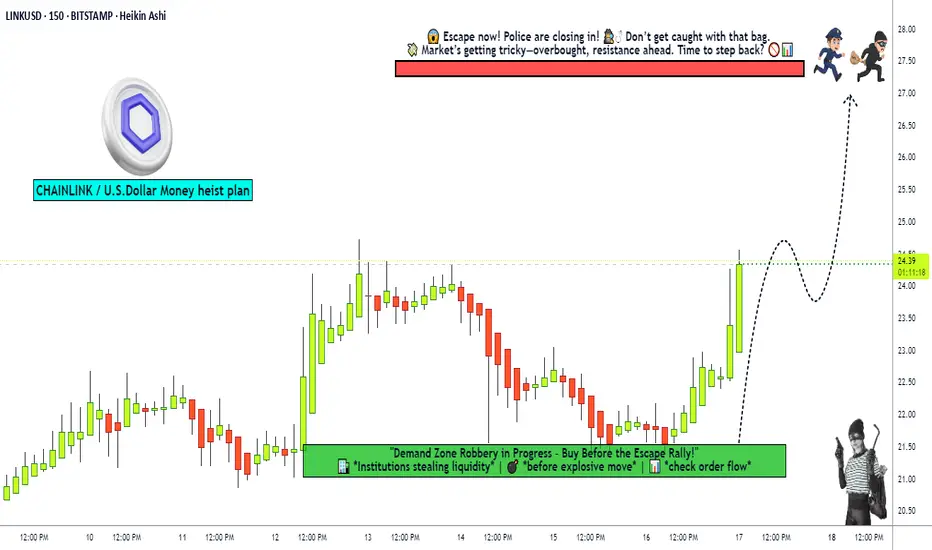
"Chainlink robbery in progress! Are you in or missing out?"🚨 LINK/USD "CHAINLINK vs U.S DOLLAR" HEIST PLAN 🚨
🔰 PLAN: BULLISH HEIST (STEAL & ESCAPE BEFORE COPS ARRIVE!)
💎 ENTRY: ANY PRICE (BUT THIEFS USE LAYERS!)
🤑 THIEF ENTRY STRAT (LAYERED LIMIT ORDERS):
"The vault is open! SWIPE THE LOOT IN LAYERS!"
📍 BUY LIMIT LAYERS:
👉 24.40 (First dip grab!)
👉 24.00 (Double dip!)
👉 23.50 (Triple steal!)
👉 23.00 (Last call before cops!)
(Add more layers if you’re a PRO THIEF!)
🛑 STOP LOSS (THIEF OG STYLE):
"If the cops breach @ 22.00, ABORT MISSION!"
(Adjust SL ba
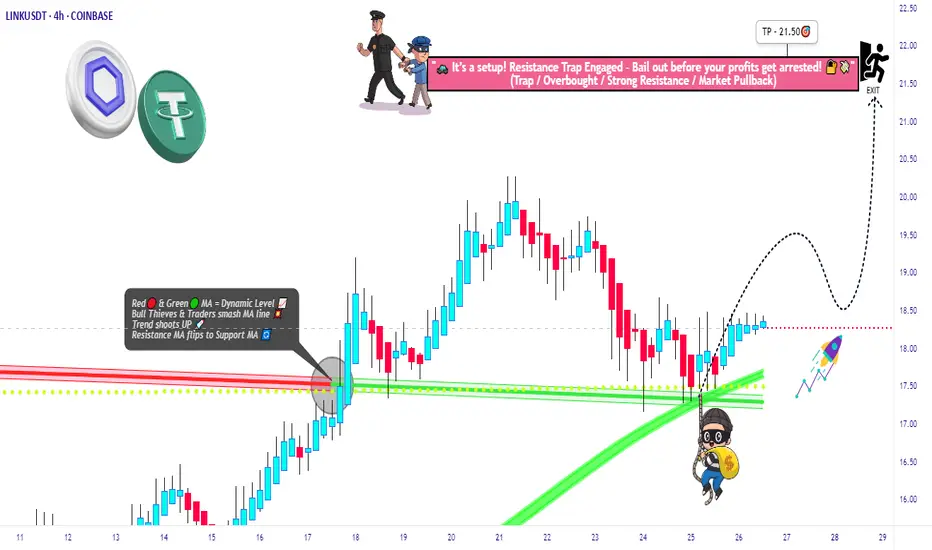
Smart Robbery Plan: LINK/USDT Long Setup | Swing/Day Trade Idea🚨CHAINLINK HEIST PLAN 🚨 | LINK/USDT Market Robbery (Thief Trader Style) 💰🔐
🌍 Hola! Bonjour! Hallo! Marhaba! What’s up, Money Makers & Market Robbers?! 🕶️💵
Get ready to raid the LINK/USDT vault with Thief Trader’s high-precision strategy based on 🔥 Technical & Fundamental fusion 🔥.
This is not your regular setup. This is a robbery roadmap. Designed for swing & day traders, and spiced with smart DCA entries, risk control, and a bold vision. Let's get into the game plan before the market alarms g
Chainlink (LINK) Trapped Between $18–$20: Explosion Soon?Chainlink (LINK) has been in a strong uptrend for most of July, rallying from under $13 to a recent high of $20.28. This level acted as a clear resistance where a "Sell" signal has been triggered, suggesting a temporary exhaustion of bullish momentum. After this peak, price has pulled back slightly and is now trading near $19.08, hovering between key levels — with $20.28 acting as resistance and $17.98 as nearby support. This positioning confirms that LINK is currently rangebound and consolidati
Link Update (4H) Correction Has StartedIn my previous analysis, I presented two different perspectives on LINK.
On lower timeframes, LINK completed its 5-wave impulsive structure, but in doing so, it invalidated the macro reversed Head and Shoulders pattern—rendering it no longer valid.
Currently, LINK has entered a classic A-B-C corrective phase, signaling temporary market weakness. If the price drops below the key S&R zone (highlighted in pink), I expect a swift move down towards the $13.45 level.
This target coincides with a
ChainLink (LINK) Bulls Eye $18 as Supertrend Flips Green📈 Market Structure & Trend Overview
• Price is holding a clear ascending trendline, acting as dynamic support.
• The recent bounce from Support 1 at $14.93 indicates that bulls are defending this level aggressively.
• Price is now approaching the mid-zone between support and resistance with bullish momentum resuming.
🧠 Supertrend Indicator Analysis
• The Supertrend is flipping bullish, or recently has, placing the green band below the current price, which confirms the initiation of a buy sig
Chainlink Analysis for Intraday TradingWait for the entries to be filled from both side, I will prefer short entry here, Reason btc looks too weak now, USDT.D has reached the strong bullish zone and can hit 4.80-4.89% zone for correction. While I will short BTC from 105-106K SL if 4 candle closes above 107.8K, at the same time I will open short positions on ETH, and Link SL when BTC hits the SL.
Chainlink - 1W
Overview
Chainlink (LINK) is experiencing an interesting price movement on the weekly timeframe, forming a Symmetric Triangle pattern. This pattern is a strong technical formation that often precedes significant price movements upon breaking one of its sides. This analysis focuses on the pattern, key resistance and support levels, and price expectations if the resistance is broken.
Symmetric Triangle Pattern
Pattern Formation: The Symmetric Triangle forms as price volatility gradually
Chainlink Set for 100% Surge Amidst Strategic Partnership The Price of Chainlink ( CRYPTOCAP:LINK ) is set for a comeback with a potential 100% surge in sight- amidst striking a potential partnership with the Abu Dhabi Global Market (ADGM).
The asset is currently depicting multiple signs of a bullish renaissance with the daily price chart hinting at a bullish symmetrical triangle. Similarly, the daily Relative Strength Index (RSI) is at 52 hinting at a potential bullish surge incoming coupled with the falling wedge depicted in the chart.
Chainlink
My current LINK charts with estimated April 'flash crash' levelsHere is my current LINK chart, which I recently went over in detail. It assumes that the bottom isn't in on the 4th wave. If the bottom is in and price is moving into the 5th wave, you can simply adjust the 4th wave bottom to the previous low accordingly.
It also includes the likely level that would be hit during the April "flash crash" around the pattern’s 3rd support level line and FVG (fair value gap), as well as the likely areas above that it will need to break through in order to reach new
The Bull Market Is Just Starting For Chainlink LINKHello, Skyrexians!
During this bull run the best performance has been showed by the old high cap coins, BINANCE:LINKUSDT is not an exception. It had a textbook accumulation and then growth for 5x+ from the bottom. Is it enough or the main gains ahead.
Let's take a look at the weekly time frame. The first wave from the bull run start we can count as a wave 1. Then retracement has happened in the wave 2 and currently asset is forming wave 3. Looks like now price is finishing the wave 2 inside
LINK/USDT 1H: Accumulation in Discount Zone – Targeting $22 NextLINK/USDT 1H:Analysis
🚀 Follow me on TradingView if you respect our charts! 📈 Daily updates!
Confidence Level: 8/10
Current Market Structure:
Price consolidating at $18.89, positioned between the Fair Value Gap (FVG) at $20.00 and Previous Day Low (PDL) at $18.40.
RSI at 45, showing hidden bullish divergence, indicating potential upside.
Market Makers accumulating in the discount zone, preparing for a liquidity move higher.
Trade Setup:
Position: Long
Entry Zone: $18.80 - $18.90 (curre
LINK/USDT 1H: Accumulation or More Downside? Watch $19.50!LINK/USDT 1H: Analysis
🚀 Follow me on TradingView if you respect our charts! 📈 Daily updates!
Current Market Structure:
Bearish trend intact, with price forming lower lows and lower highs, currently at $19.06.
RSI at 39.07 showing potential hidden bullish divergence, but still below neutral (50).
Key Levels:
Resistance: $20.00 (psychological barrier).
Support: $18.50 (previous reaction low).
Premium Zone: $26.00-$27.00.
Discount Zone: $15.00-$16.00.
Smart Money Analysis:
LINK/USDT 1H: Oversold & Accumulating – Ready for a Reversal?LINK/USDT 1H Chart Analysis
🚀 Follow me on TradingView if you respect our charts! 📈
Current Market Structure:
Bearish momentum continues after a recent breakdown.
RSI at 28.70, showing oversold conditions.
Hidden Bullish Divergence forming between RSI and price action.
Smart Money Activity:
Market Makers engineered a liquidity sweep below $20.50.
Accumulation likely occurring at the discount zone.
Premium zone identified between $25.50-$26.00.
Key Levels:
Entry Zone:
Chainlink Could Target $30 Once It Breaks Descending Triangle
Chainlink (LINK), the leading decentralized oracle network, has been consolidating within a descending triangle pattern on its price chart. This technical formation often signals a period of indecision among market participants, but it also carries the potential for a significant breakout. If LINK successfully breaks above the descending trendline, it could ignite a powerful rally, potentially propelling the price towards the $30 mark.
Understanding the Descending Triangle
A descending triang
Chainlink (LINK) Cup & Handle BULLISH!Chainlink (LINK) has formed a Cup & Handle pattern with a bullish scenario. The breakout has formed a bullish trend for the bulls creating pressure to push the price to the upside. In addition, the bears have pulled the price back down towards the neckline which acts as a previous Upper Resistance line.
Bid Zone= $19.27 - $22.87
Expect price to continue to the upside with followed buying momentum from the bulls. After this pullback, Chainlink will now retest previous "All-Time High" dated ba
LINK | ALTCOINS | Chainlink pushes towards 40$Link has seen some great increases after another bump on BTC.
It's likely that this will lead to another mini-cycle, and push the price of Chainlink even higher towards 40$ which is the next major resistance mark.
I'm especially optimistic for Link and other alts once Ethereum has made a new ATH. More on that thought here:
_____________________
BINANCE:LINKUSDT
Chainlink's Bullish Surge: A Potential Rally on the HorizonChainlink (LINK), the leading decentralized oracle network, has been making significant strides in the cryptocurrency market, captivating the attention of investors and analysts alike. The token's price has surged to a multi-year high, surpassing the $30 mark, as hopes for a substantial 80+% rally continue to gain momentum.
The Driving Forces Behind Chainlink's Rally
Several key factors have contributed to Chainlink's bullish momentum:
1. Increased Institutional Adoption:
o A growing number o
Chainlink Poised for a 20% Upswing This Weekend?
Chainlink (LINK), the leading decentralized oracle network, has been on a remarkable run in recent weeks. The cryptocurrency has outperformed the broader market, surging by over 22% in the past month. This impressive performance has sparked renewed interest in LINK, with many investors wondering if the token can reach new heights in the coming months.
What’s Behind Chainlink’s Strong Performance?
Several factors have contributed to Chainlink’s recent surge. Firstly, the increasing adoption of
LINK Leap to 2021 Heights: Trump's World Liberty Fuels the Rally
Chainlink (LINK), the decentralized oracle network, has experienced a significant price surge, reaching levels not seen since 2021. This bullish momentum has been fueled by a combination of factors, including increased institutional adoption and a recent purchase by a notable entity.
A Bullish Surge
LINK's price has rallied to the $30 mark, a level that has not been breached in several years. This substantial price increase can be attributed to several key factors:
1. Institutional Adoption: