(FINALLY) A Live BTCUSD chart minus the auxillary indicators!I finally spat the dummy and just created a new chart layout without all the additional indicators displayed below the candlesticks.
Now we have some clarity at last!
If anyone has any idea how to publish an idea with displaying all indicators, please let me know!
As we can see from channels, yesterday we broke below the upwards channel drawn between Wave 4 and Wave 5 on a 'cycle' EW timeframe.
This wasn't maintained for long before a bounce back. I spent ~2/3 of my fiat account on various crypto's at this point - prepared for the price to not reach this low again, but also prepared to have some remaining funds for a further potential drop.
We are nearing the end of an ABC correction no doubts about it. What remains to be seen is if we are now beginning Wave 5 in a EW supercycle, or if this rally is temporary - a 'primary' Wave B within a 'cycle' Wave C, with a final (primary and cycle) Wave C drop yet to come, which would complete the correction before the supercycle Wave 5 begins.
In any case, my projection for bitcoin is $33,000 USD by March 2018. However, at this stage, this figure is a guestimate at best. I am constantly modifying my analyzes to account for the most recently available data.
The red box drawn still accounts for all my predictions and speculations on BTCUSD since 29th December 2017. I still believe we will see price move to within this box, but most likely not lower than $11,000 USD - price is unlikely to move within the lower half of the red box.
That being said, a foreseen future event often becomes a self-fulfilling prophecy - making it occur earlier than anticipated. We may well see this at play in the near future.
Channels

BTC Most obvious Uptrend inc. ! I guess the Chart is self-explaining. There is a clear pattern in the channel. uptrend already going on after last correction.

AUDUSD TO CONTINUE LONG
Following to target reached in the attached analysis, AUDUSD should complete ascending channel before any major reversal.


Verge (XVG)There is a bullish trend in Verge now, which was slowed down by the resistance. The most probable scenario is flip on the current support level and then the following uptrend. Conservative traders should enter beyond the specified entry-level, exit at the specified profit target and use a small stop-loss for covering the position.

Litecoin (LTC)LTC is about to break through the triangle in uptrend direction. I recommend waiting for the confirmation by crossing the selected entry-level line. The profit target should be placed a few ticks under the all-time high.

Wings DAO (WINGS)WINGS is about to break through the ascending triangle in uptrend direction. The opportunity for taking a long position should be confirmed by crossing the resistance level of the recommended entry line. There are two possible levels of an exit - conservative one and aggressive one.

Identifying trading channels IOTA/ETHIOTA enjoys strong support and gained some vs ETH.
As a result IOTA found support on the previous descending resistance line of the symmetrical pattern.
If no major news breaks
then I expect a green or orange channel depending on ETH keeping its current price levels or ETH going up in dollar
Just trying to spot trading channels. Your ideas are welcome as I'm new to this and trying to learn.
ETH @ 730.12 dollars

NEM (XEM)NEM is moving in uptrend channel, currently around resistance level. After breaking through there is a good chance for entering the profitable long position.


Ripple (XRP)Ripple is moving in uptrend channel since breaking the $1 USD price level. Fundaments and current trend indicate the following uptrend. The price level of $1.5 USD seems to be here soon.

Ripple (XRP)This is a larger view of previous analysis. We can expect $2 USD for Ripple during January 2018 if the uptrend channel is not gonna be broken by some fundamental reason.

GBPUSD - Looking for a bounce at bottom of channelIt's a brand new week!
Looking for opportunities to long GBPUSD early week around 1.3350/1.3360.
Look for a bounce off the lows of this channel and target 1.36.
Volume should dry up as it approaches the low of the channel.
Will update you guys when I get in.

Ascending pennant breakout New Channel here.Change in sentiment confirmed the low side pennant breakout shows new trendline confirmen short here Now

CHANNEL SURFINGCONTINUE WATCHING THIS CHANNEL.
Triple top then off to the bottom triple bottom then back to the top follow this play until you see signals to the contrary. Sell at the Top Buy at the bottom of the channel with a stop at bottom of the chanel trailing the channel s you move up. Also a ascending W

CADCHF - Channel PlayI see the volume drying up after price tried to break above this H4 channel.
This is a pure channel play and I expect to see lower prices for CADCHF this week.
EP: 0.7830-0.7840
SL: 0.7910
TP: 0.7700

EURUSD - Channel Play (Classic No Demand Setup)EURUSD is a pretty straight forward channel play.
I will only be interested to trade when it reaches channel extremes or when harmonic pattern completes.
Currently, there are not patterns.
If you look back just a few days ago, we have a classic no supply at top of channel.
What is no demand?
Price did a breakout with extremely low volume, this indicated not many buyers are interested in this move up. (no demand = no buyers )
After struggling for 8 hours, price dropped on a big red bar with high volume. This indicates sellers have come in.
In instances like this, we should wait for any pullback to top of channel before initiating any shorts.
The direction should be bearish and I will only look for reasons to join the sellers.
I will not chase the lows and get myself stucked in a bad situation.
Will keep you guys posted next week.

TKS unusual attempt to tradeThis coin chart is very different from the rest of altcoins. I marked channel and it is very obvious that the coin is trading in between theses two levels(yellowish rectangle).
It is quite possible that the coin will reach highest high again in some time unless the channel will be broken and down trend will occur. I marked double bottom as well.
I think SL around 2500 is a good idea as the pair might go lower and it is hard to say if it will ever go up

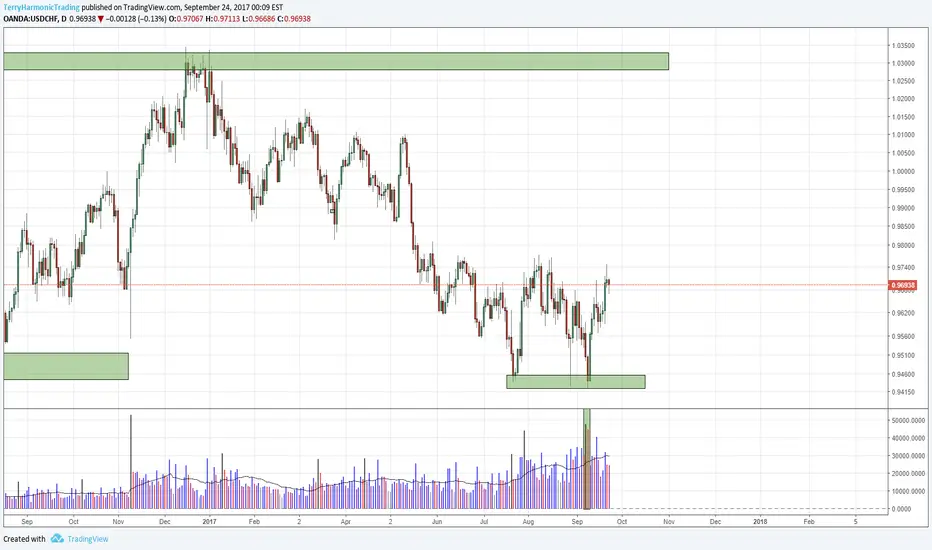
USDCHF - Range play towards 1.03?Read about US stopping QE over the weekends. I am not a big fan of news but this caught my attention.
More QE = Weak dollar
No QE = Strong dollar?
Buyers are buying in high volumes of USDCHF around 0.9460.
Even if we do not see a full bloom bull in the USD, I will not be surprised to see USD strengthen over the next few weeks.
1.03 is a nice daily range profit target.
BTC bouncing off of the long-term trend and battling the channelBTC looks weak, but I think it will bounce on this channel and continue upwards.
Lots of potential for shorts to get liquidated since everyone thinks it's going to fall.

LTCUSD to new ATH? Triple digits by end of 2017?LTC fell out of the blue channel, then out of the red ascending wedge, but is still within the red channel.
Using ALL TIME high and low for the fib retracement. LTC just made a strong move away off of trend line b and breached above trend line a, which is now support as we consolidate between trend line a and the 100% fib retracement (ie. the all time high). Support is then found at the 76% fib and support line b.
It will take a very strong move to get back up into the ascending wedge before the apex
Bear div on the RSI interrupted by this recent move toward the ATH and now its back above 70. Cloud spans, cloud relative to price, conversion relative to base and lagging spans are bullish
Could see short term pullback near the ATH, but for a longer term trade I think LTC is heading up
