Gold Breaks Structure at a Critical Channel LevelGold is showing clear signs of trend exhaustion after a strong impulsive rally that has been respecting an ascending price channel for several sessions. Price has now broken below the lower boundary of this channel, a technical signal that bullish momentum is weakening and that the market is transitioning from markup to distribution/correction.
From a technical standpoint, the repeated failures near the upper channel resistance around 4,550–4,570 formed a series of lower highs, indicating seller absorption at premium prices. The decisive move below the channel support near 4,480 confirms a loss of bullish structure. As long as price remains below this broken support, the channel acts as new resistance, and short-term rallies are likely to be corrective rather than trend-continuing.
If downside momentum sustains, the next key support zone lies around 4,420–4,400 , followed by a deeper liquidity area near 4,350–4,320, where previous demand and structural lows are concentrated. A brief pullback toward 4,480–4,500 would be technically normal, but failure to reclaim the channel would reinforce a bearish continuation scenario.
On the macro side, gold is reacting to a combination of year-end positioning, declining holiday liquidity, and shifting interest rate expectations. While expectations of Fed easing in 2026 remain supportive for gold in the medium term, the short-term environment is dominated by profit-taking and risk rebalancing after an extended rally. A firmer U.S. dollar and stabilization in Treasury yields have also reduced the immediate safe-haven bid.
Conclusion: Gold has lost its bullish channel structure, shifting the bias to short-term bearish/corrective. As long as price stays below 4,480, downside toward 4,420 → 4,350 remains the higher-probability path. A recovery back inside the channel would be required to invalidate this bearish setup. Until then, traders should treat rebounds as selling opportunities, not trend continuation.
Chartanalysis

Gold Isn’t Correcting — It’s Setting a TrapXAUUSD – Market Structure Update & Intraday Strategy (Dec 29)
Gold continues to move exactly within last week’s planned scenario, confirming that the broader market structure remains intact. Price is still respecting the established ascending channel, which is critical: as long as structure holds, the advantage belongs to traders who identified the context early rather than reacting emotionally to short-term volatility. This is not randomness it is disciplined price behavior following liquidity logic.
From a medium-term perspective, XAUUSD remains in a clear uptrend. Recent pullbacks are technical corrections, not signs of distribution. These retracements are designed to absorb liquidity and eliminate late FOMO entries before continuation. Price is currently hovering around the equilibrium /liquidity zone, a common area where the market generates noise, fake breaks, and emotional traps. Importantly, dynamic support (EMA + structural support) continues to hold firmly, signaling no confirmed trend reversal at this stage.
On the intraday timeframe, the primary bias remains re-accumulation within trend. As long as price holds above the key support zone, rebounds should be treated as continuation setups rather than reversal signals. Even a deeper downside sweep should be viewed as liquidity collection for larger capital participation, not structural weakness. According to the weekly directional plan, the primary objective remains higher within the channel, with the next upside expansion targeting the upper boundary.
Trader’s Mindset & Execution
Price respecting the old structure is not coincidence, it validates correct structural reading and money flow alignment. Professional trading is not about chasing candles; it is about letting price execute within a predefined scenario. While the plan remains valid, the edge lies not in overthinking, but in patience and disciplined execution. The market today is still playing by the same rules as last week.
📌 TODAY’S LIMITED STRATEGY – DEC 29
Intraday Focus: Re-accumulation & liquidity-based entries
SETUP 1 – Timing Sell (Short-term counter move)
Sell Zone: 4576 – 4579
Take Profit: 4573 – 4568
Stop Loss: 4583
SETUP 2 – Timing Buy (Primary trend continuation)
Buy Zone: 4430 – 4433
Take Profit: 4436 – 4441
Stop Loss: 4426
⚠️ Strict capital management is mandatory. These setups are precision-based, not emotional trades.

Technical Analysis for BTC/USD (1-hour timeframe) I 12/30Trend and Price Structure
Short-term Trend: The price is in a downswing after peaking around the 90,000 area.
Structure: The price has recently broken above the Down Trendline. However, after the breakout, the price has not surged strongly and is instead moving sideways near the short-term bottom, indicating indecision between buyers and sellers.
Key Volume Profile Zones The chart clearly displays resistance and support levels based on liquidity:
Demand zone: Located far above around the 90,193 level. This was the starting point of the downward move and now serves as a distant target if a strong recovery occurs.
VAH (Value Area High) - 88,289: This is the first major resistance level. For a bullish reversal to be confirmed, the price must break and close above this zone.
POC (Point of Control) - 87,236: The current price (87,160) is sitting just below the POC. This area has the highest concentration of trading volume and acts as a price magnet. The fact that the price is below the POC suggests sellers still have a slight advantage.
VAL (Value Area Low) - 86,869: This is the immediate support level. The price has shown rejection wicks here, indicating buying interest at this lower range.
Future Scenarios
Recovery Scenario: If the price maintains the VAL (86,869) and climbs above the POC (87,236), the short-term target will be the VAH area around 88,289.
Continuation Scenario: If a 1-hour candle closes below the 86,869 level, the downward momentum will likely expand to seek lower support levels further down the chart.
Summary BTC is currently consolidating within a narrow range between 86,869 and 87,236. You should wait for a clear candle close outside of this range to determine the next direction.

Technical Analysis for GBP/USD (30-minute timeframe) I 12/30Trend and Price Structure
Main Trend: The price is in a recovery phase with a bullish bias after forming a bottom around the 1.3470 area.
Structure: The price is moving along an ascending trendline. Every time the price touches this line, buying demand reappears to push the price up, indicating that buyers are striving to maintain the upward momentum.
Volume Profile Analysis The liquidity zones on the chart are acting as critical checkpoints:
VAH (Value Area High) - 1.35095 area: This is the upper resistance zone. The price has attempted to break above this area but is meeting selling pressure and showing signs of a slight rejection.
POC (Point of Control) - around 1.35030: The current price is fluctuating right at the POC. This is the area with the highest traded volume, suggesting the market is in a temporary state of equilibrium and awaiting a clear breakout.
VAL (Value Area Low) - 1.34900 area: This is the strong support zone below. If the price undergoes a deep correction, this is where buyers are expected to re-enter the market.
Future Scenarios Based on the visual data, keep an eye on these levels:
Bullish Scenario (Continuation): If the price stays above the trendline and breaks through the VAH (1.35095), the next target will be the previous highs around 1.35250. Staying above the POC is a positive signal for buyers.
Bearish Scenario (Correction): If a 30-minute candle closes below the ascending trendline, the short-term uptrend will be threatened. In this case, the price is likely to head toward the VAL (1.34900) or deeper toward the Daily Open near 1.34845.
Summary and Notes:
Current Status: The price is in a tug-of-war phase right at the POC.
Reference Strategy: Watch the reaction at the trendline. If a long-wick candle forms here, a Buy order toward the VAH could be considered. A high-volume breakout above the VAH would confirm the continuation of the uptrend. Conversely, if the trendline is broken, it is better to stay sidelined or wait for opportunities at the VAL.

XAU/USD chart analysis in Asia Session I 30/121. Overall Trend
Short-term: The price is in a strong bearish structure since the 29th. The sharp drop from the $4,540 area to the $4,320 area indicates that sellers have been in complete control over the past few sessions.
Current State: The price is showing signs of a technical recovery after hitting a temporary floor around the $4,320 mark.
2. Key Volume Profile Zones
Your chart displays Value Areas very clearly, which are "keys" to identifying upcoming price behavior:
VAH (Value Area High) - 4,544.309: This is a very strong resistance zone. The price peaked here before the collapse.
POC (Point of Control) - 4,514.962: The level with the highest traded volume. If the price returns here, it will act as a major pivot point.
VAL (Value Area Low) - 4,357.158: The price is currently trading exactly at this level. It serves as the immediate resistance. Whether the price closes above or below this level will determine the trend for the next few hours.
3. Technical Patterns & Price Structure
Wedge/Triangle Pattern: You have two converging trendlines. The price has just broken above the descending trendline (the diagonal line from the peak), suggesting that selling pressure is weakening and buyers are attempting to push the price higher.
Immediate Support: The 4,341.720 level (Daily Open) is acting as the nearest support base for this recovery move.
4. Future Scenarios
Based on the current price ($4,357.745), there are two main scenarios to watch:
Bullish Scenario (Recovery): If the price holds firmly above the VAL (4,357), the next target will be filling the liquidity gap above, heading toward the POC (4,514). However, this path will face multiple resistance hurdles.
Bearish Scenario (Continuation): If the price fails to break through the VAL zone and is pushed back below the lower rising trendline, Gold may retest the previous low at 4,320 or even lower.
Suggestion: The price is at a very sensitive zone (VAL). You should monitor the next 30-minute candles:
If a candle closes decisively above 4,358, a short-term Buy setup could be considered.
If a rejection candle (like a Pin bar) or a Bearish Engulfing pattern appears at this zone, it signals that sellers are returning.

Gold Preparing for Impulsive Move After Range HoldMarket Structure: Strong higher highs & higher lows → bullish trend intact.
Price Action: Gold is compressing just below key resistance, indicating breakout pressure.
Liquidity: Equal highs liquidity resting above → likely stop-hunt → continuation.
Channel: Price respecting the ascending channel, no bearish deviation yet.
Ichimoku: Price holding above the cloud → bullish momentum supported.
Bias: 📈 Bullish Continuation
Trade Idea:
Buy zone: Break & retest of resistance or shallow pullback inside channel
Invalidation: Clean close below channel support / cloud
Targets:
TP1: 4,557
TP2: 4,587

Caterpillar: Rollercoaster RideCAT has been notably volatile recently. Following a sell-off of more than 11%, a countermove took place, but currently, the stock is consolidating within a tight sideways range. In our primary scenario, we expect renewed upward impulses that should carry price into our red Short Target Zone between $687.01 and $727.83, where we anticipate the high of the overarching blue wave (I). Once this zone is reached, a more pronounced corrective movement is likely to begin. Additionally, we've illustrated an alternative scenario: If the support at $537.08 is broken, the magenta wave alt.(4) could form a lower low (probability: 35%).

GBP/USD OVERVIEW I 12/291. Market Structure & Trend
Overall Trend: The price is currently in a sideways (consolidation) phase after a correction from the peak (Supply zone).
Price Pattern: There are two converging trendlines forming a Triangle/Wedge pattern. The price is compressing tightly towards the apex, suggesting an imminent and strong breakout.
2. Key Price Levels
Based on the Volume Profile on the right side of the screen:
Supply Zone (Strong Resistance): Located around 1.3525 – 1.3535. This is where sellers previously took full control.
VAH (Value Area High): 1.3511. This is the upper boundary of the value area; a break above this would reinforce bullish momentum.
POC (Point of Control): 1.3507. This is the price level with the highest traded volume. Since the price is currently trading below this level, there is a slight bearish bias in the short term.
VAL (Value Area Low): 1.3494. This acts as immediate support. The price has reacted and left "wicks" here multiple times.
Bottom Support: The 1.3484 area (Daily Open). If this level fails, the downtrend will likely extend.
3. Current Price Action
Candlestick: The current candle is a small bearish (red) candle, showing indecision right at the lower support of the triangle.
Volume: Trading volume is at an average level, without a significant spike to confirm a clear directional move yet.
4. Trading Scenarios (Strategy)
Aligning with your "Remember the goal" principle (staying disciplined), here are the two likely scenarios:
Scenario 1 (Bullish Bias): If the price holds the VAL (1.3494) and breaks out above the upper descending trendline. Take-profit (TP) targets would be the POC (1.3507) and potentially the Supply zone (1.3530).
Scenario 2 (Bearish Bias): If the price closes decisively below 1.3484 (Daily Open) on the 30-minute timeframe. This would signal that buyers have given up, and the price could drop toward 1.3460.
Pro Tip: In a tightening triangle like this, the safest approach is to wait for a breakout accompanied by high volume before entering a trade. Entering now might expose you to "stop hunting" (volatility that hits stop losses on both sides).

Current Action and Scenarios and Overview EUR/USD I 12/29Current Action and Scenarios
Price Action: The price is attempting a minor recovery but is currently hitting the intersection of the descending trendline and the VAL zone.
Bearish Scenario: If the price fails to close above the trendline and 1.1766, it will likely continue dropping to seek lower liquidity.
Recovery Scenario: The bearish structure is only invalidated if the price decisively breaks the trendline and reclaims the POC (1.1775).
Summary: The technical bias is sell-on-strength. Look for short opportunities near the trendline or POC as long as the price remains capped by these resistances.

Quick Analysis XAUUSD during Asian Session I 29/12During the Asian session, gold made a strong pullback from the new ATH at 4548 down to 4473.
Key observation:
👉 Price touched the H1 ascending trendline perfectly
👉 Then rebounded strongly and continued the bullish structure
This confirms:
✅ This is NOT a trend reversal
✅ It’s a healthy technical pullback to fuel the next bullish leg
📊 Technical Perspective
• H1 & H4 structure: Higher High – Higher Low remains intact
• Strong BUY reactions on every deep pullback
• Main bias: UPTREND – BUY is the priority

Gold Holds Firm as Markets Reassess MomentumOANDA:XAUUSD is trading around 4,500 USD per ounce, easing slightly from recent highs after an extended rally. The current price action reflects a short-term technical consolidation, as traders lock in profits following the establishment of new record levels.
The recent surge in gold has been driven by a combination of key macroeconomic factors. Geopolitical tensions remain elevated, particularly in the Middle East, while developments surrounding energy sanctions and trade flows in the Americas have increased risk aversion. These conditions continue to channel capital into gold as a preferred safe-haven asset.
At the same time, expectations of looser monetary policy remain a critical pillar of support. Recent U.S. economic data point to slowing growth, moderating inflation, and a softer labor market, reinforcing the view that the Federal Reserve could begin an interest-rate cutting cycle next year. This environment reduces the opportunity cost of holding gold.
From a technical standpoint, gold has broken above multiple consolidation zones and is now holding above a strong high-price base, suggesting that selling pressure remains limited. As long as key support levels are respected, the current pullback is viewed as constructive rather than trend-changing.
In the near term, gold may continue to move sideways while the market awaits fresh catalysts. However, with persistent geopolitical risks and expectations of lower interest rates, the medium-term outlook remains constructive, leaving the door open for another upside extension once buying momentum returns.

XAU/USD M30 QUICK ANALYSIS I 12/291. Market Structure & Trend
High Volatility: Gold is experiencing significant price swings with a wide range. After a deep "wick" rejection from the $4,475 area, the price rebounded but is currently facing heavy selling pressure.
Wedge/Triangle Pattern: You have drawn two converging trendlines forming a tightening "knot". The price is currently at this convergence point, suggesting a breakout is imminent.
2. Volume Profile & Supply/Demand Zones
This chart clearly illustrates the conflict between buyers and sellers:
Supply Zone: Located at the top around $4,545 - $4,550. This is where sellers are aggressively guarding the price.
VAH (Value Area High): Near $4,518. The price attempted to break above this but left a long upper wick, indicating dominant selling pressure as soon as the price rose.
POC (Point of Control): Around $4,514. The price is currently oscillating right at this line. This is the most contested "battleground"; whichever side wins here will likely dictate the next direction.
VAL (Value Area Low): Around $4,498, representing a critical short-term support level.
Demand Zone: Located at the bottom near $4,475 - $4,480. This acts as a strong "floor" where the price bounced aggressively previously.
3. Current Price Action Observations
Selling Pressure Dominance: The most recent red candle is engulfing the previous green candle right at the POC zone. This indicates that the recovery momentum is being blocked.
Current Price: Trading at $4,513.125, slightly below the POC, suggesting a minor short-term bearish bias to retest lower supports.
4. Trading Scenarios
Bearish Scenario (Higher probability currently): If the price breaks the ascending trendline (upward line) and falls below $4,500 (VAL), Gold is highly likely to return to test the Demand Zone at $4,475.
Bullish Scenario: Gold needs a decisive candle close above VAH ($4,518) and a breakout above the descending trendline (downward line). In this case, the target would be the Supply Zone at $4,545.
Summary: For Gold, volatility at the POC is often "noisy." It is advisable to wait for the price to exit this triangle convergence before entering a trade to avoid being caught in "stop-loss hunts" on both sides.

GPB/USD TODAY QUICK ANALYSIS I 12/291. Price Action Context
Main Trend: The pair is in a short-term Bullish trend, supported by a clearly defined upward-sloping trendline.
Current Position: The price is trading at 1.34997, hovering just below the 1.3500 psychological level.
Status: Price action shows signs of stalling and moving sideways (consolidation) after the previous rally, forming a tight range at the local peak.
2. Volume Profile Analysis
Your chart highlights critical high-volume zones:
VAH Zone (Value Area High): Around 1.35100. This serves as the overhead resistance. The price recently touched this area and was slightly rejected, indicating profit-taking.
POC Zone (Point of Control): Around 1.35070. This is the level with the highest concentration of trading volume. Currently, the price is sitting just below the POC, making it an immediate resistance.
VAL Zone (Value Area Low): Around 1.35030. Observation shows the price has slipped below the light blue VAL band and is currently testing the trendline.
3. Critical Observations
Trendline Stability: The price is hugging the bullish trendline very closely. A 30-minute candle close below this line would signal a weakening of the upward momentum.
Buying Exhaustion: The most recent candles show small bodies and long upper wicks, suggesting that buyers are losing steam as they approach the 1.35100 mark.
Lower Support: If the trendline breaks, the price is likely to drop toward the orange support zone below, near 1.34860.
4. Potential Scenarios
Bullish Scenario: The price needs to reclaim the POC (1.35070) and close above the VAH (1.35100) to confirm a continuation toward higher targets.
Bearish/Correction Scenario: If the price breaks the trendline and fails to hold 1.34950, it will likely enter a deeper technical correction toward the 1.34860 support level.
Summary: Closely monitor the reaction at the trendline. If you are holding long positions, consider tightening stop-losses or taking partial profits, as the price is struggling at the POC/VAH cluster.

BTC/USD CHART QUICK ANALYSIS I 29/121. Trend Overview
Main Trend: Strongly Bullish. The price has just made a decisive breakout from the previous consolidation zone.
Current Position: BTC is trading around $89,998, right at the critical psychological threshold of $90,000.
2. Volume Profile Analysis
Your chart highlights three key zones where price action typically reacts:
VAH Zone (Value Area High): Located around $89,150.
Significance: This is the immediate support level. Since the price broke above this zone with high volume (the long green candle), it confirms dominant buying pressure. If a correction occurs, this is the first line of defense for the bulls.
POC Zone (Point of Control): Located around $88,250.
Significance: This is the price level with the highest traded volume in the session. It acts like a "magnet." If the price fails to hold the VAH, it will likely gravitate toward the POC to find balance before deciding the next move.
VAL Zone (Value Area Low): Located around $87,400.
Significance: This is the final major support level for this specific bullish structure. A close below this zone would invalidate the short-term uptrend.
3. Key Technical Observations
Trendline Steepness: The trendline you drew following the candle bodies is very steep. This indicates extreme momentum. However, such steep angles are often unsustainable for long periods and frequently lead to a technical correction (retest).
Low Volume Nodes: Between $89,200 and $90,000, the horizontal volume bars are quite thin. This means the price rose rapidly because there was little selling resistance. Conversely, if the price drops, it may fall just as quickly back to the VAH/POC zones due to the lack of "support cushions" in between.
4. Potential Scenarios
Scenario 1 (Continuation): Price consolidates briefly around $90,000 and then breaks higher. The next targets could be $92,000 – $95,000.
Scenario 2 (Correction): Price fails to hold $90,000 and returns to test support levels.
An ideal "buy the dip" entry would be at the VAH zone ($89,150) or deeper at the POC zone ($88,250).
Summary: Near $90,000, profit-taking pressure is expected to be high. Watch for price reactions at the VAH zone for potential entry opportunities that align with the current trend.

This Sideways Move Is the Setup Before ExpansionETHUSD – 4H MARKET ANALYSIS
1. Market Structure
ETH is moving inside a sideways accumulation range after a strong impulsive move.
Price is forming higher lows above the main support, showing absorption rather than distribution.
2. Key Zones
Resistance Zone: ~3,150–3,160
→ Sellers are active, price is being capped.
Primary Support Zone: ~2,880–2,920
→ Strong demand, repeated defenses.
Secondary Support: ~2,770
→ Last line if the range fails.
3. Price Behavior
Repeated range oscillations → liquidity building.
No impulsive rejection from support → buyers still in control.
Compression near support often precedes expansion, not breakdown.
4. Scenarios
Bullish (Preferred):
Hold above 2,900
Break & accept above 3,160
Expansion toward 3,250+
Bearish (Lower Probability):
Clean breakdown below 2,880
Retest 2,770 liquidity zone
5. Conclusion
ETH is not trending yet it is preparing.
As long as price holds above the main support, this range favors upside continuation, not reversal.
Sideways here is accumulation — not weakness.

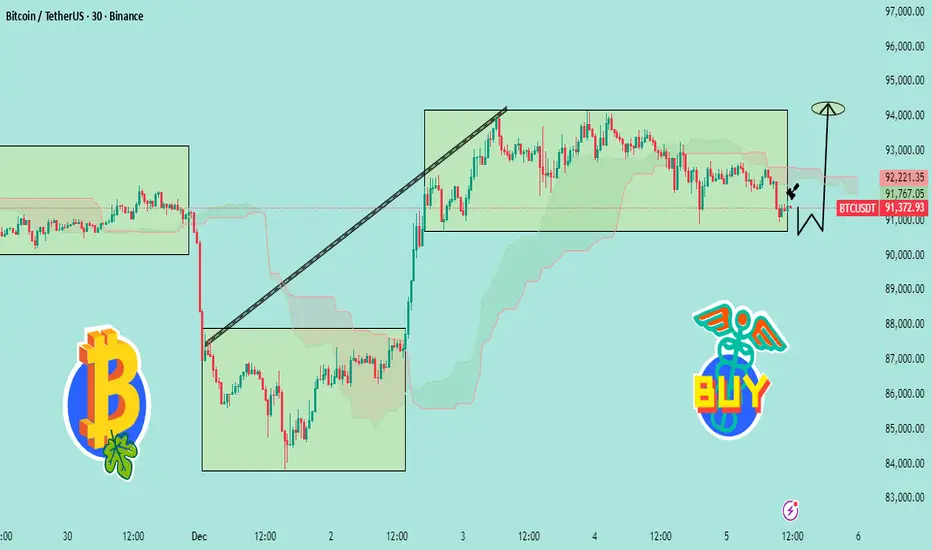
“BTC Bounce From Demand Zone – Targeting 94K Next📊 BTCUSDT Analysis (Based on Your Chart)
1️⃣ Price is Still Respecting the Range
Bitcoin is trading inside a wide consolidation box (around 91,000 – 93,000).
The recent drop tapped the bottom of the range, showing a clean liquidity sweep.
That wick below the box = fake breakdown → bullish signal.
---
2️⃣ Strong Reaction at Demand Zone
The chart shows BTC touching the demand/support zone, followed by a small bullish reaction (the black arrow).
This suggests:
Sellers failed to break lower
Buyers are stepping in exactly where expected
Market preparing for a reversal bounce
---
3️⃣ Expected Move (Your W Pattern Idea)
The drawn “W-shape” indicates a double bottom setup.
If the bottom holds around 91,000, BTC can push back toward:
🎯 Target: 93,500 – 94,000
This matches the upper boundary of the consolidation.
---
4️⃣ Bullish Scenario
If BTC holds above 91,000–91,300:
Reclaim mid-range
Break through resistance
Continue toward 94,000+
This aligns with the “BUY” tag you added.
---
5️⃣ Bearish Invalidations
Bullish idea is invalid if: ❌ Price closes below 90,800 on 30-minute
= fresh breakdown → deeper correction
---
🧠 Summary
BTC swept liquidity at the support → formed a bounce → still inside range → bullish reversal expected toward 94K
Busted Chart Patterns...What They Are?Hello traders,
Ever saw that textbook double bottom with all rules applied? Price broke the swing high and stayed above, clear entry, stop loss and tp targets. All of a sudden, price reverts and continues the move downwards. But why? its a double bottom for god's sake!! Every guru said its a guaranteed trade.
This was not a double bottom. This was "busted double bottom". So what is a busted pattern?
--------------------------------------------------------------------------
🔍 What defines a busted chart pattern?
A pattern is considered "busted" when all of the following occur:
1️⃣ Typical price breakout
Price closes above resistance or below support, or outside a pattern boundary (e.g., triangle trendline).
2️⃣ Limited follow-through
Price travels no more than ~10-15% in the breakout direction.
3️⃣ Failure & reversal
Volume and momentum stalls and price reverses
4️⃣ Invalidation close
Bearish breakout → price closes back above the top of the pattern
Bullish breakout → price closes back below the lowest low of the pattern
--------------------------------------------------------------------------
🔄 Can a single pattern bust more than once?
Yes.
Patterns can experience: Single (most common), double or triple bust.
Price could oscillate for days, weeks or months, repeatedly failing in both directions. Usually that is a clear sign of distribution, accumulation, or liquidity sweeping.
--------------------------------------------------------------------------
🧩 How this fits modern price action?
Busted patterns often align with:
- Liquidity grabs
- False breakouts
- Stop-hunt behavior
--------------------------------------------------------------------------
🛠️ How to capitalize on this in our trading?
If the normal pattern momentum is fading, wait for failure confirmation
- Use the reclaimed level as invalidation
- Expect expansion in the opposite direction
- Risk is often cleaner than chasing breakouts
--------------------------------------------------------------------------
📌 Examples
Busted Head & Shoulders
Busted Double Top
--------------------------------------------------------------------------
Patterns fail not because they are “wrong.” But because our mindset becomes one-sided.
Educational content only. Always manage risk and do your own analysis.
This knowledge and concepts are adapted from Thomas Bulkowski’s chart pattern research
If you find value in this content, please support the effort with a like & a comment

ETH Is Trapped Between Liquidity WallsETHEREUM MARKET ANALYSIS (ETHUSD – H1)
1. Market Context
Ethereum is currently trading inside a clear consolidation range after a previous corrective move. Price is oscillating between a well-defined support zone and a heavy resistance zone, showing classic liquidity accumulation behavior rather than trend continuation or breakdown.
This type of structure often precedes a strong directional expansion, especially during low-liquidity holiday sessions.
2. Key Technical Zones
Major Resistance Zone: 2,980 – 3,020
Key Support Zone: 2,880 – 2,920
Current Price Area: ~2,950–2,970
Dynamic Levels: EMA 34 & EMA 89 converging → compression
Price has repeatedly failed to accept above resistance, but sellers are also unable to push below the support zone decisively.
3. Price Structure & Behavior
Sideways structure with higher volatility swings inside the range
Multiple liquidity sweeps on both sides
No impulsive follow-through yet → confirms range environment
EMAs flattening → market is waiting for a catalyst
This is not a trend market at the moment — it is a pre-expansion phase.
4. Scenario Outlook
Primary Scenario (Bullish Expansion):
Price holds above 2,900–2,920
Strong breakout & acceptance above 3,020
Upside expansion toward 3,080 → 3,120+
Alternative Scenario (Final Liquidity Sweep):
One more dip into 2,880–2,900
Absorption of sell orders
Sharp reversal → breakout higher afterward
Invalidation:
Clean breakdown and acceptance below 2,880 would shift bias to a deeper correction.
5. Trading Bias
Market State: Accumulation / Compression
Best Strategy: Trade the range edges or wait for confirmed breakout
Risk Note: Holiday sessions = sudden spikes → reduce position size
Conclusion
Ethereum is coiling tightly between support and resistance.
This is a decision zone, not a random range. Once liquidity is fully absorbed, the next move is likely to be fast and directional. Patience here is a position.
Wait for confirmation the breakout will not be subtle.

Most Traders Lose Because They Don’t Know What a Trend Really IsDOW THEORY – THE FOUNDATION OF TREND READING
1. The Market Moves in Trends – Not Randomly
- Price does not move randomly. What looks like chaos is actually structured movement driven by collective behavior.
A trend exists when the market consistently creates:
+ Higher Highs & Higher Lows → Uptrend
+ Lower Highs & Lower Lows → Downtrend
As long as this structure remains intact, the trend remains valid regardless of news, opinions, or emotions.
2. Every Trend Has Three Levels of Movement
- Understanding timeframe hierarchy is critical.
Markets move in three simultaneous layers:
+ Primary Trend – the dominant direction (weeks to months)
+ Secondary Move – corrective phases against the main trend
+ Minor Swings short-term noise
Most traders lose money because they trade against the primary trend, reacting to minor swings and mistaking them for reversals.
3. The Three Phases of a Trend
A trend does not start or end suddenly. It evolves through three psychological phases:
1️⃣ Accumulation Phase
Smart money quietly builds positions
Price moves sideways, volatility is low
Public interest is minimal
2️⃣ Participation Phase
Trend becomes clear
Breakouts occur
Most trend-following profits are made here
3️⃣ Distribution Phase
Late buyers enter emotionally
Volatility increases
Smart money exits
Understanding these phases helps traders avoid buying tops and selling bottoms.
4. Structure Is the Only Valid Trend Confirmation
A trend is not confirmed by indicators alone.
A trend is confirmed when:
+ Price breaks structure in the trend direction
+ Pullbacks respect previous swing levels
+ Momentum continues after corrections
If structure is not broken, there is no reversal only a correction.
This is why predicting tops and bottoms is dangerous.
5. Volume Confirms Direction, Not Timing
Volume does not tell you when to enter — it tells you whether the move is real.
- Rising volume in the direction of the trend = confirmation
- Weak volume during pullbacks = healthy correction
- High volume against structure = warning sign
Price leads. Volume confirms.
6. A Trend Continues Until Proven Otherwise
This is the most ignored rule and the most important.
A trend does NOT end because:
- Price “already went too far”
- Indicators are overbought/oversold
- Social media says “top is in”
A trend ends only when structure breaks and fails to recover.
HOW TO APPLY THIS IN REAL TRADING
Simple, repeatable framework:
- Identify the dominant trend (HH/HL or LH/LL)
- Wait for a correction not a reversal
- Enter only after structure resumes in trend direction
- Place stop-loss where structure becomes invalid
- Hold until the market changes structure
No prediction. No guessing. Just reading what price is already telling you.
FINAL THOUGHT
Most traders don’t lose because they lack indicators.
They lose because they don’t understand trend behavior.
When you stop predicting and start reading structure,
the market becomes clear, calm, and repeatable.

GPB/USD M30 I 12/26Observation Tips:
Monitor the price reaction when it touches the bottom blue band (VAL zone).
Keep an eye on the descending trendline; bullish sentiment will only truly return if the price breaks above this line and climbs back over the POC.

BTC/USD 1h chart I 12/261. Key Components on the Chart
The chart highlights three critical price levels based on historical trading volume:
VAH (Value Area High - 88,856): The upper boundary of the value area. This acts as a resistance zone where sellers have historically stepped in.
POC (Point of Control - 87,796): Represented by the central line. This is the price level with the highest trading volume, acting like a "magnet" that attracts price action.
VAL (Value Area Low - 86,942): The lower boundary of the value area. This usually serves as a strong support zone where buyers find value.
2. Current Price Action
Breakout Attempt: The price recently made a strong push from the POC zone toward the VAH (88,856). Currently, the price is hovering right at this boundary.
Short-term Trend: Since the price is trading in the upper half of the value area, the short-term sentiment is bullish. However, maintaining a position above 88,856 is crucial for further upside.
3. Potential Scenarios
Scenario 1: Bullish Continuation
If BTC closes firmly above 88,856 and successfully retests this zone as support, the next targets would be the previous local highs around 90,000 - 91,200. In this case, VAH flips from resistance to support.
Scenario 2: Mean Reversion (Correction to POC)
If the price fails to hold above 88,856 and drops back into the "Value Area," it is highly likely to gravitate back toward the POC (87,796). This is a natural correction to find "fair value" based on volume.
Scenario 3: Bearish Drop
If selling pressure increases and the price breaks below the POC, the final support level in this structure is the VAL (86,942). This would be considered a "discount" zone for swing traders.
4. Key Takeaways
The Critical Level: 88,856. Watch the 1h candle close relative to this line.
Volatility Note: There are some "low volume nodes" (gaps in the volume bars) between the POC and VAH, which means the price can move very quickly (and sometimes unpredictably) through these zones.

HindOil Expo at Crucial Make-or-Break SupportThis is the weekly timeframe chart of HindOil Expo.
The stock is showing a strong Law of Polarity support zone in the ₹130–140 range and is currently attempting a reversal from this level.
If this support zone sustains, the stock may move towards higher price levels, with the channel’s upper boundary acting as the immediate short-term target around ₹180.
Thank you.

XAUUSD H1 CHART QUICK ANALYSIS I 26/11On Wednesday, Gold experienced a strong pullback from the new ATH at 4525 down to 4448.
The key point is:
👉 Price only retraced to the H1 ascending trendline and then bounced strongly.
This move was NOT a reversal, but a healthy technical pullback within a strong uptrend.
During today’s Asian session, Gold surged again and printed a new ATH at 4530, confirming:
• The uptrend remains intact
• Buyers are still in full control
• All pullbacks are simply momentum resets
📊 2. TECHNICAL STRUCTURE
• H1 structure: Clear Higher High – Higher Low
• Ascending trendline still respected
• No bearish structure break at all
➡️ This is a textbook example of a healthy and sustainable uptrend, not a fake rally.
🎯 3. TRADING PLAN
✅ Main bias: BUY with the trend
• Look for BUY opportunities at support and value zones
• Avoid counter-trend SELLs (SELL only for experienced scalpers with small size)
• Strict risk management – SL is mandatory because trading is probability-based
📌 Reminder:
Winning is not about buying everywhere, but buying at the right zone, with the right size and discipline.
