$BTC Weekly – Range Until Proven Otherwise!!CRYPTOCAP:BTC Weekly – Range Until Proven Otherwise
BTC remains below the weekly 55 EMA, a level lost in mid-Nov and repeatedly rejected since. $96.5K = major supply.
• Resistance: $96.5K (Weekly 55 EMA)
• Support: $87K (Monthly 21 EMA)
Bullish trigger: Weekly close + acceptance above $96.5K → $100K in play
Until then: Expect chop & failed rallies
When BTC trades below the weekly 55 EMA, momentum fades, and price tends to consolidate and chop. A reclaim of the 55 EMA signals renewed strength and typically leads to trend continuation.
Chart Patterns

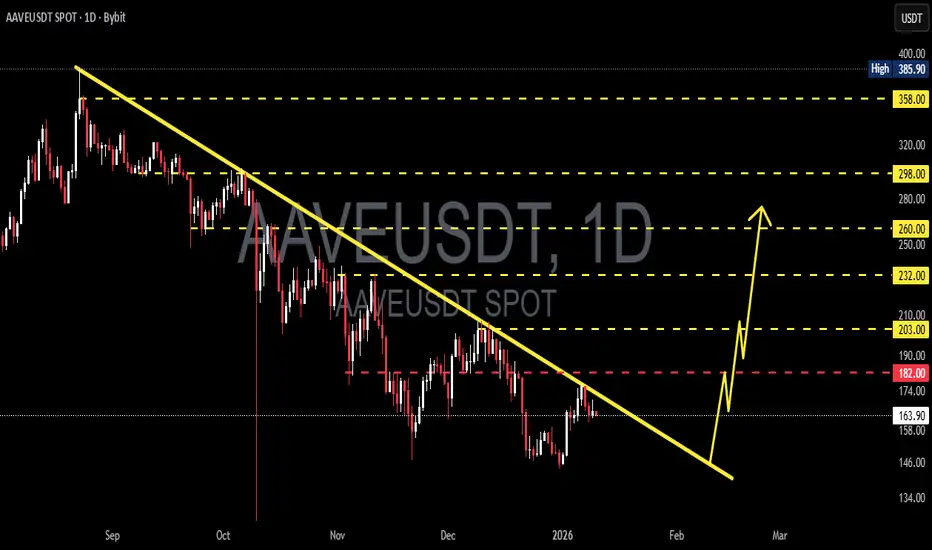
AAVE/USDT – Major Downtrend, Breakout or Another Rejection?On the daily timeframe, AAVE/USDT is still moving within a bearish market structure, with consistent selling pressure since the price peaked near the 385 USDT area. Price is currently trading below a descending trendline, which acts as a major dynamic resistance. As long as price remains below this trendline, sellers remain in control.
---
Chart Pattern (Pattern Explanation)
AAVE is forming a Descending Trendline (Bearish Structure), characterized by:
A series of lower highs since September
Multiple rejections along the descending trendline
Upward moves that appear corrective rather than impulsive
This pattern indicates that every rally is still considered a pullback unless a confirmed breakout occurs.
---
Key Levels
Resistance Levels:
182 USDT (minor resistance / rejection area)
203 USDT (mid resistance)
232 USDT (strong resistance)
260 USDT
298 USDT
358 USDT (major resistance & previous high)
Support Levels:
158 USDT (nearest support)
146 USDT (key support)
134 USDT (critical support, potential continuation to the downside)
---
Bullish Scenario
The bullish scenario becomes valid if:
Price breaks above and closes above the descending trendline
Followed by a successful break and hold above 182 – 203 USDT
Bullish targets:
203 USDT
232 USDT
260 USDT
298 USDT (extension target if momentum strengthens)
A valid breakout could signal the end of the bearish structure and open the door for a medium-term trend reversal.
---
Bearish Scenario
The bearish scenario remains dominant if:
Price gets rejected again at the descending trendline
Fails to reclaim the 182 USDT area
Breaks down below the 158 USDT support
Bearish targets:
146 USDT
134 USDT
A breakdown below 134 USDT would strengthen the case for a bearish continuation with increased selling pressure.
---
Conclusion
AAVE/USDT remains in a bearish trend, with the descending trendline acting as the key decision zone.
Trendline breakout → potential reversal
Rejection → bearish continuation
Waiting for clear confirmation is crucial before entering any position, supported by proper risk management.
---
#AAVE #AAVEUSDT #CryptoAnalysis #TechnicalAnalysis #Altcoin #Downtrend #BearishMarket #BullishBreakout #CryptoTrading #DeFi #PriceAction
Opportunity :: NatGas SHORT Re-entry Re-initiated post SL hit.
All other parameters are intact. FIB levels, EMA levels favourable.
🤞

Trade forecast on Xausd When you look at my markups, it tells you a story
from events that happened this week, we are looking at a new ATH come next week when the market opens
What's your take on xausd for the coming weeks?
feel free to share your insights in the comments below

Bitcoin Hits High-Timeframe Demand — Bounce or Breakdown?Price is reacting from a well-defined high-timeframe demand zone around 89,400–89,700, where sell-side momentum has slowed after a sharp bearish impulse. This area is a key liquidity pool that previously fueled strong upside expansion.
A bullish reaction from this demand zone could trigger a corrective recovery toward 90,800–91,600, with further upside extension possible toward 92,300 and 93,200 if buyers regain control.
However, a decisive break and close below 89,400 would invalidate the demand, exposing deeper downside toward 88,800–88,400. Price behavior at this zone will be critical in determining whether this move is accumulation or the start of a larger bearish continuation.

Bitcoin Is Building a Base — Accumulation Before the Next PushPrice is consolidating above the key support zone around 89,800–90,000, showing clear signs of selling pressure absorption after the recent sell-off. Volume behavior suggests potential accumulation rather than aggressive distribution.
As long as price holds above 89,800, the bullish scenario remains favored. A clean break and acceptance above 91,200–91,500 would confirm upside momentum, opening the path toward 93,000, followed by the major target near 94,700–95,000.
Only a decisive breakdown below 89,800 would invalidate the bullish setup. For now, buyers appear to be positioning for the next expansion leg to the upside.

Accumulation Before Expansion or Breakdown Into Liquidity?Hello traders! Here’s a clear technical breakdown of BTCUSD (1H) based on the current chart structure.
Bitcoin previously delivered a strong bullish impulsive move, establishing clear upside momentum and pushing price into premium territory. Following the peak, the market transitioned into a corrective phase, marked by controlled selling pressure and a gradual loss of bullish momentum rather than panic distribution.
The recent decline brought price back toward a key structural support, where selling pressure has noticeably slowed. Current price action is showing compression and stabilization, suggesting the market is deciding between continuation of the broader bullish trend or a deeper corrective leg.
Major Support / Demand Zone:
The 90,700–91,000 area is a strong support zone, where price has repeatedly reacted and volume has increased. This zone also aligns with previous consolidation and acts as a structural pivot for the broader trend.
Liquidity Range Below:
Below current price sits a liquidity-rich zone near 86,900, corresponding to the prior accumulation range. A breakdown into this area would indicate acceptance of lower prices and a shift toward a bearish continuation phase.
Overhead Resistance Levels:
If price holds support, upside targets are layered at:
- 92,200 – first structure resistance
- 93,200 – prior reaction high
- 94,400–94,800 – major liquidity and range high
These levels define the bullish roadmap if support holds.
Currently, BTC is trading directly on top of a strong support level, with price holding above the EMA and failing to extend lower despite prior sell pressure. This behavior often reflects absorption by buyers, rather than aggressive sell-side continuation.
The market is compressing, not accelerating typically a precursor to expansion.
As long as Bitcoin holds above the 90,700–91,000 support zone, the broader bullish structure remains valid. In this case, current price action can be treated as accumulation after correction, with potential for a push toward 92,200, followed by continuation into the 93,200 and 94,400+ resistance zones.
However, a decisive hourly close below support, followed by acceptance, would invalidate the bullish continuation thesis. That scenario would likely send price into the previous accumulation area near 86,900, confirming a deeper corrective or trend transition phase.
For now, support is holding but it must be respected, not anticipated.

Bitcoin Is Holding Demand — Bulls May Be Setting Up the Next Price is reacting positively from a well-defined demand zone around 89,700–90,000, where selling pressure has been absorbed after the recent pullback. Despite the prior correction, the broader structure remains constructive as buyers defend this key area.
A sustained hold above the demand zone opens the door for a bullish recovery toward 91,400–92,300, where price may pause near the EMA and prior intraday resistance.
If bullish momentum strengthens and price breaks and closes above 92,300, the upside continuation scenario comes into play, targeting 93,200–93,700 as the next expansion zone. As long as price holds above 89,700, the upside scenario remains the primary focus.

Home ConstructionLooking at ITB, home construction could be finally waking up. I'm going to add this to my watch list for both my Trend Following account (weekly charts) and Swing Trading account (daily charts). I've got a list of stocks with good volume to consider buying once we get a pullback and an entry signal. As soon I notice a good setup that I like I'll try to go ahead and post it. Cheers!!

Bitcoin to 103,000Bitcoin current price $90,585, and broke a downward trend line and now looking forward to the next liquidity which is sitting at $103,000🚀🚀

SOL / USD Post-Expansion Pullback Into Multi-Timeframe SupportSolana recently completed a strong directional advance, confirmed by multiple upside target hits across the lower timeframes and sustained expansion above the short-term mean. Following this move, price has entered a corrective phase, rotating back toward the mid-range while higher-timeframe structure remains intact.
The most recent daily candles show price trading below the short-term average, signaling short-term weakness, while the broader trend context continues to favor higher-timeframe support holding.
Momentum & Regime Behavior
Momentum has rolled over from elevated levels after the prior expansion, reflecting a cooldown rather than a confirmed trend reversal. The projected momentum cross ahead highlights a potential decision zone where price may either stabilize and resume the broader trend or continue retracing into deeper support.
Importantly, the weekly context remains bullish, suggesting that current weakness is corrective unless confirmed otherwise by structure.
Key Levels to Monitor
Support Zone: The lower daily target region represents the first area where buyers may attempt to reassert control. Holding this zone keeps the broader bullish structure intact.
Upside Reclaim Zone: A sustained move back above the short-term mean would improve the probability of rotation toward higher daily and weekly targets.
Invalidation: A decisive breakdown below daily support would weaken the current structure and open the door to a deeper pullback toward lower weekly levels.
Forward-Looking Outlook
As long as price remains supported above higher-timeframe structure, the prevailing bias is neutral-to-bullish, with the current move best characterized as a post-expansion pullback rather than a trend failure. Directional clarity is expected to emerge as price resolves around the highlighted support and momentum realigns.
Summary
Trend: Higher-timeframe bullish, short-term corrective
State: Pullback following expansion
Bias: Neutral-to-bullish while daily support holds
Confirmation: Reclaim of short-term resistance
Invalidation: Loss of daily structural support
This analysis is forward-looking and based solely on current price behavior and indicator structure. Always apply confirmation and risk management appropriate to your strategy.

XAU/USD - Structural Context Shifts Across December–January (4H)December–January higher-timeframe context on XAU/USD.
5 Dec - New Moon
Market opens into a new structural phase.
11 Dec - Bullish Brain Zone forms (~$4226)
Strong directional intent appears on the higher timeframe.
22 Dec - Full Moon
Momentum begins to slow as price approaches the upper end of the range (~$4550).
29 Dec - Bearish Brain Zone forms (~$4470)
Structure shifts, followed by a retest and continued downside into the low ~$4280s.
Early Jan - New Moon (~4 Jan)
Price opens with renewed strength, forming a bullish Brain Zone around ~$4402 and rotating back toward prior bearish structure near ~$4500 as a retest.
This sequence highlights how higher-timeframe Brain Zones and lunar cycles can be used to frame continuation, slowdown, and correction phases as price unfolds, without relying on short-term noise. As of now the broader bullish trend remains intact.
Indicator visual concept shown: Johnny’s Calculated Brain (invite-only).

Bitcoin to 95k calling it while lazy TA traders say Bear FlagIt always surprises me how lazy technical analysis has become. What has TA turned into? Google image search "bearish pattern" → draw two parallel lines → post for engagement.
Let's go candle by candle since nobody else will:
Within this "bearish pennant" - which depending on how you draw your trendlines is ALSO clearly a rising wedge - there are about 80 different patterns unfolding. But sure, let's talk about the one pattern your dog could identify.
Here's what kills me: Did anyone mention the micro head and shoulders forming inside this structure? No? Just lazy bear flag posts? Nobody's talking about the patterns within the pattern.
THE STRUCTURE:
Cup & Handle, inverses etc forming inside a Rising Wedge
Inside a Rounded Triple Bottom
Forming the right shoulder of a macro Inverse Head & Shoulders
Micro H&S within the current consolidation
Neckline sits at 97.5K
Broken uptrend now acting as a MAGNET - price will hug this line on the way back up
THE LEVELS (since nobody else gave you any):
Invalidation: 94,266 - Break this and the micro H&S fails
Target 1: 95K - Within 7 days
Target 2: 105K - Within 30 days if structure holds
If bearish plays out: 76,556 zone - If that micro H&S breaks down, there's room for one more push lower
THE REALITY:
In this market you have to adapt like water. If 94,266 breaks and the micro H&S plays out bearish, there's room for a final push down. I'm not married to a direction - I'm married to levels and structure. The market will tell you what it wants to do.
But here's what I know: if you're posting bear flags, you better be short. Post your positions or don't post at all. It's complete nonsense if you can't stand on what you post.
I'm long here.
That's the difference. I'm telling you my position, my invalidation, and my targets. Where's yours?
To the bear flag crowd:
Go take your shorts. Post your entries. Show me your stop loss. Explain the logic behind your actual bearish formation beyond "it looks like the picture I googled."
Give me specific invalidation levels. Tell me where you're wrong. Otherwise you're just posting for likes while real traders are positioning.
95K in 7 days. 105K in 30. I'm long.
Your move.


GU BEARISH DEEP CRAB HARMONIC PATTERN I see this as bullish. But I also see price gaining strength before pushing higher, this means price may push lower before starting to hike will publish a 4h chart to follow.

XAUUSDXAUUSD is still in an uptrend. If the price can remain above $4420, further price growth is expected.
🔥Trading futures, forex, CFDs and stocks carries a risk of loss.
Please consider carefully whether such trading is suitable for you.
This content is not financial advice. Always conduct your own financial due diligence.
>>GooD Luck 😊
❤️ Like and subscribe to never miss a new idea!

CJ RANGE WAITING GAME...
Price is ranging, will wait to see how price reacts possibly enter longs and shorts as long as price respect range limits.

Gold at Yearly Highs — Patience Before the Real MoveGold opened the week with an aggressive expansion straight into the previous Yearly & Monthly High — classic stop-run behavior rather than clean continuation. Price is now consolidating above last week’s range during the Asian Killzone, but I’m not seeing a quality entry yet.
I have a 4H order block around 4520–4504 that could attract price, but this is still premium territory. With sell-side liquidity sitting below Daily and Weekly lows, I’m expecting a deeper pullback or a clearer structure shift before committing to longs.
Tuesday historically sets the tone for the week, so for now I’m content sitting on my hands and letting the market show its intentions. Patience here is part of the edge. 🧠

“Gold (XAUUSD) Respecting Key Support After Trend Break”“Gold (XAUUSD) has previously experienced a clear trend break, after which price retraced into a well-defined support zone where buyers showed strong interest. This area has since acted as a base, allowing price to stabilize and begin forming higher lows, suggesting improving bullish structure. At present, price is consolidating above this support, which may indicate accumulation before the next directional move. If this structure continues to hold, a continuation toward higher resistance zones remains a possible scenario. Conversely, a sustained loss of the support area would signal weakness and invalidate the bullish bias. As always, patience, confirmation, and disciplined risk management are essential when navigating such market conditions.”


AU BEARISH SETUPWaiting to see how price treats major monthly resistance. Price could pull back further to gain momentum to pierce through said resistance.

Daily Analysis: Nifty 12-01-2026Nifty remains weak with a controlled selling pressure. Prices right now is between no trade zone
All major levels are mentioned and explained.

Gold Uptrend Strengthens, New Expansion Phase BeginsOver the past week, gold has continued to advance in a very “textbook” manner. What stands out is not how far price has moved, but how it has moved: steady, controlled, and consistently supported by both technical structure and the macro backdrop. On the H4 chart, this is the type of bullish behavior traders like to see—impulse higher, shallow pullback, then continuation.
Gold started the week around the 4,370 USD/oz area, quickly reclaimed the 4,400 level, and more importantly, managed to hold above it for most of the week. Structurally, 4,400 is no longer acting as resistance; it has transitioned into a new support base, signaling that the market is accepting a higher price regime.
As price approached the 4,440–4,450 zone, profit-taking pressure emerged, leading to a brief pullback toward the 4,426 area. What I find particularly constructive is that this entire retracement did not damage the structure. Price never lost 4,400, and each dip was quickly absorbed by fresh buying interest. This behavior clearly reflects the current market state: buyers remain in control, while sellers are only strong enough to create short-term fluctuations, not a reversal.
By the end of the week, gold decisively broke above the psychological 4,500 USD/oz level and closed around 4,510. On the H4 timeframe, this was a relatively clean break-and-hold, suggesting the market is ready to operate at a higher range rather than merely staging a temporary breakout.
From a purely technical perspective, the uptrend remains firmly intact. Price continues to trade above the H4 EMAs, both of which are sloping upward. Pullbacks are not breaking prior lows, and key support zones—most notably 4,450–4,470, and deeper at 4,400—remain valid. With this structure, I see no meaningful signs of weakness in the medium-term trend. If anything, the market looks like it is undergoing a brief re-accumulation phase ahead of the next leg higher.
This price action aligns well with the macro narrative. After the NFP report came in broadly in line with expectations, markets have maintained the view that the Fed is unlikely to re-tighten policy aggressively, easing rate-related pressure on gold. At the same time, central bank gold demand remains strong, geopolitical risks have not faded, and the US dollar continues to face longer-term pressure from monetary and fiscal dynamics. Together, these factors provide a sufficiently solid macro foundation to support the current bullish trend in gold.
