Time frame matters ... ETH make up your mindPrice is consolidating above trend support, showing buyers continue to step in on dips rather than chasing lower. The market is compressing under a clear supply zone, which keeps this a patience game for now.
As long as structure holds, the bias leans continuation. A clean break and acceptance above resistance would open the door for expansion. On the flip side, losing trend support shifts focus to deeper support where demand previously stepped in.
Momentum is stabilizing, volume suggests absorption, and ETH is setting up for a decisive move. Let the level do the talking.
Chart Patterns

NVDA Options Alert — Max Pain Pull Likely This Week!📉 NVDA Weekly Trade — QuantSignals V3 (2026‑01‑13)
Direction: BUY PUTS
Confidence: 65% (Medium)
Expiry: Jan 16, 2026 (3 days)
Strike: $185.00
Entry: ~$2.78
Target 1: $4.17 (+50%)
Target 2: $5.56 (+100%)
Stop Loss: $1.95 (‑30%)
Position Size: 3% of portfolio
Why Trade:
Bearish weekly momentum (-1.41% 1W)
Max Pain at $182 → potential pull-down
Institutional flow and technicals favor downside
Minor intraday bounce is a “sell the rip” opportunity
Risk Notes:
Moderate risk: oversold RSI could trigger a small bounce
Exit if NVDA breaks above $186.50
Rising VIX may increase volatility
🚨 IMPORTANT NOTES
VIX Watch: If VIX crosses 18.00, volatility expansion will benefit this position regardless of price direction (Vega expansion).
Oversold Bounce: If NVDA breaks above $186.50, the bearish thesis is invalidated; exit the position immediately.
Profit Taking: Given the 3-day window, consider closing 50% of the position if Target 1 is hit to secure "house money."


Bearish drop?EUR/USD has rejected off the resistance level, which is an overlap resistance, and could drop from this level to our take profit.
Entry: 1.1678
Why we like it:
There is an overlap resistance level.
Stop loss: 1.1734
Why we like it:
There is an overlap resistance level that aligns with the 61.8% Fibonacci retracement.
Take profit: 1.1569
Why we like it:
There is a pullback support that aligns with the 61.8% Fibonacci projection.
Enjoying your TradingView experience? Review us!
Please be advised that the information presented on TradingView is provided to Vantage (‘Vantage Global Limited’, ‘we’) by a third-party provider (‘Everest Fortune Group’). Please be reminded that you are solely responsible for the trading decisions on your account. There is a very high degree of risk involved in trading. Any information and/or content is intended entirely for research, educational and informational purposes only and does not constitute investment or consultation advice or investment strategy. The information is not tailored to the investment needs of any specific person and therefore does not involve a consideration of any of the investment objectives, financial situation or needs of any viewer that may receive it. Kindly also note that past performance is not a reliable indicator of future results. Actual results may differ materially from those anticipated in forward-looking or past performance statements. We assume no liability as to the accuracy or completeness of any of the information and/or content provided herein and the Company cannot be held responsible for any omission, mistake nor for any loss or damage including without limitation to any loss of profit which may arise from reliance on any information supplied by Everest Fortune Group.

AUDUSD: Head And Shoulders Chart Pattern.Hi everyone,
AUDUSD is currently in formation of head shoulders chart pattern, in regards to the structure been displayed. we are patiently waiting for a break down below the support level, to further clear our short confirmation and entry.
What is your opinion on this idea ?
Thank you for reading.

S&P 500 Hits a Record – But Is Everything Really So Positive?S&P 500 Hits a Record – But Is Everything Really So Positive?
As the S&P 500 chart shows, the index touched 6,990 yesterday, marking an all-time high for the first time. The psychological 7,000 level is now within close reach. Optimism may be driven by the start of the earnings season, which could confirm continued growth in corporate profits.
But is the outlook entirely positive?
From a fundamental perspective, several factors could raise concerns:
→ News surrounding a criminal case involving Jerome Powell. This may be perceived as pressure on the Fed Chair and a threat to the central bank’s independence, potentially undermining the investment climate.
→ The upcoming release of CPI data (scheduled for today at 16:30 GMT+3). A scenario in which the figures point to rising inflation cannot be ruled out, which could trigger a sharp sell-off in equity markets.
→ Risks of the US becoming involved in new military conflicts.
From a technical standpoint, bearish signals are also emerging on the chart.
Technical analysis of the S&P 500
Price action in the S&P 500 is forming an ascending channel. However, it is worth noting the market’s reaction after reaching the upper boundary of this channel: on two occasions (as indicated by the arrows), the index has seen sharp pullbacks towards the median line. This behaviour suggests aggressive selling pressure. At the same time, the RSI indicator is showing bearish divergence.
The channel median has so far acted as solid support. Nevertheless, with bears successfully defending the psychological 7,000 level and the fundamental backdrop capable of delivering negative surprises, sharper declines in the S&P 500 cannot be ruled out.
In such a scenario, potential downside targets may include:
→ the 6,888 support level, where the red trendline was broken;
→ the lower boundary of the ascending channel.
This article represents the opinion of the Companies operating under the FXOpen brand only. It is not to be construed as an offer, solicitation, or recommendation with respect to products and services provided by the Companies operating under the FXOpen brand, nor is it to be considered financial advice.

Potential bearish drop for the Kiwi?The price could make a short-term pullback to the resistance level, which is a pullback resistance, and could drop from this level to our take profit.
Entry: 0.5755
Why we like it:
There is a pullback resistance level.
Stop loss: 0.5776
Why we like it:
There is an overlap resistance level
Take profit: 0.5706
Why we like it:
There is a pullback support level that aligns with the 78.6% Fibonacci retracement.
Enjoying your TradingView experience? Review us!
Please be advised that the information presented on TradingView is provided to Vantage (‘Vantage Global Limited’, ‘we’) by a third-party provider (‘Everest Fortune Group’). Please be reminded that you are solely responsible for the trading decisions on your account. There is a very high degree of risk involved in trading. Any information and/or content is intended entirely for research, educational and informational purposes only and does not constitute investment or consultation advice or investment strategy. The information is not tailored to the investment needs of any specific person and therefore does not involve a consideration of any of the investment objectives, financial situation or needs of any viewer that may receive it. Kindly also note that past performance is not a reliable indicator of future results. Actual results may differ materially from those anticipated in forward-looking or past performance statements. We assume no liability as to the accuracy or completeness of any of the information and/or content provided herein and the Company cannot be held responsible for any omission, mistake nor for any loss or damage including without limitation to any loss of profit which may arise from reliance on any information supplied by Everest Fortune Group.

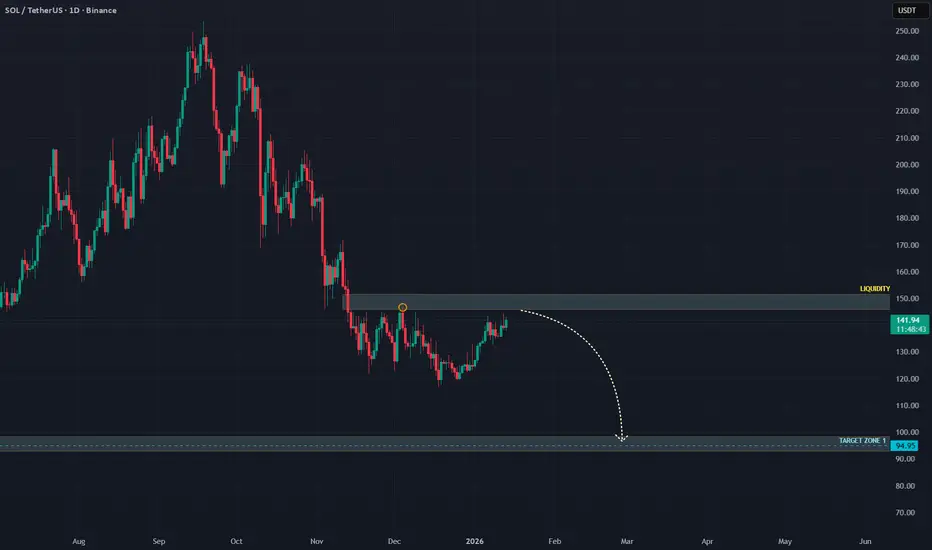
SOLANA — Absorption at HTF Resistance | Downside Risk IncreasingTraders,
CRYPTOCAP:SOL pushed into resistance and stalled. Not aggressively. Not weakly either.
What we are seeing now is absorption, and the market is quietly deciding what to do next.
The question is not “bullish or bearish.”
The question is where the real decision gets made.
Right now, the chart gives us a very clean structure.
1. What happened
SOL rallied back into a higher-timeframe resistance zone around $142–145.
This area is important because:
It previously acted as distribution
It aligns with a harmonic exhaustion level
Liquidity is clearly resting above
Price did not reject immediately.
Instead, it slowed down.
That already tells us something.
2. What price is doing now
On the 1H, price is pushing higher in small steps:
Push
Pause
Shallow pullback
Push again
Each high looks constructive, but none are being accepted cleanly.
This is not breakout behavior.
This is price being worked inside supply.
Liquidity above is visible.
Yet price hesitates just below it.
3. Momentum in strength, not divergence
RSI is not aggressively diverging here.
Instead:
RSI stays elevated
Each push higher produces less expansion
Momentum rolls over inside strength
That usually means effort is being absorbed, not rewarded.
When momentum stalls at resistance without breaking down, it often reflects absorption inside strength, not weakness.
4. Spot flow tells the real story
Spot CVD continues to rise.
On both the 1H and the 4H, spot CVD is making clear higher highs. Buyers are not hesitating. Market orders keep hitting the ask, and spot demand is persistent across timeframes.
On the surface, that looks bullish.
But price is not responding.
Despite spot CVD printing higher highs, price remains capped beneath resistance and fails to gain acceptance. Each attempt higher is absorbed rather than extended.
That mismatch matters.
When spot demand increases across multiple timeframes and price fails to move, it usually means one thing:
Supply is sitting above the market
Sellers are passive and patient
Buyers are doing all the work
This is classic absorption behavior.
The important detail here is that this is not a single-timeframe signal. The fact that spot CVD is making higher highs on both the 1H and 4H strengthens the read. Real buyers are present, but they are being met by consistent supply.
That is not how breakouts start.
That is how distribution hides.
5. Futures are not confirming
While spot keeps buying:
Stablecoin-margined futures CVD trends lower
Perp traders are selling into strength
Leverage is not chasing this move
Coin-margined futures remain net negative, suggesting longer-horizon participants are still distributing.
Different groups, same message: less appetite for higher prices here.
6. Open interest adds tension
Open interest remains elevated.
Price is not expanding, yet positions are being added.
That creates pressure.
Crowded markets don’t drift.
They eventually move, and usually fast.
7. The higher-timeframe context
On the daily, accumulation and distribution remains pointed lower.
Rallies continue to be used to offload supply.
This move fits that pattern.
Push into resistance.
Effort from buyers.
No acceptance.
8. The decision zone
The area around $142–145 is the key checkpoint.
This is where supply has been active before, and it is where the market has to prove it can do more than just absorb.
If price:
Pushes slightly higher
Sweeps the liquidity sitting in the blue box
But fails to hold or shows weakening spot follow-through
Then this area becomes a distribution and take-profit zone, not a breakout.
A sweep without acceptance is often the final act before rotation.
If sellers remain patient here, downside opens quickly.
9. Downside focus
Below the current range, the structure is thin.
There is unfinished business lower, and price has not spent enough time there to build support.
Target zone: $94–100
This area stands out because:
It previously acted as acceptance
Liquidity is concentrated there
It represents a clean mean reversion for the entire move
If price starts to roll from the current region, this zone becomes the primary magnet.
Moves like this rarely stop halfway.
10. How to read it in real time
A push into the blue box followed by stalling price and slowing spot CVD → distribution
Spot CVD still rising but price failing to hold → absorption, not strength
Spot CVD rolling over at highs → rotation starting
The market does not need to break down immediately.
It only needs to stop rewarding buyers.
When that happens, the path lower opens fast.
------------------------------------------
The market is leaning into supply.
It may take one more push into liquidity before the real move starts, but the risk remains skewed lower as long as buyers are not being rewarded.
Let price do the talking.
If this analysis helped you see the structure more clearly, a like is always appreciated.
Feel free to share your thoughts or alternative scenarios in the comments.
Thanks for reading.
Review and plan for 14th January 2026Nifty future and banknifty future analysis and intraday plan.
Quarterly results- hcltech, tataelxsi, dmart.
This video is for information/education purpose only. you are 100% responsible for any actions you take by reading/viewing this post.
please consult your financial advisor before taking any action.
----Vinaykumar hiremath, CMT

AUDUSD BEARISH IDEAWe can see an unconfirmed H&S (Head and Shoulders). I would look to sell after a strong close below 0.6660 zone which is also the neckline.
Trade conditions.
1. Wait for the retest of the neckline
2. Use proper risk management!!!

#USDJPY: One Last Bullish Push Taking Price To 170!The USDJPY pair has been bullish for the past few months, evidenced by the extreme bullish volume in the market. Given the weakening JPY, we believe the price is likely to rise further. A final push could help us with our trading setup.
You might consider setting two take profit levels.
Like and comment for more.
Team Setupsfx_

Party LineGood start into 2026!
Jan 5th update price of .00105 still puts VARA up over 50% for the year, but the Bulls need to now step up and push through the current resistance to keep the party going.
If not, a potential retest of the bottom BB is back on the table.

CADJPY — 4H | Triple-Top Resistance at 1.5-Year HighsCADJPY has moved back into a major resistance zone that has been tested three times previously, making this a potential triple-top structure at 1.5-year highs.
This level is technically important because it has repeatedly acted as a ceiling, and price is now being forced to decide once again whether it will:
Reject and reverse, or
Break and hold above resistance and continue higher
From a VMS perspective:
Momentum is currently at 100, which is highly extended and often precedes either consolidation or reversal
Structure is at a historically proven resistance area
We will wait for price action, volume, and momentum to confirm any setup
At this point, no trade is taken.
This is a watch zone, not a prediction.
If price rejects this level with VMS confirmation, reversal setups will be considered.
If price breaks and holds above it, continuation setups will be evaluated.
Simple rules.
Serious discipline.
Not financial advice. Always do your own analysis and manage risk accordingly.

Weekly VIX CALLS Alert — Katy AI Sees Upside!🎯 Trade:
Direction: CALL (LONG)
📅 Expiry:
This Friday – Jan 16
💵 Prices:
Buy: $0.09–$0.10
Take Profit: $0.15
(Optional) Bigger Profit: $0.20
Stop Loss: $0.05
💰 TRADE SETUP
Expiry Date: 2026-01-16 (4 days)
Recommended Strike: $25.00
Entry Price: $0.09 - $0.10 (Based on current Mid Price of $0.09)
Target 1: $0.15 (66% gain from entry)
Target 2: $0.20 (122% gain from entry)
Stop Loss: $0.05 (44% loss from entry)
Position Size: 2-3% of portfolio
📈 Why:
AI expects VIX to go a little higher this week
News + uncertainty may push volatility up
MODERATE RISK WARNING: Consider reducing position size due to moderate confidence level.

Indosolar- roce optgIndosolar- roce optg
1) If techncials are to be believed as Per Book baba
2) Double bottom formed
3) Higher Bottom
4) H1 h2 concept done.

SPY Forecast: Katy AI predicts Market Turn SPY QuantSignals Katy 1M Prediction 2026-01-13
🚀 QuantSignals Katy AI Stock Analysis
Analyzed 1 stock(s): SPY
📈 SPY Analysis
Current Price: $695.86
Final Prediction: $694.54 (-0.19%)
30min Target: $694.69 (-0.17%)
Trend: NEUTRAL
Confidence: 52.8%
Volatility: 2.2%
ℹ️ No trade signal generated (insufficient confidence/move size)
Summary: Generated 0 trade signals from 1 successful analyses out of 1 symbols.

MARA HoldingsNASDAQ:MARA
Perfect bounce off the 0.5 extension on the monthly timeframe.
The key question is when the 4-year range will finally break.
Next resistance is the Tenkan and 21 MA around $16.20.
Above that, the 0.618 level around $19.55 comes into play.

EURGBP Is Bullish! Buy!
Please, check our technical outlook for EURGBP.
Time Frame: 4h
Current Trend: Bullish
Sentiment: Oversold (based on 7-period RSI)
Forecast: Bullish
The market is approaching a significant support area 0.865.
The underlined horizontal cluster clearly indicates a highly probable bullish movement with target 0.868 level.
P.S
Overbought describes a period of time where there has been a significant and consistent upward move in price over a period of time without much pullback.
Like and subscribe and comment my ideas if you enjoy them!

GBPAUD Will Move Lower! Short!
Take a look at our analysis for GBPAUD.
Time Frame: 1h
Current Trend: Bearish
Sentiment: Overbought (based on 7-period RSI)
Forecast: Bearish
The market is approaching a key horizontal level 2.011.
Considering the today's price action, probabilities will be high to see a movement to 2.006.
P.S
We determine oversold/overbought condition with RSI indicator.
When it drops below 30 - the market is considered to be oversold.
When it bounces above 70 - the market is considered to be overbought.
Like and subscribe and comment my ideas if you enjoy them!

SILVER BEST PLACE TO SELL FROM|SHORT
Hello, Friends!
We are going short on the SILVER with the target of 7,986.4 level, because the pair is overbought and will soon hit the resistance line above. We deduced the overbought condition from the price being near to the upper BB band. However, we should use low risk here because the 1W TF is green and gives us a counter-signal.
Disclosure: I am part of Trade Nation's Influencer program and receive a monthly fee for using their TradingView charts in my analysis.
✅LIKE AND COMMENT MY IDEAS✅

Re-entered this $SMCI short, Goldman Sachs has just downgraded iRe-entered this NASDAQ:SMCI short, Goldman Sachs has just downgraded it to sell.
After compression phase (pink box) there next phase is always a trending move.


Elise | XAUUSD - 30M | Liquidity Sweep & Bullish ContinuationOANDA:XAUUSD
After sweeping sell-side liquidity below prior lows, XAUUSD reacted aggressively from HTF demand and reclaimed structure with strong bullish momentum. The impulsive move higher confirms buyers in control. Current price action is consolidating above the breakout area, suggesting continuation rather than distribution as long as structure holds.
Key Scenarios
✅ Bullish Case 🚀 → Holding above the broken liquidity zone and trendline opens continuation toward higher liquidity and premium targets.
❌ Bearish Case 📉 → Acceptance back below the trendline and failure to hold above the sweep zone invalidates bullish bias and signals deeper correction.
Current Levels to Watch
Resistance 🔴: 4605 – 4620
Support 🟢: 4520 – 4495
⚠️ Disclaimer: This analysis is for educational and informational purposes only. It is not financial advice.
