Chart Patterns

EURJPY Forms Rare Reversal, Aiming For Price Gap??OANDA:EURJPY has formed a rare Reversal Pattern, the Three Drives Pattern, lets break it down!
The Three Drives Pattern consists of 3 Bullish attempts to continue pushing price higher. The 3rd attempt is a Fibonacci Extension of the DE Leg giving us Point F where Price, encountering Resistance at the 138.2% Extension @ 180.008, should reverse and head lower!
We can see starting the week that OANDA:EURJPY is opening below this level and if Price is unable to move higher, we can expect it to fall from here!
When it does, there is a big Price Gap in the 174.712 - 173.249 Range to fill with the Low or Point A being the next line of support @ 172.260 being the Price Target!
This could generate a great Short Opportunity!

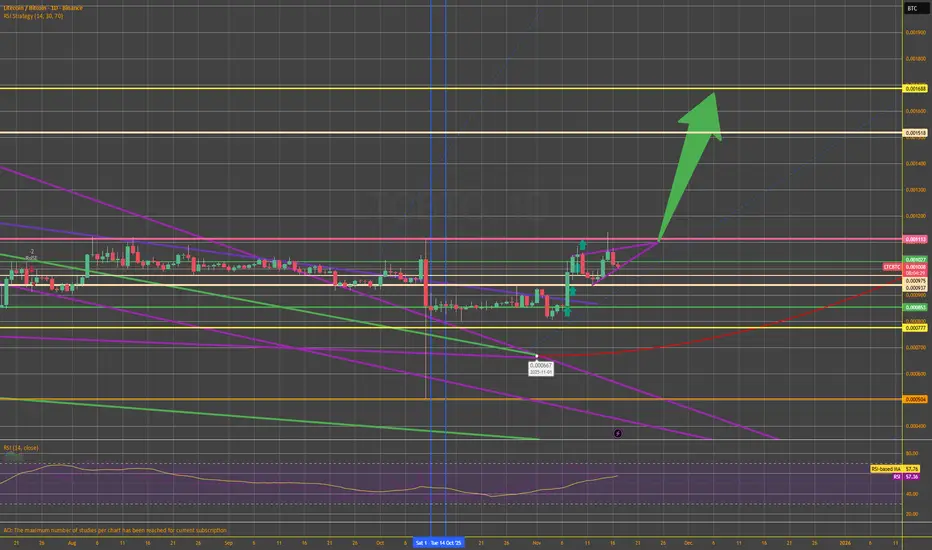
Remember Remember, the (2)5th of novemberLitecoin could see a potential breakout on the LTC/BTC chart within a week to 25/11/2025 the latest, if it stay's above the 0.001 range;
#LTC @litecoin
EURGBP Short Term Trade📉 EUR/GBP – Short-Term Trade Idea
Bias: Bearish
Setup: EUR/GBP showing signs of exhaustion after recent upticks, with momentum indicators turning lower. Price struggling to hold above near-term resistance, suggesting potential for a pullback.
Plan: Looking for a short entry on weak bounces, targeting a move back toward recent support levels. Tight risk management given the pair’s typically low volatility.
Catalysts: UK data beats or EUR softness could accelerate downside.

NZDJPY – Bullish Momentum Building Up NZDJPY – Bullish Momentum Building Up
NZDJPY continues to climb higher after reclaiming the 87.30 support area, showing strong bullish momentum.
The pair is likely forming a bullish continuation structure, suggesting further upside in the short term.
A small pullback toward the 87.30–87.40 zone could offer buyers a chance to rejoin the move before price targets the next resistance zones at 88.00 and 88.60.
📈 Key Targets:
Target 1: 88.00
Target 2: 88.60
Momentum remains in favor of the bulls as long as the price stays above the support zone
You may find more details in the chart!
Thank you and Good Luck!
❤️PS: Please support with a like or comment if you find this analysis useful for your trading day❤️

USDJPY analysis todayHello traders, this is a complete multiple timeframe analysis of this pair. We see could find significant trading opportunities as per analysis upon price action confirmation we may take this trade. Smash the like button if you find value in this analysis and drop a comment if you have any questions or let me know which pair to cover in my next analysis.

My Bitcoin ScenarioWe should either hunt the low of 72k$ or find support on the volume cluster above before we can see some long momentum.
Both possible supports at 92k and 88k are weak supports so i don't think they have a lot of significance.

GBP/USD Heading Towards Support Breakdown?Hello everyone, today we will analyze the GBP/USD pair in the context of the current market situation.
Regarding the news, the GBP is under significant pressure as data from the UK shows the unemployment rate has risen to 5% , raising concerns among investors about the economic situation and the possibility that the Bank of England (BoE) may have to cut interest rates in the near future. Additionally, the USD is strengthening, driven by the market's expectation that the Fed will maintain high interest rates, putting further downward pressure on GBP/USD.
Technically, the chart shows that GBP/USD is trading in an ascending channel . However, the price has failed to break through the important resistance level at 1.31800 in the most recent attempt. This suggests that buying pressure is weakening, and if this level cannot be breached, the downtrend may continue.
The strong support level currently lies at 1.31300. If the price breaks below this level, the pair could drop further, heading towards the next support zone at 1.31000. These are crucial levels that traders should watch in the coming hours.
In conclusion, with the current news and technical analysis, it is highly likely that GBP/USD will continue its downward trend in the next 24 hours, unless there are significant changes in policy or data from the BoE or Fed . Make sure to monitor the key support and resistance levels to make informed trading decisions. Good luck with your trades!

Scalp SHORT – Bananas31🐻 Scalp SHORT – Bananas31
RSI is extremely overbought across the 15m, 1h, and 4h timeframes, indicating clear exhaustion in upward momentum. The 15m chart shows a strong bearish divergence, confirming weakening strength. Current price action suggests distribution, setting up a high-probability short-term correction.
🎯 TP: 0.002418
🛑 SL: 0.005375
📊 RR: 1 : 4.74
A clean short setup: concise, technically driven, and focused on multi-timeframe exhaustion signals.

AUDUSD bearish trend continuation below 0.6560The AUDUSD pair is currently trading with a bearish bias, aligned with the broader downward trend. Recent price action shows an oversold rally towards the resistance, suggesting a temporary relief rally within the downtrend.
Key resistance is located at 0.6560, a prior consolidation zone. This level will be critical in determining the next directional move.
A bearish rejection from 0.6560 could confirm the resumption of the downtrend, targeting the next support levels at 0.6480, followed by 0.6460 and 0.6440 over a longer timeframe.
Conversely, a decisive breakout and daily close above 0.6560 would invalidate the current bearish setup, shifting sentiment to bullish and potentially triggering a move towards 0.6580, then 0.6600.
Conclusion:
The short-term outlook remains bearish unless the pair breaks and holds above 0.6560. Traders should watch for price action signals around this key level to confirm direction. A rejection favours fresh downside continuation, while a breakout signals a potential trend reversal or deeper correction.
This communication is for informational purposes only and should not be viewed as any form of recommendation as to a particular course of action or as investment advice. It is not intended as an offer or solicitation for the purchase or sale of any financial instrument or as an official confirmation of any transaction. Opinions, estimates and assumptions expressed herein are made as of the date of this communication and are subject to change without notice. This communication has been prepared based upon information, including market prices, data and other information, believed to be reliable; however, Trade Nation does not warrant its completeness or accuracy. All market prices and market data contained in or attached to this communication are indicative and subject to change without notice.

ZECUSDT 4H#ZEC failed to break the resistance, and a price correction is expected toward the following targets:
🎯 $603.47
🎯 $572.92
🎯 $542.38
🎯 $498.88
🎯 $443.48
⚠️ Always remember to use a tight stop-loss and maintain proper risk management.

Gold Price Balanced Amid Heightened UncertaintyGold Price Balanced Amid Heightened Uncertainty
As the XAU/USD chart shows, last week gold prices fell sharply, interrupting the previous upward trend. This decline was driven by two main factors:
→ End of the US government shutdown. This is believed to have reduced short-term economic risks and lessened demand for gold as a “safe-haven” asset.
→ Hawkish statements from Federal Reserve officials, which lowered market expectations for rate cuts. This pushed up US Treasury yields, traditionally putting downward pressure on non-yielding assets like gold.
This week, the market is awaiting a wave of delayed US economic reports that were postponed during the shutdown, including:
→ Labour market data (Non-Farm Payrolls)
→ Inflation data (CPI)
These releases are expected to give traders greater clarity on the future trajectory of Fed interest rates.
Technical Analysis of XAU/USD
From a technical perspective, the price is currently trading at the intersection of two key lines:
→ Resistance line from the upper boundary of the descending channel originating at the all-time high. Buyers attempted to break through this level last week but were unsuccessful.
→ Support line from the lower boundary of the ascending channel, in place since early autumn.
Given the above, it is reasonable to suggest that:
→ the market is in a balanced position, with traders adopting a wait-and-see approach;
→ a breakout from the symmetrical triangle could indicate the direction of the next significant move in gold prices.
This article represents the opinion of the Companies operating under the FXOpen brand only. It is not to be construed as an offer, solicitation, or recommendation with respect to products and services provided by the Companies operating under the FXOpen brand, nor is it to be considered financial advice.

VeChain (VET): Waiting For Buyers To Overtake The ZoneVET is still sitting under the key zone we’ve been watching for a while now. Nothing changes until buyers reclaim that level — that’s the flip we need before looking for bullish continuation.
If we see a proper reclaim, we can start talking about a fresh trend forming and look for long setups. Until then, no rushing. Just waiting for price to show strength and secure that zone first.
Game plan remains the same — reclaim first, entries after.
Swallow Academy

Gold sell set upGold has dropped aggressively to a demand level and closed below 200 ema
.............................. how to trade it :-
#1 Wait for price to break with a full bear candle with volume spike
#2 wait for price to retest the demand
#3 wait for bearish rejection candle at demand or engulfing candle
If nun of the confirmation 👆 show on the price do not take the trade

Gold: 4000 Support TestGold extended yesterday’s correction today, showing a significant decline amid oscillatory pressure, with some support found near the $4,000 mark. After surging to a high of $4,101.76 yesterday, gold plunged sharply, and this downward correction has continued to gather momentum on the 18th.
Previously, a head-and-shoulders top pattern formed on the 4-hour chart of gold, indicating an inherent technical correction demand. Furthermore, the pullback from yesterday’s high created a clear short-term bearish pressure signal, and today’s decline represents a further digestion of these negative technical cues.
Currently, the market is in the phase of testing support near $4,000.If this level is breached, it may trigger a further pullback to the short-term buffer support at $3,980, with the key strong support at $3,950 requiring close attention.
If gold can stabilize above $4,000, it will most likely enter a range-bound consolidation phase.
The primary resistance above lies at $4,100, a critical pressure level amid the recent correction. A breakout above this level will require a significant increase in trading volume, making it quite challenging in the short term.
Sell 4060 - 4050
SL 4070
TP 4000 - 3990 - 3980
Buy 4000 - 4010
SL 3990
TP 4040 - 4050 - 4060

NAS100 Trade Set Up Nov 17 2025Price swept PDH and is pushing down towards 1h FVG which i will want to see tested before looking for a reversal back up. There is a daily FVG that will need to be filled this week at 25,800

BNBUSDT 12H#BNB is moving inside a falling wedge pattern on the 12H chart. If the price bounces from the support zone and breaks out above the wedge resistance, the potential upside targets are:
🎯 $1010.36
🎯 $1048.20
🎯 $1086.04
🎯 $1139.90
🎯 $1208.52
⚠️ Always remember to use a tight stop-loss and maintain proper risk management.

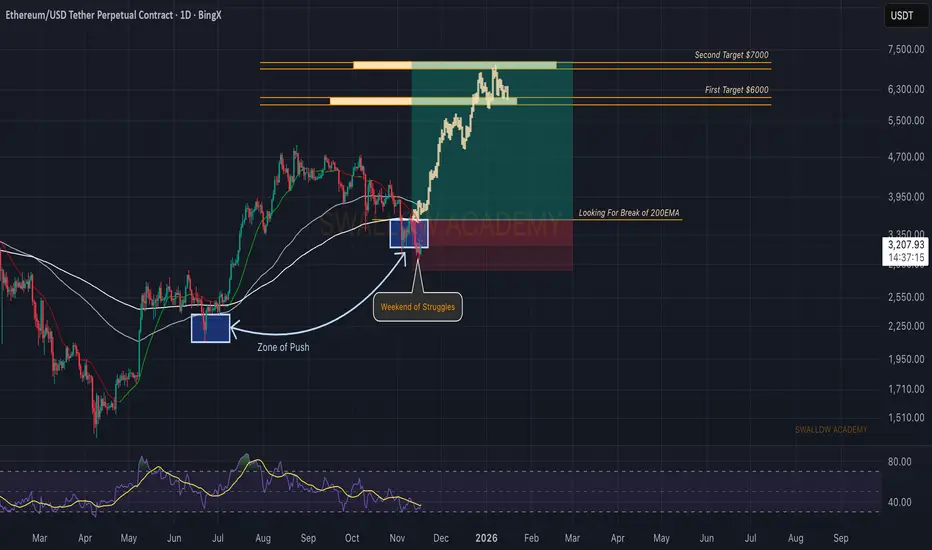
Ethereum (ETH): Weekend of Struggle is Over..........HopefullyThe start of a day looks pretty good for ETH, where buyers are showing dominance and forming MSB on smaller timeframes, which then could lead to bigger MSB on the current timeframe.
$3,240 is the zone we will be looking at for MSB to form; once we get that structure break, we will be aiming for 200 EMA to be reached and broken. (After that, we would be open to another set of long trades).
Swallow Academy
ETH PERPETUAL TRADE SELL SETUP Short from $3201ETH PERPETUAL TRADE
SELL SETUP
Short from $3201
Currently $3201
Targeting $3153 or Down
(Trading plan IF ETH
go up to $3252 will add more shorts)
Follow the notes for updates
In the event of an early exit,
this analysis will be updated.
Its not a Financial advic

NASDAQ Can the 1D MA50 give one more rally??Nasdaq (NDX) has been trading within a 6-month Channel Up and Friday saw the price breaking below its 1D MA50 (blue trend-line) and the pattern, but managed to close back above it for the 2nd time in a week (blue circles).
This resembles the September 02 break, which eventually also closed above it and initiated a +9.59% Bullish Leg. With the 1D RSI also testing a similar Support Zone with September's, we expect the index to initiate the new Bullish Leg, as long as it continues to close its daily candles above the 1D MA50.
Our Target is 26900 (+9.59%).
---
** Please LIKE 👍, FOLLOW ✅, SHARE 🙌 and COMMENT ✍ if you enjoy this idea! Also share your ideas and charts in the comments section below! This is best way to keep it relevant, support us, keep the content here free and allow the idea to reach as many people as possible. **
---
💸💸💸💸💸💸
👇 👇 👇 👇 👇 👇

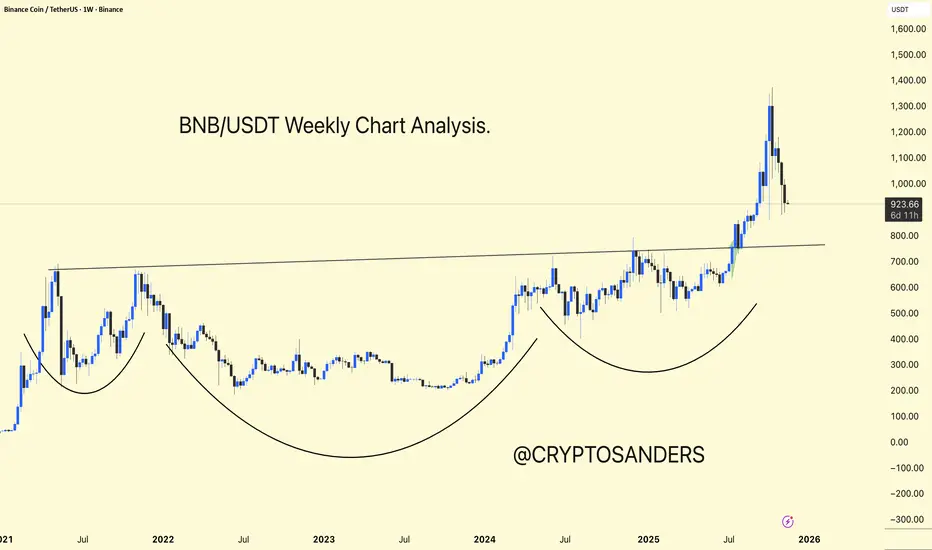
BNBUSDT Weekly Chart – Full AnalysisBNBUSDT Weekly Chart – Full Analysis
BNB is displaying a multi-year Inverse Head and Shoulders structure on the weekly chart, which is a bullish continuation pattern that indicates accumulation followed by a breakout.
Key Breakout: Horizontal resistance near $800 serves as a neckline for the pattern. BNB broke above this level with strong volume, confirming the bullish breakout and initiating a sharp uptrend.
Current Activity: After reaching above $1,300, BNB is currently retracing and testing the breakout area as support ($800–$900). This is a standard retest after a significant uptrend.
Bullish Scenario: If BNB holds $800–$900, a strong upward trend toward new all-time highs is likely, with targets potentially reaching $1,500 and above, measured using cup depth.
Bearish Risk: Losing the $800 neckline would invalidate the current breakout and could lead to a deeper retracement before another upward move.
BNB is in a strong long-term uptrend. After successfully breaking out of a massive cup-and-handle pattern, it is retesting support—a natural and healthy technical move. Holding above $800–$900 keeps BNB in a bullish setup, with further upside potential.
DYOR | NFA
XAU/USD | Gold Holding Strong – More Upside If Support Holds!By analyzing the #Gold chart on the 4H timeframe, we can see that after a pullback, the price climbed again to $4112 before making a small correction. It’s now trading around $4078.
If gold can hold above $4048, we can expect another move to the upside.
The next potential targets are $4106, $4112, $4133, and $4159.
Please support me with your likes and comments to motivate me to share more analysis with you and share your opinion about the possible trend of this chart with me !
Best Regards , Arman Shaban

One more Bullish Market pump before the dumpHold your horses bears. If price fails to hold above the previous peak we are likely going lower in USDT dominance which means one more bullish sweep of the crypto market before sweeping the extreme liquidity to continue the market dump afterwards.
