Dash long-term —Can it go higher?Looking at Dash, a privacy oriented Cryptocurrency-payment project based on Bitcoin's protocol, we want to answer one question only: Can it go higher?
Dash hit bottom mid-June 2025 then never looked back. It has been rising since.
The short answer is yes, it can continue growing. The long answer relates to the chart structure and recent price action.
The fact that the highest volume ever came in last month on a bullish candle supports additional growth. The fact that there is nothing even close to a test of lower support also supports higher prices. We have an uptrend here and even now the chart points toward a higher high, reaching a target of around $200 on the next move.
The high from November 2025 was $150, which means that $200 wouldn't be that much of a milestone. That is to say that even higher is possible in early 2026, say, around $300 and this is a much better target. This is the main level short- to mid-term.
Long-term, the uptrend is likely to remain intact and a new all-time high is also possible and highly probable. We are looking at a stop right at the previous ATH followed by $762. It is hard to put a date on the new all-time high. But keep $200 - $300 in mind, this is the range that will become active next.
Yes! Dash will continue growing. We have a very strong higher low. The candles from last week and this week both points to a bullish resumption and sustained growth in the coming months.
How high prices go will depend if the market stays bullish for 1 or 3 months. If one month, then the lower targets only; if 3 months, then all is possible.
Namaste.
Chart Patterns

EUR/USD – Breakout, Consolidation, Continuation ScenarioOANDA:EURUSD After the impulsive breakout from the prior consolidation, price accelerated higher and then transitioned into a tight corrective structure, resembling a bullish flag. This type of behavior signals momentum digestion rather than distribution. The market is not showing panic selling—just a controlled pause as short-term buying pressure cools off.
From a structural perspective, price has temporarily stretched away from short-term value. That alone increases the probability of a pullback, not because the trend is weak, but because healthy trends need to rebalance before continuation. So far, sellers have failed to produce any decisive breakdown, which keeps the bullish bias intact.
At this stage, the 1.1820 – 1.1780 zone stands out as the key support area. This region aligns with the base of the consolidation, previous demand, and the internal structure of the flag. If price rotates lower into this zone, I would still view that as a constructive retest within the broader uptrend, not a trend failure.
➡️ Primary scenario: consolidation breaks down → controlled pullback toward 1.1820 – 1.1780 for a structural retest before continuation.
⚠️ Risk scenario: strong acceptance above current highs → direct continuation toward 1.1950, with extension potential toward 1.2050.
For now, I see this as a pause before continuation, not a reversal. As always, the key is how price behaves at structure—not predicting, but reacting.
If this aligns with your view—or if you’re seeing something different—I’d love to hear your perspective in the comments.

GBPAUD PRICE OUTOOKFX:GBPAUD
Possible sell continuation on EURAUD, having my first and final targets @1.92541 and @1.91886 and my stop @1.93931
Though i'm also expecting GBPAUD to be bullish from these zone i highlighted, i'll keep you guys updated for a possible buy from those zone if price shows reactions from there.

EYES ON EURAUD.FX:EURAUD
lets see how price will reacts to our zones in the forth coming week.
first price target's @1.68252

EYES ON EURJPYFX:EURJPY
Price already shows rejection on that zone for a buy on the 4HR timeframe. lets see how price reacts to our zones in the forth coming week.
first price target's @182.120 and second target @183.002
I'll forfeit this buy when price breaks below 180.142

BTC bottonBTC Accumulation Plan for 2026
Personal chart featuring highlighted accumulation zones derived from historical Bitcoin market cycles
Green zones indicate promising entry points for long-term holding and accumulation up to 2026

ADAUSDTPrice has reached the bottom of the wedge, and now it’s time for it to move toward the top of the wedge. This move could take several months to complete.

USDMXN -33% & CRACKING!After 17 long years, the USD (down 33% from ATH) is about to start breaking down against the MXN.
I've been warning about FOREX $ pairs for a while now.
Tariffs (A-hole tax on Americans) aren't working as advertised. Making the peso great again. 💪😂
Lastly, I want to point out once again that the $ also affects cryptos. Why?
Since demand for the $ is down and people want out, why would they buy a risky BTC if all you can get back for it is a $? That nobody wants to begin with?
In other words. Since demand for the dollar is falling and people want out of it, why would they buy a volatile asset like Bitcoin if, at the end of the day, it’s priced in dollars? Why trade one unstable claim for another that’s even more unstable?
This is not always the case, so don't make this a rule. For now, the empirical data speaks for itself, and we cannot ignore it.
If you enjoy the work:
👉 Drop a solid comment
Let’s push it to 6,000 and keep building a community grounded in raw truth, not hype.

#GBPCAD: Intraday Buying Opportunity +400 Pips! Dear Traders,
I hope you’re doing well. We have a fantastic buying opportunity in the market. The sellers are exhausted and next week we’re likely to see a strong GBP showing a bullish continuation on the GBPCAD pair. There are two targets: the first is a take profit where we might encounter strong resistance. If the price rejects this resistance, it could experience a slight correction before completing it. This is where we’d hit our second profit target. If you like our idea, please like and comment. Also, remember to maintain an even stop-loss and take-profit ratio.
Regards,
SetupsFX_

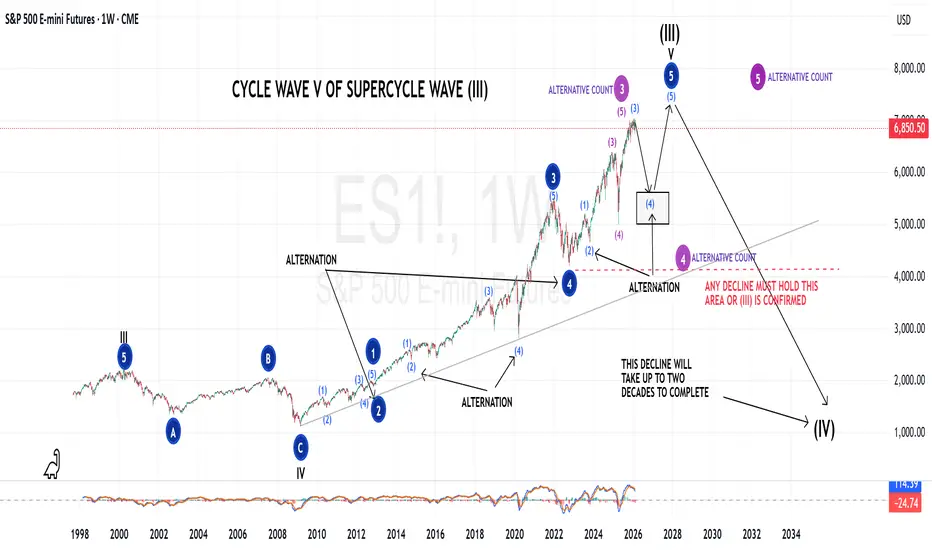
An Elliott Wave Schematic of a TopThis top we are imminently completing should be our intermediate (3), and therefore, I am expecting a (4) and (5) of primary 5 to complete an almost 100 year cycle.
Including purple ALT count.
XAUUSD Stop Hunt Completed – Liquidity Sweep Before Major Move? The recent XAUUSD price action suggests a classic stop hunt and liquidity sweep scenario. Price briefly broke below a key support zone, triggering sell-side liquidity and stop-loss orders from retail traders, before sharply reversing back into the previous range.
This move appears less like a true bearish breakdown and more like a liquidity grab engineered to fuel a larger directional expansion.
📌 What Happened?
Equal Lows Formed – Price created a visible support area where retail traders placed buy entries and tight stop losses.
Liquidity Sweep – Smart money pushed price below those lows, triggering stops.
Aggressive Rejection – Strong buying pressure immediately absorbed the sell orders.
Reclaim of Structure – Price moved back above the broken support, signaling potential bullish intent.
This pattern often signals accumulation rather than continuation.
🧠 Why This Matters for Gold Traders
In the forex market, liquidity drives momentum. A stop hunt provides the fuel required for institutions to build positions before a significant move.
For Gold (XAUUSD), this setup typically leads to:
🔹 Short squeeze potential
🔹 Strong impulsive expansion
🔹 Market structure shift on lower timeframes
🔹 Break of short-term resistance
If price continues to hold above the reclaimed level, the probability increases for a bullish continuation toward higher resistance zones.
📊 Technical Confluence
Key confirmations to watch:
Higher low formation on 1H / 4H timeframe
Break of minor lower high (structure shift)
Increasing bullish volume
Rejection wicks below swept liquidity
Failure to hold above the reclaimed support would invalidate the bullish scenario and could lead to deeper downside continuation.
🎯 Trading Perspective
Instead of chasing the initial breakout, patient traders wait for:
Pullback into imbalance / fair value gap
Confirmation candle (bullish engulfing or strong momentum close)
Clear risk-to-reward structure
Risk management remains critical — liquidity sweeps can occur in both directions.
📈 Conclusion
The recent XAUUSD move shows characteristics of a stop hunt completion, suggesting smart money may have accumulated positions before a larger expansion.
If bullish structure confirms, Gold could be preparing for a significant upside move. However, traders should monitor key levels closely for confirmation rather than anticipating direction prematurely.

US30 : Higher Lows Supporting Further UpsideThe arrows highlight a sequence of higher lows with price continuing to rotate upward after each pullback. Momentum remains constructive and dips are being absorbed rather than accelerating lower. As long as this structure holds, the short-term bias favours continuation to the upside.
Disclosure: We are part of Trade Nation's Influencer program and receive a monthly fee for using their TradingView charts in our analysis.

GRSE 1 year viewGRSE 1 year view 1 trade Minimum 50% gain . lets trade less and make more money per trade . wait and see till jan 2027

Doge: Trendline Break + Inverse H&SHI!
Market Context
Price has shifted structure after breaking the descending trendline while forming a clean inverse Head & Shoulders pattern. Momentum is gradually turning bullish as buyers step in above the neckline area.
Structure & Key Signals
Descending trendline -> Broken
Inverse Head & Shoulders -> Confirmed breakout
Higher lows forming -> Strength building
Scenario Outlook
As long as price holds above the broken trendline/neckline zone, continuation to the upside becomes the higher-probability scenario.
Target Zone 🎯
Primary target: 0.099 – 0.100
Invalidation
A move back below the neckline and trendline would weaken the bullish setup and shift price back into range conditions.

XAUUSD — Bullish Pause Before the Next ExpansionOANDA:XAUUSD Price is respecting the bullish structure exactly as expected. After the strong breakout from the descending channel, gold pushed impulsively higher and then transitioned into a mini-flag consolidation, signaling momentum digestion rather than distribution. The move stretched price away from short-term value, which naturally invited a pause as buying pressure cooled.
At this stage, the 5,000 – 4,960 zone stands out as the key support area. This region aligns with the base of the mini-flag and prior demand, making it a logical magnet if price fails to hold current levels. A controlled pullback into this zone would still be healthy within the broader uptrend and could set the stage for the next leg higher.
➡️ Primary scenario: consolidation fails → pullback toward 5,000 – 4,960 for a structural retest.
⚠️ Risk scenario: strong acceptance above the flag high → continuation toward 5,080 – 5,120 and potentially higher.
For now, I see this as pause before continuation, not reversal. If this view aligns with yours—or you see it differently—drop your thoughts in the comments. I’m keen to hear your perspective.

PIPPIN next target is more gain 14% toward 0.80$HI
after huge correction to the downside now some green candlesticks for continuing the process or reverse is logical i can see at least 14% gain toward 0.80$ for PIPPIN

BRIEFING Week #7 : Money starts to FlowHere's your weekly update ! Brought to you each weekend with years of track-record history..
Don't forget to hit the like/follow button if you feel like this post deserves it ;)
That's the best way to support me and help pushing this content to other users.
Kindly,
Phil

Best Price Action Pattern For Beginners in Forex Gold Trading
There are a lot of price action patterns:
wedges, channels, flags, cup & handle, etc.
If you're just starting out your Forex journey, it's natural to wonder which one to trade and focus on.
In this article, I will show you the best price action pattern for beginners that you need to start forex trading. I will share a complete trading strategy with entry, stop and target, real market examples and useful trading tips. High accuracy and big profits guaranteed.
The pattern that we will discuss is a reversal pattern.
Depending on the shape of the pattern, it can be applied to predict a bearish or a bullish reversal.
Its bearish variation has a very particular shape.
It has 4 essential elements that make this pattern so unique:
A strong bullish impulse,
A pullback and a formation of a higher low,
One more bullish impulse with a formation of an equal high,
A pullback to the level of the last higher low.
Such a pattern will be called a double top pattern.
2 equal highs will be called the tops ,
the level of the higher low will be called a neckline .
Remember that the formation of a double top pattern is not a signal to sell. It is a warning sign. The pattern by itself simply signifies a consolidation and local market equilibrium.
Your confirmation will be a breakout of the neckline of the pattern.
Its violation is an important sign of strength of the sellers and increases the probabilities that the market will drop.
Once you spot a breakout of a neckline of a double top pattern,
the best and the safest entry will be on a retest of a broken neckline.
Target level will be based on the closest support.
Stop loss will lie above the tops.
A bullish variation of a double top pattern is called a double bottom.
It is also based on 4 main elements:
A strong bearish impulse,
A pullback and a formation of a lower high,
One more bearish impulse with a formation of an equal low,
A pullback to the level of the last lower high.
2 equal lows will be called the bottoms ,
the level of the lower high will be called a neckline .
The formation of a double bottom pattern is not a signal to buy. It is a warning sign. The pattern by itself simply signifies a consolidation and local market equilibrium.
Your confirmation will be a breakout of the neckline of the pattern.
Once you spot a breakout of a neckline of a double bottom pattern,
the best and the safest entry will be on a retest of a broken neckline.
Target level will be based on the closest resistance.
Stop loss will lie below the bottoms.
Double top & bottom is a classic price action pattern that everyone knows. Being very simple to recognize, its neckline violation provides a very accurate trading signal.
Moreover, once you learn to recognize and trade this pattern, it will be very easy for you to master more advanced price action patterns like head and shoulders or triangle.
❤️Please, support my work with like, thank you!❤️
I am part of Trade Nation's Influencer program and receive a monthly fee for using their TradingView charts in my analysis.

BitcoinBTCUSD
- Demand Zone
- Break of Structure
- Completed " 12345 " Impulsive Waves and " ABC " Corrective Waves
- Change of Characteristics
- RSI - Divergence

Gold |XAUUSD . 30M -- Liquidity Reaction Trade1. Price swept previous liquidity near NY High and showed rejection from supply zone.
2. Market created a strong bearish displacement after liquidity grab.
3. structure shift (CHoCH) confirmed bearish bias on lower timeframe.
4. London and Tokyo session highs acting as resistance confluence.
5. Expecting downside move targeting NY low liquidity area.
Trade Zone (Sell Area)
• Near NY High / Supply Zone
• Around 5070 – 5085
• Area where liquidity was swept and bearish rejection appeared

XAUUSD 4H : Momentum Aligned to the UpsideThe arrows reflect sustained upside pressure, with bullish continuation legs forming after controlled pullbacks. Momentum indicators remain supportive, and price is expanding rather than stalling. The current structure favors continuation while higher lows remain intact, keeping short-term bias firmly positive.
Disclosure: We are part of Trade Nation's Influencer program and receive a monthly fee for using their TradingView charts in our analysis.

XRP Recovers —Daily MACD & RSI —Prepare for massive growthThe stop-loss hunt event, the final move from the correction has been recovered. From a low of $1.11, XRP is up 38%, now trading at $1.53, all within days.
Yesterday's session closed as a full green candle. It is as if the action after the 4th of February was deleted.
What to expect now, is this a bull trap? Are we set to experience lower prices right away?
Surely many people would say that a 38% move is more than enough, a dead cat bounce. Many people would call for a major bearish continuation, the forever down people—the eternal market crash. But, what about the chart?
Let me show you the daily MACD.
While you are seeing only a small portion, the reading reached recently was a true all-time low, the lowest ever. There is also a double-bottom and on top of that, a bullish cross. There is no going back now... XRP is going up.
XRPUSDT daily MACD:
When the RSI becomes overbought, the market tends to move down. This signal showed up around July 2025 and XRP did crash. See the daily RSI here:
When the RSI becomes oversold, the market tends to move up. This signal showed up recently and XRP is now moving up.
The overbought condition led to months of bearish action. The oversold condition can lead to months of bullish action, it works both ways.
XRP is bullish. The bullish move is only getting started. Prepare for massive growth...
Keep in mind, XRP does not move in isolation. Bitcoin, Ethereum, Cardano, Dogecoin, Polygon, Sui, Toncoin and the rest of the market will also grow, likely to new all-time highs.
Namaste.

USDCHF: Bearish Confirmation 🇺🇸🇨🇭
USDCHF will likely drop on Monday, following
a confirmed breakout of a support line of a bullish flag pattern
on a 4H time frame.
Expect a bearish movement to 0.7655 level.
❤️Please, support my work with like, thank you!❤️
I am part of Trade Nation's Influencer program and receive a monthly fee for using their TradingView charts in my analysis.
