Contains image

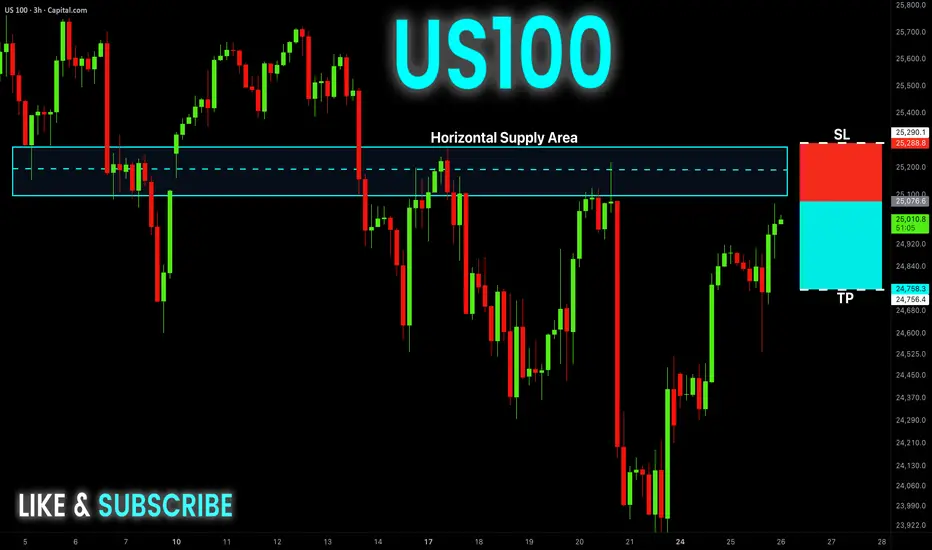
US100 Free Signal! Sell!
Hello,Traders!
US100 has swept internal liquidity and is now approaching the horizontal supply but hasn’t retested it yet. If the retest confirms distribution, SMC flow favors a drop toward the next sell-side liquidity zone.
--------------------
Stop Loss: 25,288
Take Profit: 24,756
Entry: 25,076
Time Frame: 3H
--------------------
Sell!
Comment and subscribe to help us grow!
Check out other forecasts below too!
Disclosure: I am part of Trade Nation's Influencer program and receive a monthly fee for using their TradingView charts in my analysis.
DXY FREE SIGNAL|LONG|
✅DXY has tapped the higher-timeframe demand and formed bullish displacement after clearing sell-side liquidity. A refined entry inside the mitigation zone aligns with algo order-flow targeting the buy-side liquidity above.
———————————
Entry: 99.773
Stop Loss: 99.641
Take Profit: 99.967
Time Frame: 2H
———————————
LONG🚀
✅Like and subscribe to never miss a new idea!✅

Is the market underestimating the AUDUSD rate differential?The odds for an interest rate cut by the US Federal Reserve on December 18th have seen a dramatic increase, jumping from approximately 40% to 70% in a major market reversal.
This sharp revision in market expectations is driven by mounting evidence of a slowing U.S. economy. Goldman Sachs Chief Economist Jan Hatzius cautioned that the U.S. economy may lose momentum faster than current projections anticipate. And today we got data from payroll processing firm ADP showing private companies lost an average of 13,500 jobs per week over the last four weeks.
Continued weak economic data is expected to keep weighing on the U.S. dollar. In contrast, the Reserve Bank of Australia is expected to keep a tighter stance relative to peers, and I don't know if markets are entirely pricing in a differential, with the recent up trend of the AUDUSD appearing to taper off.


DOGE 4H – MACD Liquidity Tracker Trend SetupThis DOGE 4H chart showcases how the MACD Liquidity Tracker Strategy performs when aligned with the dominant trend, using the exact settings backtested inside Quant Trading Pro.
Backtested Settings (via QTP):
Fast MA: 25
Slow MA: 60
Signal MA: 220
System Type: Normal
Trend MA: EMA 50 (VIDYA Volatility Length 9)
With this configuration, the Trend MA (grey line) acts as the primary directional filter. Every short generated by the MACD Liquidity Tracker occurred directly beneath the Trend MA and the descending resistance, producing clean, trend-aligned setups.
Momentum confirmation through the MACD histogram and signal line allowed each position to scale efficiently into TP1 and TP2, with several moves extending deep into liquidity sweeps. This highlights the core advantage of the system: pairing a trend filter with momentum shifts dramatically increases trade accuracy.
Although DOGE is bouncing off recent lows, price remains below both the Trend MA and the descending resistance line. Until those levels break, any rally into this zone may simply set up the next continuation short using the same QTP-backed settings.
A breakout above the Trend MA would signal the first potential shift in trend strength — but as long as price stays under it, bearish setups remain favored.


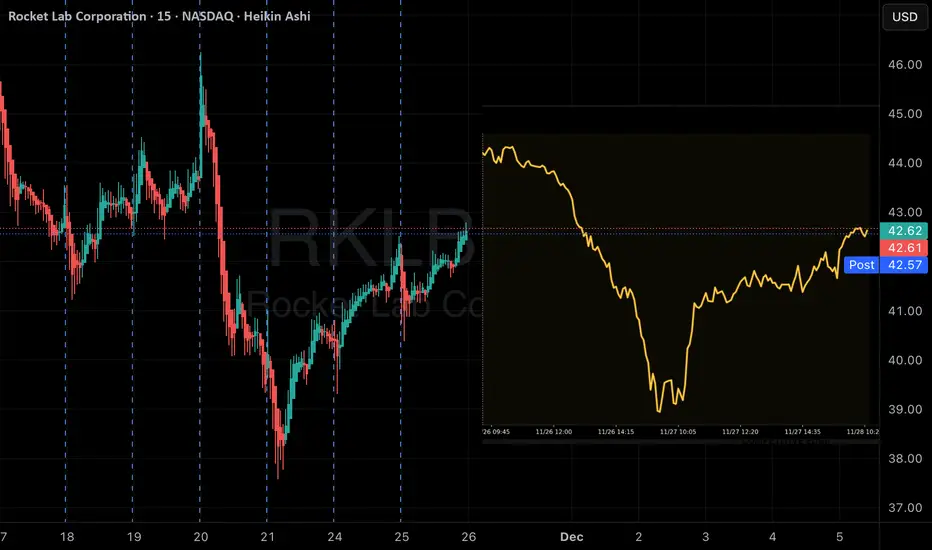
QuantSignals V3: RKLB Put Setup ActivatedRKLB QuantSignals V3 Weekly 2025-11-25
Ticker: RKLB
Signal Type: Weekly Short-Term Play
Direction: PUT (SHORT) — Contradicting Weekly Composite Guidance
Confidence: 60% (Moderate)
Current Price: $42.63
Entry: $0.29
Target 1: $0.58
Target 2: $0.87
Stop Loss: $0.15
Expiry: 2025-11-28 (3 days)
Weekly Momentum: BULLISH (+1.22%)
Options Flow: Neutral PCR 0.98, max OTM put volume indicates hedging
🧠 Key Technical & Chart Insights
Stock overextended at 87.3% of weekly range, RSI 90.3
Katy AI predicts sharp short-term decline (-14.73%) to $36.35 over 3 days
Support at $40.00, $39.00, $38.00; Resistance at $43.27
🎯 Trade Rationale
Katy AI’s high-precision 168-point prediction overrides bullish weekly composite score
Short-term reversal opportunity after +10.35% daily gain
Tight stop loss at $0.15 and conservative position size (2%) mitigate directional conflict
⚠️ Key Risks
Contradicts weekly composite bullish guidance (+2.0)
Moderate-high risk due to short 3-day horizon and potential news catalysts
Requires strict monitoring and potential scaling out at Target 1
First Bitcoin Super Cycle closingWe might be nearing the end of the first Bitcoin Super Cycle. There will be lots of volatility and fear among the retails. But on-chain observation shows that big players are storing coins on unprecedented levels.
What the next Super Cycle will be, can't tell. More data is needed in its beginning.
But financial institutions needs a more predictable, more controllable and most of all fixed cap assets. I am not talking about Bitcoin only, but in general about crypto currencies. There are interesting PoW projects that resembles Bitcoin, but has added extras like privacy and smart contracts.
But when time comes, crypto prices will skyrocket and there will be no corrections and no bear markets until the transitional period ends. Most retails will sell cheap and re-enter with more than 90% loss in coins.
It is NOT a financial advice.

ETHUSD 8H–EMA Trend Flip Retest, Will Supply Zone Reject Again?Ethereum is rallying into a major confluence zone following a confirmed bearish EMA trend flip, shown when the 50 EMA (yellow) crossed below the 100 EMA (purple). This crossover happened at the exact lower-high region inside the circled area, aligning with the break of structure that kicked off the broader downtrend.
Price is now rebounding from local lows and heading directly into the 3,200–3,350 supply zone — a region stacked with resistance: the descending trendline, the EMA cluster above, and the mid-range Fibonacci retracement levels. Historically, each retest of this zone has triggered strong sell pressure.
With Stoch RSI entering overbought conditions, ETH is reaching this resistance while momentum is cooling, increasing the probability of a bearish reaction. A rejection from the supply zone would put the next lower-low in play. A clean breakout — above both the EMAs and the trendline — would be the first early signal that buyers are attempting to reclaim structure.
Until that breakout occurs, the EMA cross keeps the bias firmly bearish.

Bitcoin and the US PresidentsDemocrats and Obama:
177,202,485.71%
GOP and trump 1.0:
5,192.94%
Let the plebs and paid influencers talk their way, but facts will be facts, always.
Why he wants to deregulate crypto now, we might only speculate. But Ross William Ulbricht is free, pardoned by Trump.
If the trust in cryptocurrencies is compromised, expect a deep ABC correction. ;)
It is not a political post, nor is intended to be interpreted like one. It is just market observing one.
Be safe. Protect Your money.
Cheers

Momentum Builds Amid Key Imbalance LevelsThe gold market maintains a decisive tone, with 4078 standing out as a key imbalance level yet to be resolved. Price action is positioning itself to respond, suggesting that a potential move is imminent as liquidity inefficiencies remain open. follow for more insights , comment and boost idea

In-Depth Bitcoin VolumeData is on the chart.
The single most important indicator is the Volume.
There are certain anomalies in the volume that can be attributed to wash trading in the beginning or the Covid.
As you can see, since the early cycles, volume in price discovery has been steady.
More importantly, the current volume in price discovery is still very low.
There are lots of talks about how some mythical players are accumulating. For 21M of issuance, the volume is huge, IMO.
!!! It is not trading advice, but an overview of the market in the past and the current situation.
I do not advise investing in highly volatile markets like crypto unless you are prepared to mark losses.
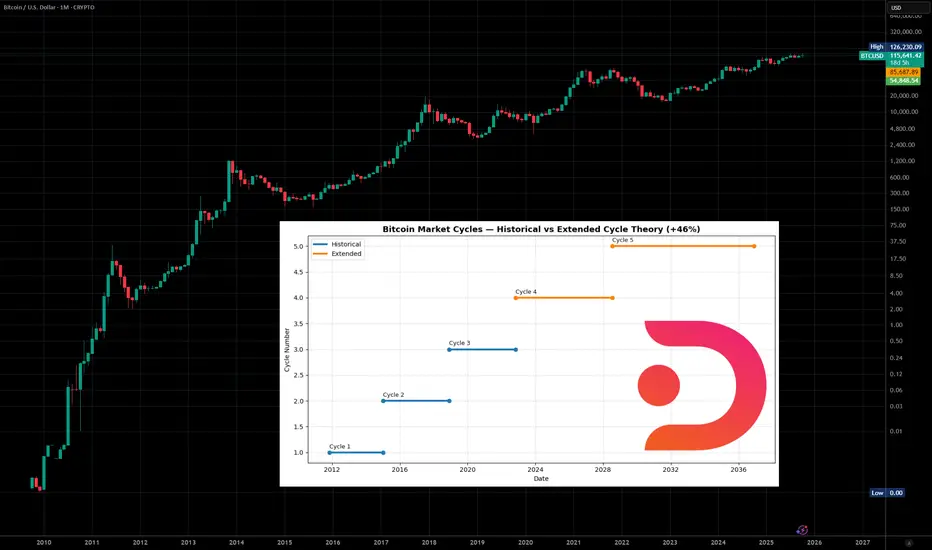
Decentralized-Trade Bitcoin extended cycle revisionINDEX:BTCUSD
Will it age like milk or wine?
...
Extended Cycle Theory Projection
Cycle 4 Top March 2026
Cycle 4 Next Bottom April 2028
Cycle 5 Top (estimated) ~2034–2035
Cycle 5 Next Bottom ~2036
The math behind it will be revealed elsewhere.
Do not trade based on the idea.
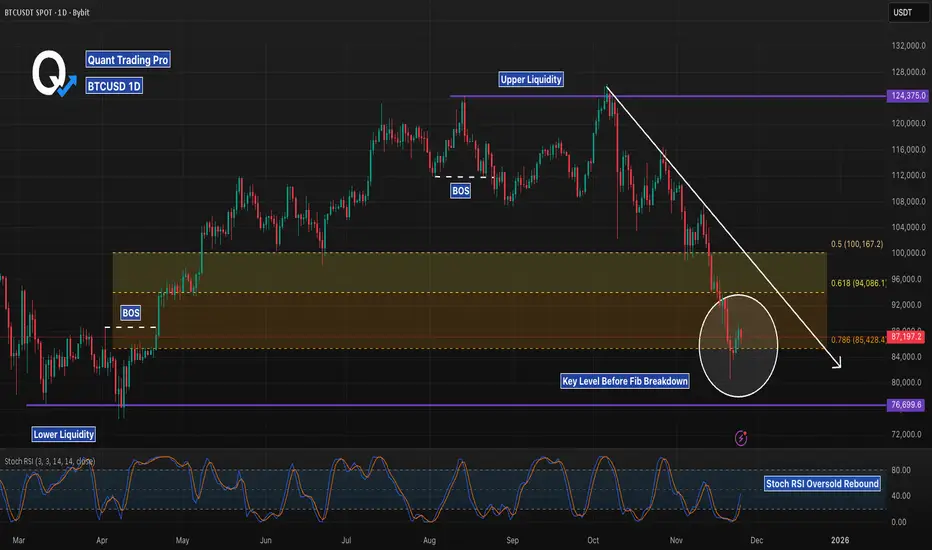
BTCUSD 1D – Testing 0.786 Support, But Is This a Real Reversal?Bitcoin has returned to a major higher-timeframe decision point: the 0.786 Fibonacci retracement, sitting inside a broad demand block that has already produced one sharp wick rejection. This zone combines three powerful confluences — a deep pullback level, prior accumulation structure, and proximity to sweeping lower liquidity from earlier this year.
Price broke structure twice on the way down, showing clear bearish momentum, but the current candle cluster suggests sellers are slowing as demand attempts to step in. A reclaim of the 0.618–0.65 range would signal strength and open the door for a revisit toward the mid-range around 100K. Failure to hold the 0.786, however, exposes the untested liquidity zone near 76.7K — a level that aligns with previous liquidity sweeps.
Stoch RSI is attempting a rebound from oversold territory, hinting at a possible short-term bounce, but trend context remains bearish until a confirmed BOS to the upside forms.
This is a pivotal zone for BTC — the next few daily candles will determine whether this is a macro higher-low or the beginning of a deeper breakdown.
MSTR Swing Watch: Bullish Momentum AheadMSTR QuantSignals Katy 1M Prediction 2025-11-25
Ticker: MSTR
Signal Type: 1-Month Short-Term Prediction
Direction: CALL (LONG)
Confidence: 63.8% (Medium conviction)
Current Price: $168.47
Entry: $168.47
Target 1: $171.25
Final Prediction: $171.95 (+2.07%)
30min Target: $172.28 (+2.26%)
Stop Loss: $165.94
Expected Move: +2.07%
Volatility: 46.9%
Trend: BULLISH
🧠 Key Technical & Chart Insights
Support/Resistance:
Support: $165.94
Resistance: $172.28
Trend Context: Short-term bullish momentum confirmed by Katy AI prediction and moderate confidence level.
Volatility: High implied volatility (46.9%) indicates potential for rapid movement within the 1-month horizon.
🎯 Trade Rationale
Entry at $168.47 aligns with Katy AI’s short-term bullish projection.
Stop Loss at $165.94 manages downside risk.
Target at $171.25–$171.95 provides ~2% potential upside.
Confidence moderate; position sizing should reflect risk tolerance.
⚠️ Key Risks
High volatility environment may trigger short-term swings.
Stop loss should be strictly followed to manage downside.
Market news and crypto sector sentiment may impact MSTR’s short-term trend.

AMD Alert: Bullish Reversal Opportunity Amid Sector DipAMD QuantSignals V3 Swing 2025-11-25
Ticker: AMD
Signal Type: Swing Options Setup (Expiry: 2025‑12‑12)
Direction: BUY CALLS
Confidence: 68% (Medium conviction)
Strike Focus: $210.00
Entry Range: ~$13.12
Target 1: ~$18.75
Target 2: ~$22.50
Stop Loss: ~$8.75
Horizon: 17 days
1W Move: -2.93%
2W Move: -6.86%
Volume vs Prior Swing: 1.7×
Swing Range: $194.28 – $217.13
Risk Level: Moderate-High — due to volatility
🧠 Key Technical & Chart Insights
Support/Resistance:
Support at $194.28
Resistance at $256.27
Oversold Condition: AMD down ~18.84% intraday, trading 9.4% below VWAP ($222.16), signaling potential mean reversion.
Momentum: Indicators show extreme bearish exhaustion; RSI likely in oversold territory.
Candlestick Patterns: No specific reversal patterns detected yet.
Trend Context: Overall sector bearish (SPY/QQQ moderately bearish), creating a contrarian swing opportunity for AMD.
📰 News & Market Context
News Sentiment: Mixed but leaning constructive
White House AI initiative (“Genesis Mission”) = long-term tailwind
Google-Meta deal concerns = short-term pressure
Options Flow: Bullish bias with PCR 0.54 and max volume at $350 call, signaling institutional optimism.
🎯 Trade Rationale
Entry Advantage: Stock at maximum fear phase after sharp single-session decline.
Timing: 17-day horizon aligns with Katy AI’s predicted 14–21 day recovery window.
Risk/Reward: Entry at $210 provides buffer below current price, 50–80% potential upside.
Position Size: Suggested 2.5% of portfolio, considering elevated volatility (VIX 20.19).
⚠️ Key Risks
Semiconductor sector sentiment may shift negatively.
High single-day volatility — stop loss adherence is critical.
Trade dependent on Katy AI’s predicted recovery timeline; monitor daily momentum and news catalysts.

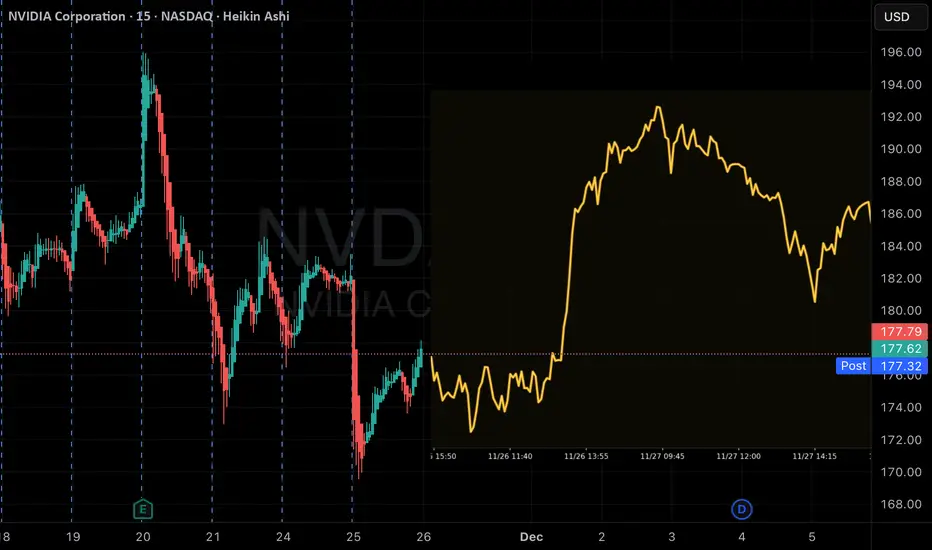
NVDA Weekly CALL Alert: Bullish Momentum + Extreme Options FlowNVDA QuantSignals V3 Weekly 2025-11-25
Ticker: NVDA
Signal Type: Weekly Options Setup (Expiry: 2025‑11‑28)
Direction: BUY CALLS
Confidence: 65% (Medium conviction)
Strike Focus: $177.50
Entry Range: ~$2.55
Target 1: ~$4.08
Stop Loss: ~$1.53
Weekly Momentum: Neutral (+0.59% 1W)
Options Flow / PCR: Bullish (PCR ~0.37)
Risk Level: Moderate — trending strength plus overbought indicators
🧠 Key Technical & Chart Insights
According to TradingView’s technical ratings, NVDA is currently neutral, with short‑term signals mixed and the 1‑week rating showing a prevailing buy trend.
TradingView
On the chart:
Price is trading around ~$176.71 in your system, above a recent support at ~$174.05.
Weekly momentum is neutral but 2‑week trend is bullish (+2.91%), suggesting underlying upward drift.
RSI is elevated (~72.1) and strength regime ~94.4%, which suggests trend heredity but also risk of pullback.
Key resistance zone near ~$184.56, and support near ~$174.05.
From published trade ideas on TradingView:
NVDA has faced a major resistance around ~$183‑185 region; a breakout above that could propel price higher, while failures may lead to pullbacks toward ~$165‑$175 zone.
TradingView
+1
Fundamental metrics show strong valuation: price‑to‑sales ~27.05 and EV/EBITDA ~45.58.
TradingView
+1
News & flow context: Despite some caution in sentiment (concerns about overvaluation, AI regulatory risk), the options flow (low PCR) signals institutional bullish bets.
🎯 Trade Rationale
The combination of strong trending regime + bullish options flow offers an edge for an upside trade.
Entry at $177.50 allows participation in breakout potential toward ~$183‑184, aligning with your target ~$4.08 (roughly +60% return) if the move plays.
Stop at ~$1.53 (~40% loss) balances risk/reward given moderate confidence.
The trade is time‑limited (3‑day expiry) — so timing and volatility matter.
⚠️ Key Risks & Watchpoints
RSI overbought and technical structure near resistance means upside is not guaranteed and may be limited if breakout fails.
If NVDA fails to hold support near ~$174, downside risk increases — especially given prior resistance around ~$183‑185.
The 3‑day expiry means time decay and implied vol shifts will heavily impact option premium.
News or sector rotation (e.g., semiconductor weakness, AI regulation) could trigger sharp reversal.
The neutral weekly momentum suggests strength, but not overwhelming strength — cautious size is warranted.
ADSK Earnings Alert: Katy AI Flags Bearish Reversal, PUTs FavoreADSK QuantSignals V3 Earnings 2025-11-25
Ticker: ADSK
Current Price: $296.45
Earnings Date: 2025-11-25 | EPS Estimate: $2.55
Signal Type: Earnings (V3)
Direction: PUT (Short)
Confidence: 60%
Conviction: Speculative
Trend / Momentum: Neutral-to-Bearish
Implied Move: 6.1%
🎯 Trade Setup
Strike: $290.00 PUT
Expiry: 2025-11-28 (3 days)
Entry Range: $1.10 – $1.50
Target 1: $2.20 (100% gain)
Target 2: $3.30 (200% gain)
Stop Loss: $0.65 (40% risk)
Position Size: 2% of portfolio
🧠 Key Insights
Katy AI overrides bullish composite, predicting drop from $296.45 → $293.18 (-1.1%), further pressure to $284.08 (-4.17%) by early Dec
Technicals: Resistance $297.50–$300, support $290; low pre-earnings volume (0.1× avg) indicates weak conviction
Options Flow: PCR 1.18 (slight put bias), max volume at $290 put suggests institutional downside protection
News Sentiment: Mixed — bullish price targets but reports of modest softness
Risk Level: High — earnings volatility and low pre-earnings volume make movement unpredictable
⚠️ Notes
Speculative trade; careful position sizing required
Monitor post-earnings gap risk
VIX at 20.19 → normal volatility regime; earnings may spike implied vol

BTSG next month/months bullishBTSG: betting it stays above $35/share. Doing some calls. Nothing fancy. Still cheap vs its peers, even after some solid upward momentum.

MSTR Downside Setup: Oversold Momentum + Extreme PCR Warns of Dr
Ticker: MSTR
Current Price: $173.42 (near weekly high)
Signal Type: Weekly (V3)
Direction: PUT (Short)
Confidence: 65%
Conviction: Medium
Weekly Momentum: BEARISH (-3.75% 1W)
Options Flow / PCR: Extremely bearish | PCR 7.23
Risk Level: Moderate
🎯 Trade Setup
Strike: $155 PUT
Expiry: 2025-11-28 (3 days)
Entry Range: $1.19 – $1.29
Target 1: $2.50 (110% gain)
Target 2: $3.20 (170% gain)
Stop Loss: $0.85 (30% risk)
Position Size: 2.5% of portfolio
🧠 Key Insights
Katy AI shows initial bearish pressure but ultimate bullish target at $173.42 — conflicting signals
Technicals: Oversold RSI at 14.5, trading near weekly low, support at $165.60, resistance $173–175
Options Flow: Heavy institutional put buying; unusual activity suggests strong short-term bearish conviction
News Sentiment: Mixed crypto outlook; recent Bitcoin/Ethereum moves provide some indirect support for MSTR
⚠️ Notes
Moderate risk due to Katy conflict — short-term bearish momentum dominates over delayed bullish AI target
Tight stops recommended; monitor recovery toward $173+ for potential reversal
