Why Manual Forex Trading Is Officially Dead 📘 Why Manual Forex Trading Is Officially Dead — And AI Will Bury It in 2026
________________________________________
1. 🚨 Executive Summary
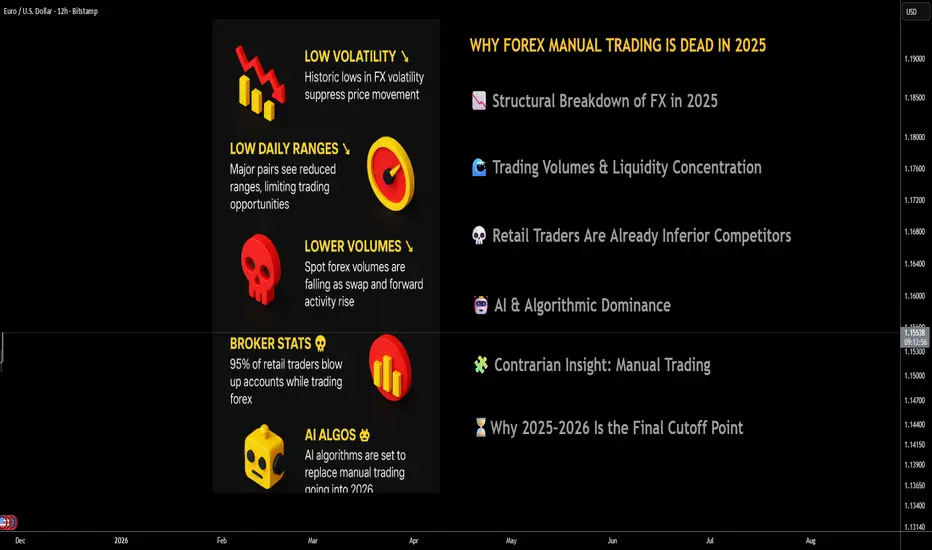
Manual FX trading is not merely declining—it is entering its terminal phase. As of 2025, the confluence of record-low volatility, crushed daily ranges, shrinking spot volumes, and hyper-efficient AI execution frameworks has dismantled the edge discretionary traders once possessed.
Regulators report that 74–89% of retail CFD/FX traders lose money, with internal broker statistics showing even higher failure rates—often pushing the informal industry estimate of 90–95% account blow-up rates. The structural market environment now exacerbates those figures: less movement, tighter spreads, and faster AI-driven price formation leave no oxygen for manual decision-making.
The verdict is clear: manual FX trading is no longer a competitive activity—it's an anachronism.
________________________________________
2. 📉 Structural Breakdown of FX in 2025: A Market That No Longer Moves
The fundamental requirement for profitable manual FX trading—price movement—has been suppressed. According to multiple 2023–2024 analyses (Reuters, BIS), FX markets entered a multi-year period of historically subdued volatility, with the CVIX (Currency Volatility Index) sitting near multi-cycle lows.
Major pairs like EUR/USD and USD/JPY are posting 1/3 to 1/2 of their historical daily ranges, compressing intraday opportunity. What used to be 80–120 pip swings are now 30–50 pip oscillations dominated by micro-structure noise rather than directional moves.
In this environment, manual traders have insufficient statistical runway to generate returns, while AI systems can still monetize tiny dislocations at millisecond speed.
________________________________________
3. 🌊 Trading Volumes & Liquidity Concentration: The Game Has Moved On
The 2022 BIS Triennial Survey already documented a shift: spot FX volumes stagnated while swap and forward activity increased, driven by hedging and treasury optimization rather than speculative flows.
By 2025, institutional venues show continued softness in spot volumes, and even the leading eFX platforms reported lower activity during prolonged volatility droughts. This matters because:
• Lower volume = fewer sustained directional trends
• More volume concentrated among algos = fewer exploitable inefficiencies
• Liquidity providers internalize flow before it ever becomes visible to retail charts
Manual trading can’t survive structural liquidity centralization reinforced by machine execution.
________________________________________
4. 💀 Retail Traders Are Already Inferior Competitors and the Data Shows It
Manual traders are not just competing against the market—they are competing against:
• Prime brokers running internal AI risk engines
• HFT firms reading order books at microsecond resolution
• Banks using reinforcement-learning execution algos
ESMA’s regulatory disclosures show 74–89% of retail FX/CFD accounts lose money, but internal broker studies often cite 90–95% destruction rates, especially when volatility is muted.
The brutal truth: manual traders blow up because the game is no longer designed for human reaction speed or intuition.
________________________________________
5. 🤖 AI & Algorithmic Dominance: The 2026 Regime Shift
By 2026, FX will be AI-first, not human-first. Institutional adoption of AI execution is growing double digits annually (per GMI, GrandView), and retail brokers are already rolling out AI-assisted trade generation, AI signal clusters, and AI risk models.
AI advantages include:
• Predictive ability using LSTM/transformers trained on terabytes of tick data
• Zero-latency execution across fragmented liquidity pools
• Ability to profit in low-volatility regimes via microstructure edge
• Adaptive models that rewrite themselves every 24 hours
• No fatigue, no bias, no emotional degradation
In contrast, manual traders operate on slow cognition, subjective pattern recognition, and outdated chart heuristics. This is not a fair fight. Manual trading is no longer a skill—it's an obsolete hobby.
________________________________________
6. 🧩 Contrarian Insight: Manual Trading Isn't Just Dying—It’s Being Engineered Out
Here are non-obvious, high-conviction insights that institutional investors should consider:
(1) Market makers WANT low volatility
Low volatility increases internalization efficiency and reduces hedging costs. Human traders thrive on chaos; AI thrives on order. Who does the system favor?
(2) AI reduces liquidity available to humans
Liquidity is increasingly “dark” inside internal matching engines, meaning price discovery happens before retail traders ever see the candle.
(3) Manual trading can’t survive the “fractionalization” of edge
AI doesn’t need large moves—it monetizes micro-micro-inefficiencies in ways humans never could.
(4) Spread compression kills human R:R ratios
With 0.1–0.3 pip spreads on majors, AI can scalp micro-spreads—humans cannot.
(5) Behavioral inefficiencies have been minimized
Classic manual strategies—breakouts, fib levels, candlestick patterns—worked because humans created predictable behavioral cycles.
Now? AI models detect and arbitrage those behaviors instantly.
The most contrarian conclusion?
Manual trading didn’t die naturally—the market evolved to eliminate it.
________________________________________
7. ⏳Why 2025–2026 Is the Final Cutoff Point
Three forces collide in this window:
1. Volatility compression (structure-driven, not temporary)
2. AI adoption exceeding human adaptability
3. Retail traders facing the worst statistical environment in 15 years
This is the first time in FX history where:
• Human intuition has zero measurable edge
• AI dominance is irreversible
• Market conditions structurally reject manual trading
The past cycles always argued “vol will return.”
In 2025–2026, that is no longer a credible investment thesis.
________________________________________
8. 📈 Implications for Investors & Brokers
Investors should allocate to:
• AI-driven FX funds
• ML-enhanced macro strategies
• Data infrastructure feeding predictive FX models
Brokers should:
• Pivot to AI-based trading tools
• Monetize analytics subscriptions
• Shift away from promoting discretionary trading education
The firms that expect a retail manual trading revival will be structurally misaligned with market evolution.
________________________________________
________________________________________
🔥 Final Conclusion: Manual Traders Will Be Left Behind in 2026
The logic is now overwhelming:
low volatility + low ranges + reduced volumes + AI dominance = endgame for manual FX trading.
Human discretionary trading cannot survive in a marketplace designed for—and increasingly ruled by—data-driven, sub-millisecond, self-learning AI engines.
Manual traders in 2026 will not fight the bots.
They will simply be trading inside a system architected by the bots, reacting slowly to patterns that no longer exist.
The era is over.
The market has moved on.
Contains image
I JUST noticed this potentially very bearish signal.Bitcoin.
I JUST noticed this potentially very bearish signal.
Practically every other time, it went down close to 60% after confirming this signal.
This would yield a $34000 target... Yikes!

GBPUSD: Buying Strength 🇬🇧🇺🇸
Today's London and NY sessions are strongly bullish for GBPUSD.
The pair successfuly violated a solid falling trend line on a daily.
It opens a potential for more growth now.
Expect a rise at least to 1.13192
❤️Please, support my work with like, thank you!❤️
I am part of Trade Nation's Influencer program and receive a monthly fee for using their TradingView charts in my analysis.

Alibaba Group Holding Limited ($BABA) Announced Q4 Earnings Alibaba Group Holding Limited (BABA) announces her earnings reports today before the bell. The stock is up 5% with RSI at 47 NYSE:BABA shares are eyeing the $200 resistant should bullish momentum increase.
In the news, Alibaba reported cloud computing revenue up 34% year-on-year in its fiscal second quarter, beating market expectations. Investors are focused on Alibaba’s cloud division which books its revenue related to artificial intelligence.
In September, the company said it plans to increase spending on AI models and infrastructure development, on top of the 380 billion yuan ($53 billion) over three years it announced in February. Alibaba said on Tuesday it has spent around 120 billion yuan in capital expenditure toward AI and cloud infrastructure over the past four quarters.
In 2024, Alibaba's revenue was 996.35 billion, an increase of 5.86% compared to the previous year's 941.17 billion. Earnings were 129.47 billion, an increase of 62.36%.
Analyst Summary
According to 13 analysts, the average rating for BABA stock is "Strong Buy." The 12-month stock price target is $187.31, which is an increase of 16.54% from the latest price.
About BABA
Alibaba Group Holding Limited, through its subsidiaries, provides technology infrastructure and marketing reach to help merchants, brands, retailers, and other businesses to engage with their users and customers in the People's Republic of China and internationally. It operates digital retail platforms under the Taobao and Tmall names; wholesale marketplaces through 1688.com and Alibaba.com; global e-commerce platform under the AliExpress name; e-commerce platforms under the Lazada, Trendyol, and Daraz names;

GBPUSD Massive Short! SELL!
My dear friends,
Please, find my technical outlook for GBPUSD below:
The price is coiling around a solid key level - 1.3156
Bias - Bearish
Technical Indicators: Pivot Points High anticipates a potential price reversal.
Super trend shows a clear sell, giving a perfect indicators' convergence.
Goal - 1.3121
About Used Indicators:
The pivot point itself is simply the average of the high, low and closing prices from the previous trading day.
Disclosure: I am part of Trade Nation's Influencer program and receive a monthly fee for using their TradingView charts in my analysis.
———————————
WISH YOU ALL LUCK

EURUSD Under Pressure! SELL!
My dear subscribers,
My technical analysis for EURUSD is below:
The price is coiling around a solid key level - 1.1563
Bias - Bearish
Technical Indicators: Pivot Points Low anticipates a potential price reversal.
Super trend shows a clear sell, giving a perfect indicators' convergence.
Goal - 1.1547
My Stop Loss - 1.1572
About Used Indicators:
By the very nature of the supertrend indicator, it offers firm support and resistance levels for traders to enter and exit trades. Additionally, it also provides signals for setting stop losses
Disclosure: I am part of Trade Nation's Influencer program and receive a monthly fee for using their TradingView charts in my analysis.
———————————
WISH YOU ALL LUCK

Gold 30-Min — Volume Sell Reversal Triggered⚡Base : Hanzo Trading Alpha Algorithm
The algorithm calculates volatility displacement vs liquidity recovery, identifying where probability meets imbalance.
It trades only where precision, volume, and manipulation intersect —only logic.
✈️ Technical Reasons
/ Direction — SHORT / Reversal 4134 Area
☄️Bearish rejection confirmed through sharp candle body.
☄️Lower-high forming beneath resistance supply region.
☄️Volume decreasing confirms exhaustion in price rally.
☄️Sellers regained imbalance with heavy top rejection.
☄️Algorithm detects fading demand and shift to control.
⚙️ Hanzo Alpha Trading Protocol
The Alpha Candle defines the day’s real control zone — the first battle of momentum.
From this origin, the Volume Window reveals where the next precision strike begins.
⚙️ Hanzo Volume Window / Map
Window tracked from 10:30 — mapping true market behavior.
POC alignment exposes institutional bias and breakout potential zones.
⚙️ Hanzo Delta Window / Pulse
Delta window monitors real buying vs. selling power behind each move.
Tracks volume aggression to expose who controls the candle — buyers or sellers.
When Delta aligns with Volume Map, momentum becomes undeniable.

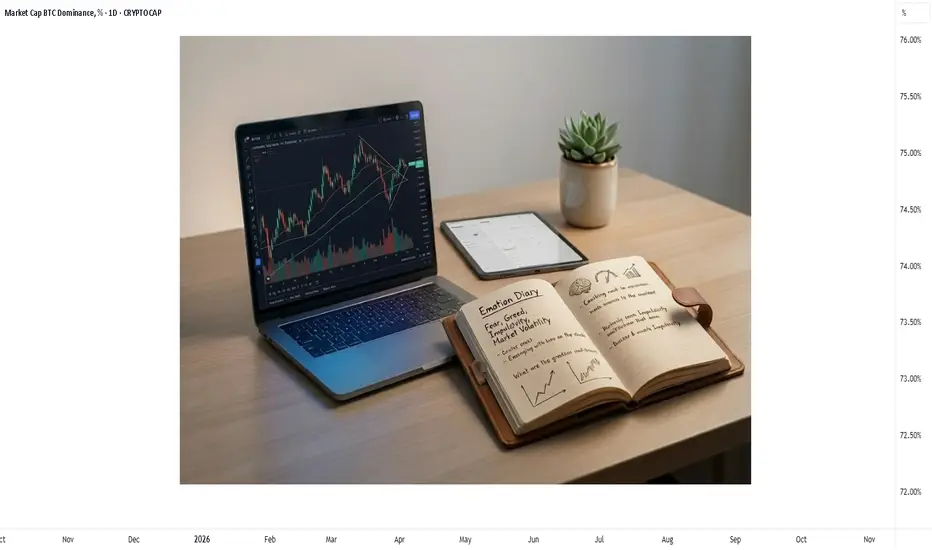
Diary of emotions: a detailed guide. Part 2Greetings, colleagues 😊
▫️The second part is about the " Diary of emotions " in trading
To compile such an observation table , you can use:
▪️ Excel - recommended for beginners. Using formulas to automatically calculate the frequency of emotions, R:R by condition, percentage of violations.
▪️ Notion - for advanced users. The ability to create databases, filter by date, tool, emotion, add comments and attach screenshots.
A text file (TXT) or "by hand" is a minimal format, but requires discipline. Suitable for those who do not use digital tools.
💡 Filling is required after each transaction.
*️⃣ The maximum allowed time for recording observations is 15 minutes after closing a position, as emotions become "blunted" as time passes and much becomes less obvious.
▫️If there are no transactions on the day, record: "Trading was not carried out" with an indication of the reason (for example, "lack of signal", "rest", "for health reasons").
▫️Skipping an entry violates the validity of the data - the diary loses its analytical value .
💡I also recommend conducting a weekly analysis
Every week (Sunday/Monday), a structured analysis of records from the previous week is conducted. The goal is to identify statistical patterns.
📍The analysis can be performed using the following metrics:
1. Emotion frequency: The number of entries for each category (calm, nervous, etc.). Determine which emotions are dominant.
2.Percentage of emotion violations: the number of violations in emotion X.
The total number of entries with emotion X × 100% is to identify which states most often lead to violations of the rules.
3.Average R:R under different conditions. The average risk/reward ratio for the "calm" vs "nervous" group. Evaluate how emotions affect the quality of risk management.
4. Average loss on triggers. The average loss on transactions where the trigger "previous loss" or "someone else's profit" is indicated. Assess the financial damage caused by emotional provocateurs.
The correlation between the condition and the result. Comparison of the percentage of profitable trades in a state of "calm" and "fear of loss." Identify the conditions under which the strategy works and under which it does not work.
Example of analysis: table
Conclusion:
Under the conditions of "nervous", "expectation of profit" and "fear of loss":
- violations of the rules occur in 67-100% of cases;
- R:R below 1:1;
- the average result is unprofitable.
Recommendation: do not trade in these conditions. The rule is introduced: "If I feel fear or expectation, I skip the deal."
💡 An emotion diary is not an independent strategy.
It is a component of the behavior management system and is integrated into the overall process.:
⚡️Trading Plan → Trading Journal → Emotion Diary → Weekly Analysis → Adjusting the rules → Updating the trading plan
It is especially important when:
- periods of loss of profit;
- repeated violations of the rules;
- reduction of discipline;
- attempts to increase the lot after a loss;
- feeling of "burnout".
📍 Mistakes when keeping a diary of emotions:
📍 The advantages of using an emotion diary
✔️ Conclusion
An emotion diary is not a therapeutic tool, but an analytical mechanism.
It does not require personality changes. It requires consistency, precision, and honesty.
It does not guarantee profit.
It ensures that any profit will be based on the system and not on chance.
Using an emotion diary is a prerequisite for a trader striving for sustained, repeatable, and objectively measurable performance.
An emotion diary does not replace a trade journal, but complements it.
Without an emotion diary, the analysis is limited to external parameters.
With a diary of emotions, the analysis becomes internal.
And only then does trading stop being a game. It becomes a process.
Leave your comments and 🚀 if the post was useful.
Profitable trades and emotion control 😊
Quick buy EURUSDafter breaking Tokyo high and following the buy program for the Higher time frame, im buying EURUSD to target the previous high on the Higher time frame

BITCOIN IS IN A TRIANGLE UNTIL THE END OF 2025: EVERYTHING WILL 📣 Hello everyone!
I bring to your attention my medium-term view until the end of 2025 within the framework of this Bitcoin trading idea solely from the point of view of TA and my understanding of the chart.
🔹 Briefly and to the point:
1️⃣ I believe that Bitcoin's growth in October will be limited and right now the price is already close to local highs.
2️⃣ I expect an unexpected, disappointing drop in the BTC price after the recent ATN upgrade to $125,000 at the beginning of the month.
3. Anyone who flew into a long breakout will be thrown out of the market, many will believe in the beginning of a bear market and prematurely open short positions.
4️⃣ In November-December, I expect another small wave of growth, which will push the price of BTC a little over $130,000
5️⃣ I expect big events for Bitcoin in Q1 2026, but more on that later.
That's all for today, I wish you good luck in making independent trading decisions and making a profit. Please analyze the information you receive from me, always think only with your head!
Goodbye! ✊

BTCUSD Next Selling Move AnalysisPrice is moving inside a clear downtrend, rejecting the trendline again. If bearish pressure continues, we can expect a drop toward the first target zone, and if that breaks, momentum may extend toward the second deeper target.
Sellers should watch for rejection candles near the trendline before entering.
❤️ please support with Boost and Comment I will be Very Thankful ❤️

BTCUSD Next Buying Move AnalysisPrice is sitting inside a strong demand zone.
If BTC breaks below this support, more downside can open.
But if it holds, expect a pullback toward the mid-resistance zone, and only a break above that can target the upper resistance.
Focus Levels
Support: Current lower pink zone
Resistance: Mid-zone + upper target zone
Trend: Bearish unless a strong reversal candle forms
Please kindly support with Boost and Comments.

Nifty Analysis EOD – November 25, 2025 – Tuesday🟢 Nifty Analysis EOD – November 25, 2025 – Tuesday 🔴
Expiry Day Bears Break Critical Support Zone
🗞 Nifty Summary
The Nifty opened with a 55-point Gap Up near the 26K level, but sellers immediately stepped in, causing an 81-point fall that filled the gap and marked the initial day low at 25,924.15.
The index successfully took support in the crucial 25940 ~ 25950 zone and rallied, briefly breaching the 26K and IBH levels. However, this breakout was rejected by the trendline resistance, confirming a fakeout. Nifty then hovered in a wide, choppy range within the Initial Balance (IB). Multiple attempts to reclaim 26K failed.
Around 2:15 PM, bulls gave up, leading to a sharp sell-off. The critical 25950 ~ 25940 support was instantly breached, along with the day low and IBL.
The market reached the next defined support zone at 25860 ~ 25840, precisely as aimed in yesterday’s note.
The day closed at 25,884.80, the lowest level of the session, wiping out the previous week’s gains. The bullish structure is now seriously threatened.
🛡 5 Min Intraday Chart with Levels
🛡 Intraday Walk
As expected, yesterday’s note and on the expiry day, the session was exciting and volatile, offering excellent two-sided opportunities for intraday traders.
The key event was the failure to sustain the breakout above 26K in the late morning, which exhausted the buyers. The late-session sell-off was decisive, signaling strong bearish conviction. The breach of the previous session’s critical support (25940) indicates a shift in momentum.
Now that the Previous Week’s Low (PWL) has been tested, a sustained break of today’s low will open the path immediately to the deep support at 25740 ~ 25715.
📉 Daily Time Frame Chart with Intraday Levels
🕯 Daily Candle Breakdown
Open: 25,998.50
High: 26,032.60
Low: 25,857.50
Close: 25,884.80
Change: −74.70 (−0.29%)
🏗️ Structure Breakdown
Type: Strong Bearish candle.
Range (High–Low): ≈ 175 points — moderate volatility.
Body: ≈ 114 points — reflecting steady selling pressure.
Upper Wick: ≈ 34 points — buyers attempted an early push, but sellers rejected higher levels.
Lower Wick: ≈ 27 points — slight buying interest near the lows but not enough to support the price.
📚 Interpretation
The close is a strong bearish signal, sitting near the day’s low and confirming the successful breakdown of the 25940 critical zone.
The inability of bulls to hold the gap-up and subsequent failure to hold 26K indicates clear distribution at upper levels. This structure suggests vulnerability for the immediate future.
🕯 Candle Type
Bearish Candle with Mild Lower-Wick Support — Sellers controlled the session decisively.
🛡 5 Min Intraday Chart
⚔️ Gladiator Strategy Update
ATR: 192.98
IB Range: 81.30 → Medium
Market Structure: Balanced
Trade Highlights:
09:53 Long Trade - Target Hit (R:R 1:1.2)
10:44 Short Trade - Target Hit (R:R 1:2.2)
13:25 Long Trade - SL Hit
14:24 Short Trade - Target Hit (R:R 1:3)
Trade Summary: The volatile, two-sided nature of the expiry day played perfectly into the strategy, capturing profitable trades on both the initial bounce and the final, decisive breakdown, proving effective in the balanced market structure.
🧱 Support & Resistance Levels
Resistance Zones:
25950 ~ 25940 (Immediate Resistance - Now broken support)
26000
26040 ~ 26075
26104
Support Zones:
25860 ~ 25840 (Current Base)
25740 ~ 25715 (Next Major Target)
🧠 Final Thoughts
“The bull structure is now dependent on 25840 holding.”
The decisive close in the 25860 ~ 25840 zone marks a significant bearish achievement. The bias for Wednesday is now firmly to the downside. We need to see if bulls can successfully defend this new base.
A clear move and close below 25840 will open the floodgates toward 25740 ~ 25715. For the bulls to regain control, they must reclaim and hold 25950 immediately.
✏️ Disclaimer
This is just my personal viewpoint. Always consult your
financial advisor before taking any action.

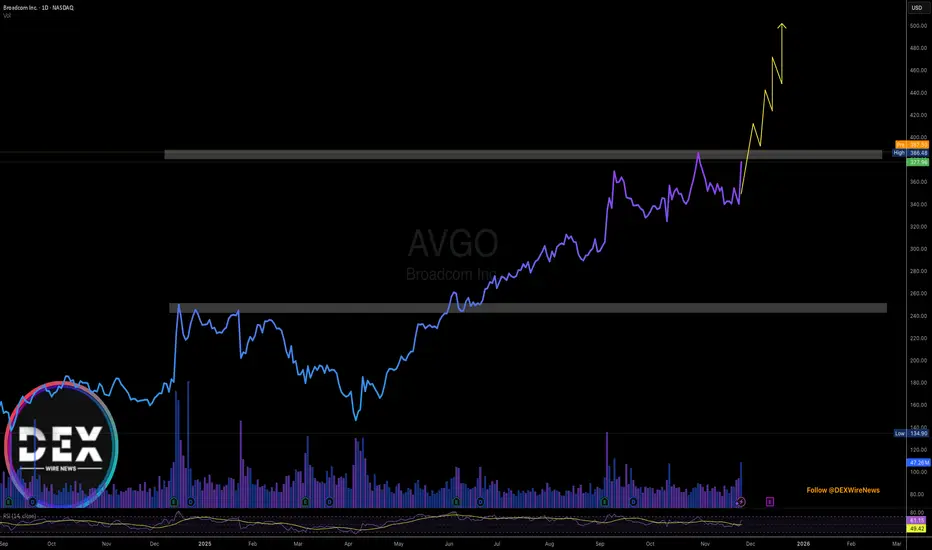
Breaking: Broadcom Inc. (AVGO) Surged 11% Yesterday Eyeing $500 Broadcom Inc. (NASDAQ; NASDAQ:AVGO ) shares saw a noteworthy uptick of 11% in extended market trading further extending the gains to todays premarket session up by 2.34%.
Should the stock break the ceiling of the $388 resistant zone, coupled with the RSI at 61, a bullish move to the $500 resistant is feasible and possibly $700 before the year runs out.
Similarly, failure to pull that stunt from NASDAQ:AVGO might resort to a move to the $250 support point.
With earnings slated for December 11th, 2025, In 2024, Broadcom's revenue was $51.57 billion, an increase of 43.99% compared to the previous year's $35.82 billion. Earnings were $5.90 billion, a decrease of -58.14%.
Analyst Summary
According to 28 analysts, the average rating for AVGO stock is "Strong Buy." The 12-month stock price target is $353.86, which is a decrease of -6.38% from the latest price.
About AVGO
Broadcom Inc. designs, develops, and supplies various semiconductor devices and infrastructure software solutions worldwide. The company operates in two segments, Semiconductor Solutions and Infrastructure Software. It provides Ethernet switching and routing custom silicon solutions, optical and copper physical layer devices, and fiber optic transmitter and receiver components; set-top box system-on-chips (SoCs), data over cable service interface specifications cable modem and networking infrastructure.
INTERVIEW: Hope phase - EXCAVO’s View 25/11/25
1. Do you believe the bear market has already begun? If yes - from what moment?
Yes. The bear market started in November 2025.
My cyclicality chart shows it clearly: not a single scenario points to continued upside.
Every chart I posted on TradingView confirms the trend reversal.
2. What was the main signal confirming the reversal?
The 153rd week of Bitcoin’s growth — a historic exhaustion point that almost always marks the end of a cycle.
3. What BTC levels are critical for the downside scenario?
The key horizontal level is $74,000.
At minimum, I expect a clean wick below it.
4. What fundamental factors accelerated the bear market?
A massive overbought environment.
The 2-year AI bubble pushed valuations far above fair value.
The market became overheated — even though AI is here to stay.
5. Technical factors confirming the decline?
We’re dropping without any real reason.
Any small headline triggers selling.
October 11 wasn’t about Trump — it was a whale manipulation on big exchanges.
That’s how late-stage cycles behave.
6. Why did most traders fail to see this reversal?
— Short memory
— Conditioned for 3 years to “buy every dip”
— No exit plan
— No clear framework
— And of course: they weren’t following EXCAVO 😉
7. Where could BTC go in the coming weeks?
First: liquidation of short positions.
We may even spike up to $94,000.
But that would be a trap before continuation downward.
In December, I expect the formation of one of the cycle bottoms.
8. Which scenario seems more likely — panic drop or step-by-step bleed?
Most likely: a step-by-step bleed.
9. Is a fake bounce possible before further decline?
Yes. I already mentioned it: a short squeeze → then a big drop.
Practical Part
10. What are you personally doing in this market?
I’m waiting.
Observing.
Studying.
You don’t need to be in a trade every day.
Overtrading destroyed more traders than any correction.
11. What should beginners do now?
Exactly what professionals do: wait for their entry point.
We’re hunters in the bushes — we shoot only when the target is close.
12. What should traders revise in their strategy right now?
— Understand where we are in the macro cycle
— Identify what’s working
— Remove what’s not
— Accept that the bear market will be long and exhausting
Right now we’re in the hope phase.
Disappointment is ahead.
Best regards EXCAVO
If you have any questions, feel free to ask. In the next post, I can do another interview based on the questions you leave under this one.
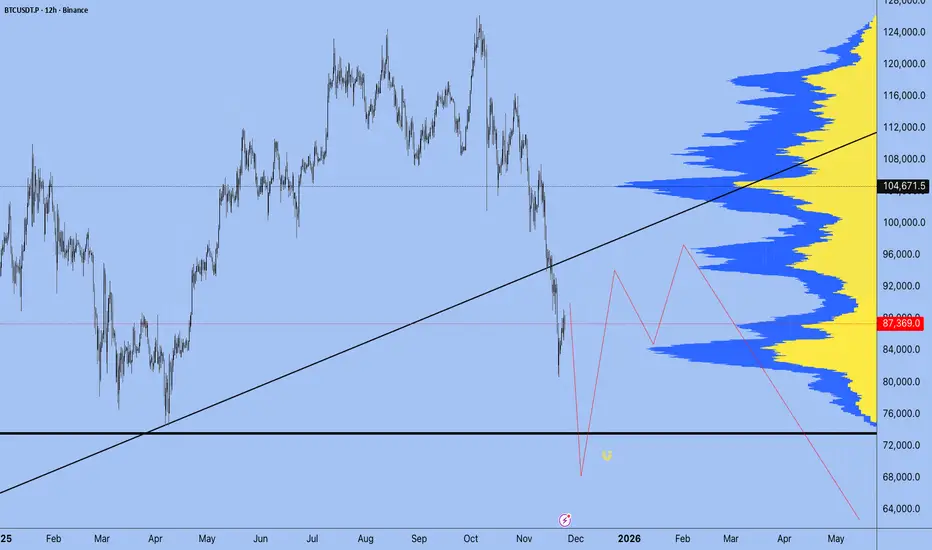
Bitcoin: The ATH Was a Trap. Here's the Real Roadmap.Since mid-July, Bitcoin has been in a global range. The "breakout" to a new ATH on Oct 5-6, which the majority expected to continue, was actually a liquidity sweep . This has confirmed the global range and a high probability of a high-timeframe correction.
After the sharp drop on the Oct 10 news, a local range has formed. I expect a breakdown from this local range, with the minimum target being a sweep of the Previous Month's Low (PML) .
After that, the plan is to look for long-term long setups at three key global support levels.
SCENARIO 1: 50% Monthly Fib Level
The first major support is the 50% Monthly Fibonacci retracement level . If price reaches this level and also performs a liquidity sweep of the June 22 low , the probability of a long setup will be much higher.
Confirmation: Price must find acceptance above this level, confirmed by Daily or Weekly candle bodies .
Target: Mitigation of the global and local ranges.
SCENARIO 2: 78.6% Monthly Fib + Weekly OB
If the 50% level is broken, the next major support is the 78.6% Monthly Fib level in conjunction with a Weekly Order Block .
Confirmation: The interaction must be analyzed with D1/W1 candles. Acceptance above this level confirms the long setup.
SCENARIO 3: The "Make-or-Break" Level
A break of the 78.6% level opens the door to the April 7 low at $74,500 . The market's reaction to this final level will determine whether the bull cycle has a chance to continue, or if a new bear cycle will begin.
~~~~~~~~~~~~~~~~~~~~~~~~~~~~~~~~~~~~~~~~~~~~~~~~~~~~~~~~~~~~~~~~~
The principles and conditions for forming the manipulation zones I show in this trade idea are detailed in my educational publication, which was chosen by TradingView for the "Editor's Picks" category and received a huge amount of positive feedback from this insightful trading community. To better understand the logic I've used here and the general principles of price movement in most markets from the perspective of institutional capital, I highly recommend checking out this guide if you haven't already. 👇
P.S. This is not a prediction of the exact price direction. It is a description of high-probability setups that become valid only if specific conditions are met when the price reaches the marked POI. If the conditions are not met, the setups are invalid. No setup has a 100% success rate, so if you decide to use this trade idea, always apply a stop-loss and proper risk management. Trade smart.
~~~~~~~~~~~~~~~~~~~~~~~~~~~~~~~~~~~~~~~~~~~~~~~~~~~~~~~~~~~~~~~~~
If you found this analysis helpful, support it with a Boost! 🚀
Have a question or your own view on this idea? Share it in the comments. 💬
► Follow me on TradingView for timely updates on THIS idea (entry, targets & live trade management) and not to miss my next detailed breakdown.
~~~~~~~~~~~~~~~~~~~~~~~~~~~~~~~~~~~~~~~~~~~~~~~~~~~~~~~~~~~~~~~~~

KMEW CMP 2828.After making CUP & HANDLE pattern stock trading in consolidation mode. This type of tight range sttructure shows strenth in price.Possible we can see a rally soon and it can male a new high in coming days

EU HnLFresh ASIAH, maybe a chance for quick Bullish reversal (possible W formation at support line)for DXY before continuing the journey down to re-test 100.00

Nifty IT IndexThe Nifty IT Index, emerging from consolidation, needs to close above the 38,380-38,400 range for strong momentum.

NZDCAD: Move Down Ahead 🇳🇿🇨🇦
NZDCAD is trading in a downtrend on a daily.
After updating a new low, the price bounced to a significant
resistance based on a falling trend line and a horizontal structure.
Odds are high that the pair will drop from there.
Expect a drop to 0.787 level.
❤️Please, support my work with like, thank you!❤️
I am part of Trade Nation's Influencer program and receive a monthly fee for using their TradingView charts in my analysis.

TradeCityPro | XRP Bulls Eyeing Key Support for Surge👋 Welcome to TradeCity Pro!
In this analysis, I want to review the XRP coin, one of the oldest cryptocurrencies, with a $124 billion market cap, currently ranked 4th on CoinMarketCap.
⏳ 4-Hour Timeframe
After the recent market decline, XRP was one of the coins that managed to recover well. It was supported at 1.8733, and with the activation of the 2.0383 trigger, the price made an upward move.
✔️ Currently, the price is at a very important support zone, and as you can see, it is reacting to this level.
💥 The RSI oscillator has moved close to the overbought zone. If it enters this zone, the momentum of this coin will increase significantly, and the price could continue its bullish movement, potentially reaching higher levels.
✨ If the support zone holds, we can open a long position.
For a more accurate trigger, it's better to wait until the price touches this level a few more times and then activate the trigger.
🔔 The next resistance zones for XRP are 2.3404 and 2.5508, which can be used as targets.
The main trigger for confirming the bullish trend on higher cycles will be the break of 2.5508.
🔍 If the price gets rejected from this level and moves back toward 1.8733, we can open a position if volume starts to increase, using a candlestick setup. Otherwise, we can enter with a break of 1.8733.
📝 Final Thoughts
Stay calm, trade wisely, and let's capture the market's best opportunities!
This analysis reflects our opinions and is not financial advice.
Share your thoughts in the comments, and don’t forget to share this analysis with your friends! ❤️

The Magnificent Seven - A Great Victory with High CasualtyCME: Micro E-Mini S&P 500 ( CME_MINI:MES1! )
The “Magnificent Seven” are the darlings in the U.S. stock market. The seven High-Tech stocks, including Nvidia NASDAQ:NVDA , Apple NASDAQ:AAPL , Tesla NASDAQ:TSLA , Microsoft NASDAQ:MSFT , Google NASDAQ:GOOGL , Meta NASDAQ:META and Amazon NASDAQ:AMZN , are up roughly 21% year-to-date as a group. Together they represent 34-37% of the market capitalization of the entire S&P 500 index.
Meanwhile, the remaining 493 companies in the S&P 500 returned just 12% YTD. Altogether, the S&P 500 index has a YTD return of 13.5% as of November 24th.
During the stock market bull run driven by A.I., a high concentration of the “Mag 7” could generate better returns. An investor could buy the MAGS Magnificent Seven ETF, which invests 100% in the “Mag 7” only. MAGS has a YTD return of 21.0%. A more aggressive investor could play his bet in Direxion Daily Magnificent 7 Bull 2X Shares ETF. This fund aims to replicate twice the return of the “Mag 7” and yield 29.0% YTD.
Minding the Risk of Mag 7 Casualty
The nickname “Magnificent Seven” came from the 1960 American Western. In the plot, a gang of bandits periodically raids a poor Mexican village for food and supplies. The farmers turn to gunslinger Chris Adams for help. Chris assembles a group of seven warriors to fight the gang. They eventually defeat the bandits and save the village.
The Magnificent Seven is my favorite Western movie. The gun fight led by Yul Brynner and Steve McQueen is legendary. And the Oscar-winning theme song is still playing in many grand ceremonies these days.
The analyst who coined the term for the stocks may also be a big fan of the movie. However, he only saw the great victory but overlooked its heavy toll. Four out of the seven warriors perished in the final fight.
A question for today: Could all seven stocks be winners to the end?
In past technological breakthroughs, many big players did not survive, even if they were market leaders at some point and technology did prevail eventually:
• In the Railway boom of the mid-1900s, thousands of railroad companies were formed. At least 300 were listed in the New York Stock Exchange. And 99% of them went bankrupt once the industry consolidated.
• In the automobile boom of the early 1920s, over 600 car makers were founded, and only 30 of them were still operational by the 1930s. And the eventual victors were the Big Three in Detroit.
• In the Internet boom of the 1990s, thousands of startups popped up. And 80% went bankrupt when the dotcom bubble burst in 2000.
• Since Tesla was founded in 2003, over 100 electric vehicle companies were founded. Dozens already folded after burning through cash and not generating sales.
We are seeing the same pattern repeating in renewable energy (solar and wind), computer chips, and now in A.I. startups too. Taken from historical lessons, investing in individual stocks in any transformational new technology sector is highly risky. The leading man could be sidelined as soon as a newer version of the technology comes through.
I have no doubt that A.I. is our future. I just don’t know which of the Mag 7 will survive to the end to collect their $20 payout from the Mexican farmers.
Investing in Micro E-Mini S&P 500 Futures
If an investor is bullish on A.I. but mindful of the single-stock risk exposure, he could explore the CME Micro E-Mini S&P 500 Futures.
The MES contracts offer smaller-sized versions of CME Group’s benchmark S&P 500 futures (ES) contracts. Micro futures have a contract size of $5 times the S&P 500 index, which is 1/10th of the E-Mini contract.
Micro contracts are very liquid. CME Group data shows that 2,349,680 contracts were traded last Friday, November 21st. Open Interest at the end of the day was 298,556.
Buying or selling 1 MES contract requires an initial margin of $2,262. With Monday closing price of 6,677.75, each March 2026 contract (MESH6) has a notional value of $33,388.75 (= 6677.75 x 5). Compared with investing in stocks, the futures contracts offer a built-in leverage of about 14.8 times (=33388.75/2262).
Hypothetically, if S&P futures price rises 10% to 7,012, the price gain of 668 points will translate into $3,340 (= 668*5) in profit for a long position, given each index point equal to $5 for the Micro contract. Using the initial margin of $2,262 as a cost base, the trade would produce a theoretical return of 147% (=3340/2262).
The risk to long Micro S&P is that the US stock market correction continues to deepen. To limit the downside risk, a trader could set up a stop-loss when entering a long position.
For illustration, a trade executed a long trade at 6,680 could be combined with a 6,300 stop. If the S&P falls to 6,000, the trader’s position will be liquidated well before that. The maximum loss would be $1,900 (= (6680-6300) * $5).
Happy trading.
Disclaimers
*Trade ideas cited above are for illustration only, as an integral part of a case study to demonstrate the fundamental concepts in risk management under the market scenarios being discussed. They shall not be construed as investment recommendations or advice. Nor are they used to promote any specific products, or services.
CME Real-time Market Data help identify trading set-ups and express my market views. If you have futures in your trading portfolio, you can check out on CME Group data plans available that suit your trading needs www.tradingview.com

EURGBP On The Rise! BUY!
My dear friends,
My technical analysis for EURGBP is below:
The market is trading on 0.8785 pivot level.
Bias - Bullish
Technical Indicators: Both Super Trend & Pivot HL indicate a highly probable Bullish continuation.
Target - 0.8807
About Used Indicators:
A pivot point is a technical analysis indicator, or calculations, used to determine the overall trend of the market over different time frames.
Disclosure: I am part of Trade Nation's Influencer program and receive a monthly fee for using their TradingView charts in my analysis.
———————————
WISH YOU ALL LUCK
