XAUUSD Technical OutlookWhat I see!
XAUUSD Technical Daily Outlook
Gold (XAUUSD) is forming a falling wedge after the sharp drop from the 3,430s high - - a structure that often signals a potential bullish reversal.
Price is consolidating inside the wedge, rejecting from the Daily FVG while holding the H4 demand zone at 3,320. A break above the wedge trend-line could spark an impulsive move toward the 3,375 BSL, with further upside into 3,439 if liquidity is cleared.
The wedge has already completed five legs, adding confluence for a possible breakout soon. Conversely, failure to hold 3,320 may invite deeper retracement before bulls re-enter.
This chart is presented for educational discussion of market structure and technical patterns only. It is not a trade signal or financial advice.
Learn before earning!
Contains IO script

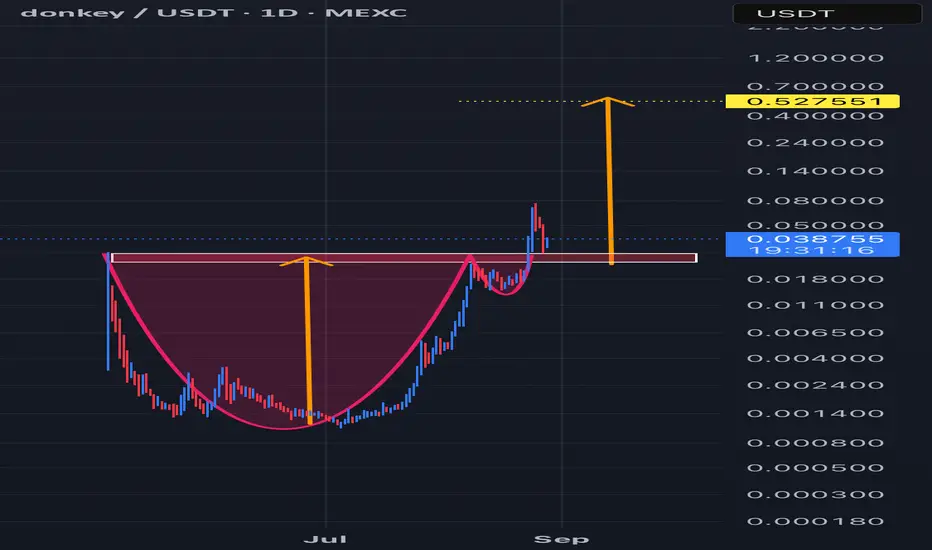
Sonic Consolidates at Point of Control With Eyes on $0.50Sonic (SUSDT) is trading at the point of control of its current range, a region in confluence with the 0.618 Fibonacci and value area low. Sonic’s reaction here could set the tone for its next move.
Sonic has been consolidating around a major support cluster for an extended period. This region, which aligns with the point of control, the 0.618 Fibonacci retracement, and the value area low, has acted as a structural base. If this zone holds, it creates conditions for a rotation higher, with the $0.50 level emerging as the next technical target.
SONIC Price Technical Points:
- Point of Control Support: Sonic is holding at the POC in confluence with the 0.618 Fibonacci and value area low.
- Volume Profile Foundation: Prolonged trading in this region has built significant volume support.
- Upside Objective: A breakout from the current channel could accelerate toward $0.50.
Main Analysis:
Sonic’s current price action reflects a prolonged period of accumulation within its trading channel. The point of control, which represents the most actively traded volume level, has emerged as a pivotal area. Combined with the 0.618 Fibonacci retracement and value area low, the region highlights a strong confluence of support.
From a structural standpoint, this setup favors continuation higher once momentum returns. A breakout from the current channel would serve as the catalyst for a bullish expansion, with the $0.50 level representing the next logical upside target. However, the sustainability of such a move will rely heavily on market participation.
The volume profile confirms this dynamic. While Sonic has established a strong base through extended consolidation, a surge in bullish inflows will be required to validate the next rotation upward. Without volume confirmation, price could remain range-bound, delaying the breakout despite strong technical foundations.
What to expect in the coming price action:
If Sonic defends its current confluence zone and volume inflows increase, a breakout toward $0.50 becomes the most probable scenario. Failure to generate demand would risk continued consolidation within the range.

Bitcoin Tests Key Support as Market Eyes $132,000 TargetBitcoin (BTC) is testing its 0.618 Fibonacci retracement, a region in confluence with VWAP-SI support and the range-low channel. Bitcoin’s reaction here could define its path toward $132,000.
Bitcoin has reached a pivotal inflection point, consolidating around one of its most significant technical supports. The current zone aligns with the 0.618 Fibonacci retracement, VWAP-SI support, and the range-low boundary of its higher trend channel. Holding this region will be crucial, as a defense could set the stage for an aggressive push higher.
BITCOIN Price Technical Points:
- Critical Support Cluster: Confluence of 0.618 Fibonacci, VWAP-SI support, and channel range low.
- Structural Pivot: Holding this level maintains the bullish channel and uptrend momentum.
- Upside Target $132,000: A defense here opens the probability of rotation toward new all-time highs.
The confluence of Fibonacci retracement, VWAP-SI support, and channel structure makes the current support level one of the most important in Bitcoin’s recent history. Each of these indicators individually holds technical weight, but when aligned together, they form a region of strong demand. This makes the next few daily and weekly closes especially significant.
If Bitcoin can hold this zone, it would establish another higher low within the broader bullish channel. This would reinforce the market’s existing structure and provide a springboard for continuation. Conversely, a failure to defend this cluster would weaken the higher trend channel and shift focus toward deeper supports, undermining the bullish case in the short term.
The upside target for a successful defense lies at $132,000, where the next high-time frame resistance has been marked. This level represents not just a psychological milestone but also a structural cap aligned with Fibonacci extensions. Testing this region would effectively mean Bitcoin breaking into uncharted territory, further cementing its bullish trend.
What to expect in the coming price action:
If Bitcoin holds the confluence support on a closing basis, the probability of a rotation toward $132,000 increases substantially. Losing this region would threaten the bullish channel and open the door to corrective downside.

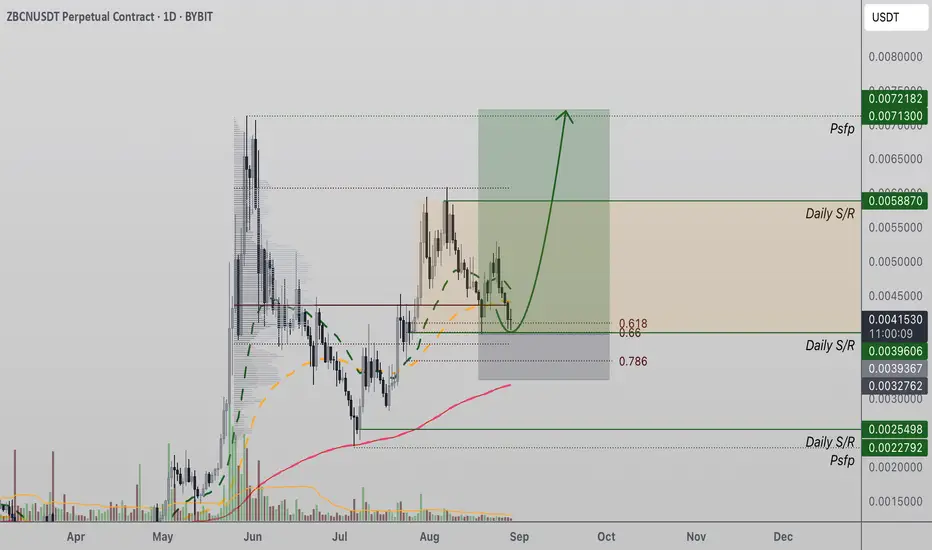
ZBCN Tests Key Daily Support With Potential for BreakoutZBCN price action is consolidating at a critical daily support zone, a level reinforced by the value area low and the 0.618 Fibonacci retracement. This region has already been retested multiple times, highlighting its importance as a structural pivot. Despite the repeated pressure, bulls remain in control as long as this support is maintained. A sustained defense could provide the catalyst for continuation higher.
ZBCN Price Technical Points:
- Daily Support Zone: ZBCN is trading at daily support aligned with the value area low.
- 0.618 Fibonacci Confluence: Price action has breached this level intraday, but bulls continue defending it.
- Volume Confirmation Needed: A rally requires bullish inflows to reverse the current volume decline.
The daily support zone currently being tested by ZBCN is critical for maintaining its bullish trajectory. Its alignment with both the value area low and the 0.618 Fibonacci retracement creates a high-confluence region. Price briefly breached this level on a closing basis, but the market has so far failed to generate follow-through selling pressure, suggesting that buyers remain active.
From a structural perspective, this support test provides an opportunity for another higher low to form. Such retests are often healthy within bullish trends, as they confirm the strength of demand zones. However, the absence of volume confirmation is concerning. A clear decline in the volume profile suggests that participation is thinning, which may delay a strong upside reaction until inflows return.
For ZBCN to initiate a move toward its all-time high, volume will be the decisive factor. Strong bullish inflows paired with decisive candles are necessary to confirm conviction and momentum. Without this validation, the market risks extended consolidation around the current level, testing the patience of participants before a breakout occurs.
What to expect in the coming price action:
If ZBCN holds the current daily support and volume inflows return, the probability of a rotation toward the all-time high increases significantly. Failure to attract demand could see price stall or retest lower supports.
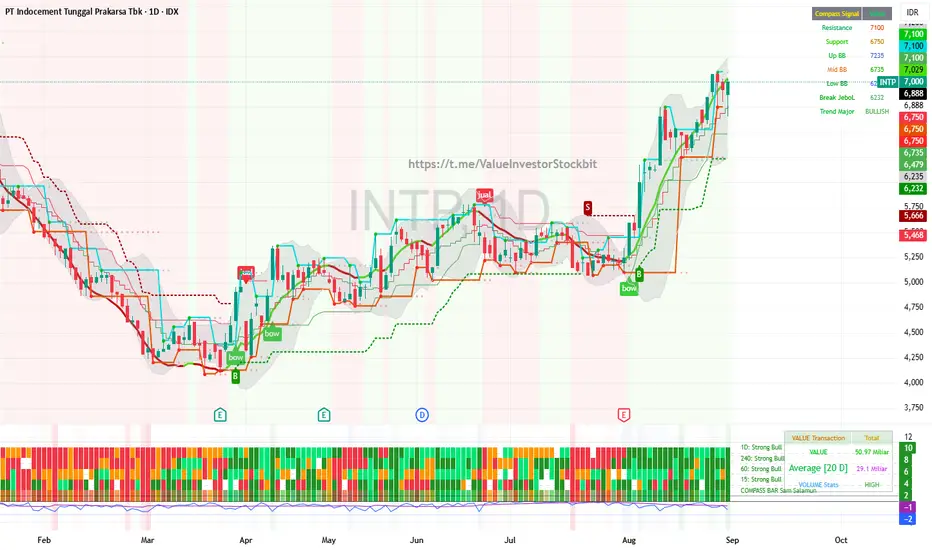
INTP masih strong bullish, stay HOLD sampai muncul signal sellINTP is still strongly bullish, stay HOLD until a sell signal appears.
For those who don't have one yet, consider an automatic buy in installments of 6650-6800
PENDLE Buy Prices For a DCA Strategy & Fib Take Profit TargetsPENDLE is a great coin for this Bull run, which I think can easily push up to $10 - $20.
In this video, I cover where I'm placing limit buy orders below to dollar cost average in and build a bigger position, while lowering my overall cost.
Then we'll look at a few reasons why, showing that PENDLE is oversold and likely to push higher here, and into AltSeason.
I'm also sharing my 4 Take Profit Targets of $7 (Previous ATH), and the Fib Targets of $10 (F1.618), $15 (F2.618) and $20 (F3.618) as well as hold a Moonbag in case Pendle Moons!
We're up 70% on PENDLE already since recommending it in July and expect higher targets in the coming weeks and months, into the Bull Peak.
What are your thoughts and comments?
- Brett

LTC in a bullflag LTC is creating a bull flag to finally get to the breakout. This move shall bring LTC to the resistance and allow its price to break it with lower volatility. A breakout with low volatility is the best thing that can happen so that PA can accelerate once the resistance is broken and we get the volume. IMO, over the weekend we will see important PA to the upside.

8/28/2025 Trade review 8/28/2025 SPX trade review .. Nive push up at the open and then rejection down to fill previous day gap. Bounce at support and opening range breakout to make new ATHs

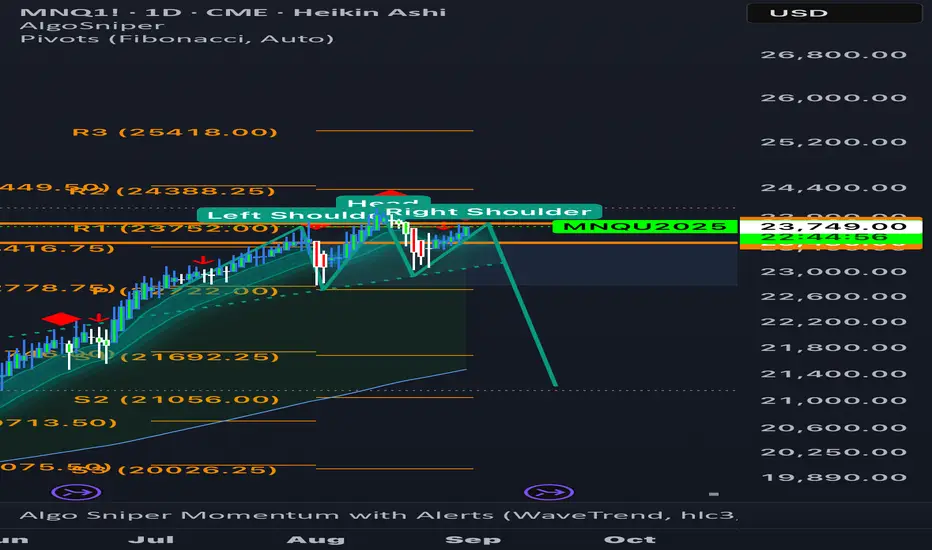
Possible head and shoulders pattern. Based on market structure we will see how our head and shoulders plays out.
ETH bear trap, kill the longs before 5kETH WILL GO TO 4K BEFORE 5K, price will search for stop losses of noobs before going up over 5k and price discovery

NAS100 (15M) – Breakout & Continuation SetupThe NAS100 is showing strong bullish momentum on the 15-minute timeframe with Heikin Ashi candles confirming trend strength.
🔹 Structure:
After multiple consolidations and corrections, price formed higher lows (blue lines) and broke out of recent resistance (red zone).
A clean bullish structure with impulsive legs is visible (green trend lines).
🔹 Indicators:
The Alligator lines are opening upward, signaling trend continuation.
RSI is holding above 70, confirming bullish strength (but caution for potential pullback).
🔹 Setup:
Entry near 23,693 – 23,699.
Stop loss below 23,617.
Target around 23,841, giving a favorable risk-to-reward ratio.
📈 Bias: Bullish continuation towards 23,800+ as long as support holds.
📉 A break below 23,617 would invalidate the setup.

GOLD AQZ Measured MoveBased on a trading method I created in 2019 "AQZ" Gold could potentially target 3547
if we get a close above preferred entry zone on the daily time frame.
Don't sleep on this analysis!!!
Much Love, and GOD Bless!!!

eGold Consolidates at Key Support, Eyes Rally Toward $20eGold (EGLD) continues to respect a critical support zone aligned with the 0.618 Fibonacci retracement and the value area low. Holding above $14.22 could trigger a bullish rotation toward $20.
Introduction:
EGLD’s recent price action has highlighted the importance of its current support region, which holds multiple technical confluences. With the 0.618 Fibonacci retracement and the value area low reinforcing this level, buyers have so far maintained control. As long as price remains above $14.22, the bullish structure of higher highs and higher lows remains valid, setting the stage for potential continuation.
Key Technical Points:
- Critical Support at $14.22: Confluence with 0.618 Fibonacci retracement and value area low provides structural strength.
- Bullish Market Structure Intact: Higher-low projections remain valid on the daily timeframe.
- Next Target at $20: An untested high time frame level that could attract price if momentum builds.
Main Analysis:
The $14.22 level is a crucial pivot for EGLD, sitting directly in line with the 0.618 Fibonacci retracement and the value area low of the current trading range. These overlapping signals provide strong technical support and create favorable conditions for buyers to maintain control. This region has repeatedly acted as a foundation for consolidations, confirming its importance as a structural anchor.
Price action continues to form higher lows and higher highs, which is a defining characteristic of bullish momentum. As long as this projection holds, the broader market structure remains positive. A decisive defense of the $14.22 region will only reinforce this trend, allowing buyers to prepare for another impulsive move higher.
The $20 level stands out as the next significant target. This area has not yet been tested following recent price action and therefore is likely to act as a magnet for continuation. From a volume perspective, demand confirmation will be essential. The volume profile needs to show sustained bullish inflows to support acceleration toward $20, as price action alone is not enough to validate a breakout. Consolidation without volume could delay the rally, while a surge in participation would confirm that buyers are firmly committed.
What to Expect in the Coming Price Action:
If EGLD consolidates above $14.22 with sustained bullish volume, the probability of a rally toward $20 increases substantially. A break of this resistance would further validate the bullish structure. Conversely, losing $14.22 on a closing basis would undermine the higher-low projection and increase the risk of a deeper corrective move.
Conclusion:
eGold is holding firm at a major support zone, with the 0.618 Fibonacci retracement and value area low providing strong technical confluence. If buyers defend $14.22 and demand builds through volume, EGLD could rotate toward $20, reinforcing its bullish market structure. Failure to sustain this region, however, would challenge the bullish outlook and expose the asset to a deeper retracement.

BNB go to ATHBNB is in good shape and if the next candle closes on the 4-hour timeframe, the probability of a ATH is very high.
Be profitable

BTC DOMINANCE JOURNEY BTCD will help us pave the road. Using Smart Money Concepts and Standard Deviation, we can see clearly on how Dominance will move.

QXO Breaking out of bull flagQXO breaking bull flag formation with above average volume. Just had great earnings and the industrials sector is the third best performing sector over the last six months.
Entering 22C 21Nov25
S/L Break below 20.70

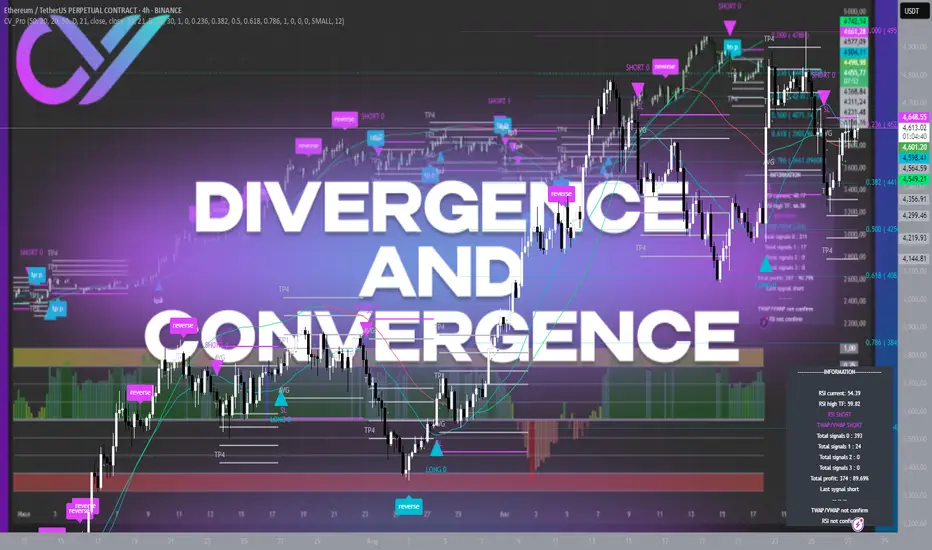
Divergence and Convergence: How to Read Market SignalsThe cryptocurrency market, like any financial market, is full of paradoxes. Price can rise, yet the strength of the trend is already weakening. Indicators may show that the move is “running on fumes,” but most traders keep buying at the top or selling at the bottom. The result is always the same: emotional trading and chaos instead of system and consistency.
The main problem is that most participants only look at price. But price is just the tip of the iceberg. Beneath it lie volumes, momentum, trader sentiment, and recurring statistical patterns. This is where divergence and convergence come into play — signals that often warn of a trend change long before it becomes obvious.
What are Divergence and Convergence
Divergence occurs when the price makes new highs or lows, but a momentum indicator (such as RSI or MACD) shows the opposite — weakening strength. It’s a signal that the trend is losing energy and the probability of reversal is rising.
Convergence is the opposite. The price updates a low, but the indicator shows higher readings. This suggests sellers are losing steam and buyers may soon regain control.
On the chart, these may look like small details, but for an attentive trader, they mark turning points — the very beginnings of shifts that later become obvious to everyone else.
Why These Signals Matter
Imagine Bitcoin climbing from $105,000 to $118,000. Everyone is euphoric, and newcomers rush to open longs, hoping for more upside. Meanwhile, RSI is already showing divergence: price is up, momentum is down. For a careful trader, that’s a red flag.
Moments like this help avoid buying at the peak and prepare for an incoming correction. More importantly, divergences not only give exit signals but also highlight potential reversal zones — places where traders can plan new entries in the opposite direction.
How to Read Divergence and Convergence
Compare price highs/lows with the indicator. If price rises but the indicator falls — it’s divergence.
Check the context. A single signal on the indicator means little. Support/resistance levels, volumes, and candlestick structure matter.
Be patient. Divergence can form over several candles, and the market often makes one last push before turning.
Combine tools. Use divergence alongside TP/SL zones and trendlines to improve accuracy.
Common Mistakes
Many beginners make the same error: they see divergence and instantly trade against the trend. That’s wrong. Divergence isn’t a “buy/sell button,” it’s a warning. It says: “Be cautious, momentum is fading.” The actual reversal must still be confirmed by price structure and volumes.
Another mistake is ignoring timeframe. Divergence on a 5-minute chart may only play out for a few dollars, but on a 4H or daily chart, the move could be massive.
Building it Into a System
This is the crucial part. An indicator alone won’t make a trader successful. Divergence and convergence need to be part of a system where:
- entry and exit zones are pre-defined,
- profit targets are clearly marked,
- risk is limited by stop-losses,
- and decisions are made without emotions, based on structure.
This is where algorithms and automation prove invaluable. An automated model spots divergence earlier than the eye, flags conditions for a probable trend shift, and guides the trade step by step.
Why It Works
Markets move in cycles, and history repeats. Divergence and convergence are not magic, but a reflection of market physics: momentum fades, energy runs out, and no trend lasts forever. Ignoring these signals means trading blind.
Integrating them into a structured process means having a map of potential scenarios ahead of time. It doesn’t guarantee perfection, but it eliminates guesswork and replaces it with probabilities and discipline.
Conclusion
Divergence and convergence are market warnings for those who pay attention. They help traders exit on time, avoid entering at peaks, and prepare for reversals. Most importantly, they train discipline and patience — the qualities that separate long-term survivors from those who get washed out.
In a world where emotions break strategies, systematic analysis provides the edge. Automation, technical tools, and the ability to read market structure turn chaos into a structured process. For traders seeking to look deeper than just price, divergence and convergence are signals worth learning to read as carefully as a book.
JNJ - Swing BuyG/G Trend
Volume and VScore support.
Aggro Entry
XLV up, but below 200sma.
Buy at 177.05
Sept 19 175 Option.
Profit: 178.80 Move to breakeven or 25%

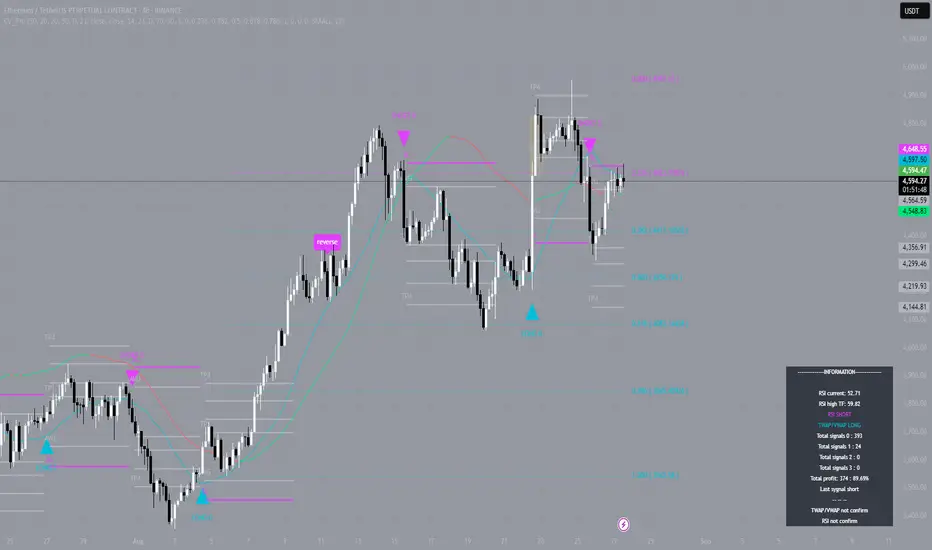
Ethereum: when levels guide the tradeEvery trader knows: entering the market is one thing, but understanding where to take profit is another. Without a system, the chart turns into chaotic candles, and decisions are driven by emotions.
A recent move on Ethereum’s 4-hour timeframe clearly showed the value of structured visualization. The entry was around $4274, with price developing up to $4650, where many participants could have locked in profit before the trend shifted.
This isn’t randomness. It’s the power of levels that outline the market’s roadmap in advance: where strength is concentrated, where reversals may happen, and where profit-taking makes sense.
For beginners, such levels serve as a navigator: they reveal patterns that would otherwise take years to master.
For intermediate traders, it’s an accelerator: a tool that eliminates chaos, enforces discipline, and reduces mistakes caused by emotions.
For advanced traders, it’s about saving time and keeping strategy under control without redrawing charts manually.
For investors, it provides a visual layer of clarity: entry and exit points become easier to track, and long-term strategies gain transparency.
The market will always move on its own terms. But traders have a choice — react to chaos or build structure. Visualization of levels provides the system: it shows the market map and helps maintain discipline regardless of volatility.
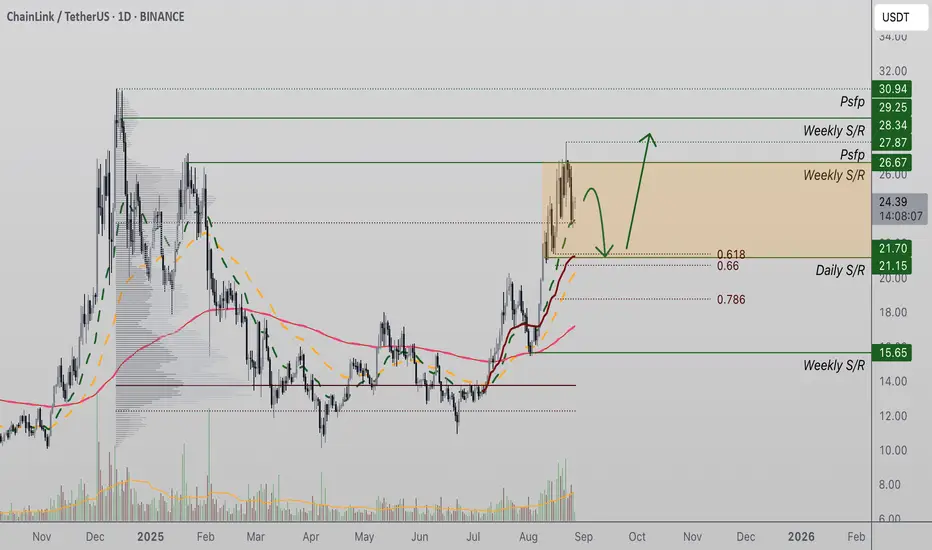
Chainlink Rejected at $26 but Support at $21.15 Holds Chainlink (LINK) has faced rejection from the $26 high time frame resistance after forming a bearish engulfing candle. Price now eyes the $21.15 support level, which is reinforced by strong technical confluence.
LINK’s recent rejection at $26 has temporarily slowed bullish momentum, with price retracing from its high time frame resistance. However, a key support zone is emerging at $21.15, a level backed by multiple technical indicators. If buyers defend this level during a retest, LINK’s bullish structure will remain intact, and a rotation toward higher objectives becomes highly probable.
Key Technical Points:
- Rejection at $26: Price was capped by high time frame resistance, leading to a bearish engulfing candle.
- Critical Support at $21.15: Confluent with the 50-day moving average and 0.618 Fibonacci retracement.
- Next Target $28.34: A confirmed bullish retest could open the path to this high time frame resistance.
LINK’s reaction at $26 highlights the importance of this resistance zone. The bearish engulfing pattern that formed here suggests profit-taking and the presence of sellers, leading to a retest of the value area high. Despite this rejection, the retracement appears orderly, with price action respecting key structural elements that still support a bullish outlook.
The $21.15 level now stands as the critical line in the sand. This zone is not only a horizontal support but also aligns with the 50-day moving average and the 0.618 Fibonacci retracement. Such a confluence often serves as a strong foundation for reversals or trend continuation. If LINK revisits this level and demand emerges, it would confirm the presence of buyers and validate the ongoing bullish structure.
Market structure remains favorable as long as higher lows are respected. Even after the rejection, LINK has not broken below key structural supports, meaning that the overall trend bias remains intact. A successful retest of $21.15 would reestablish bullish confidence and allow for continuation toward the next resistance target at $28.34. Without a breakdown, the broader market narrative still leans toward continuation higher.
What to Expect in the Coming Price Action:
If LINK holds $21.15 during a retest, bullish continuation becomes the most probable outcome, with $28.34 serving as the next upside target. However, a failure to maintain this support could weaken the structure and open the door to deeper corrective moves before any renewed upside momentum develops.
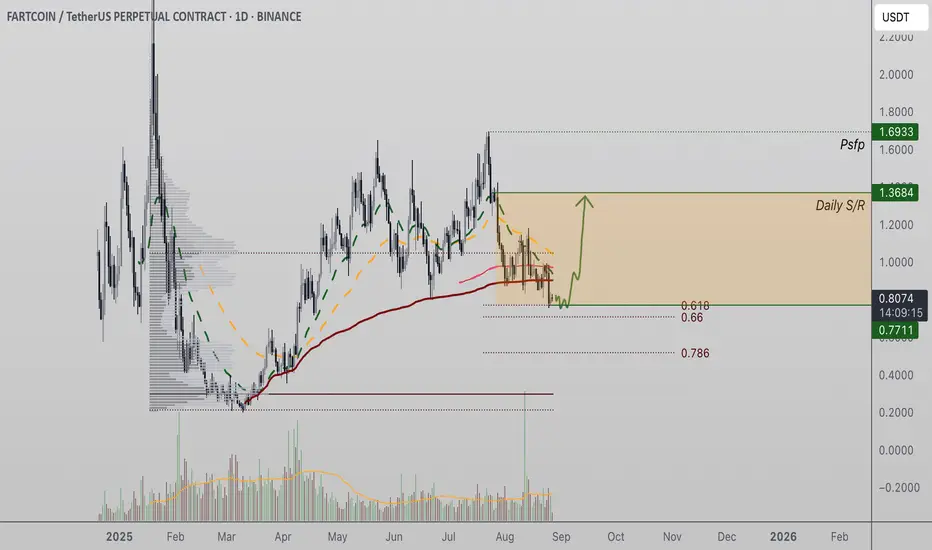
Fartcoin Defends $0.77 Support, Eyes Rotation Toward $1.36Fartcoin has reverted to the $0.77 region, a level reinforced by both Fibonacci retracement and daily support. Multiple daily closes above this zone suggest demand is present, keeping bullish continuation on the table.
The $0.77 mark has emerged as a pivotal region for Fartcoin’s price action, aligning with a critical Fibonacci level and daily support. Recent trading has confirmed demand in this area, with multiple daily closes holding above it. From a structural standpoint, this confluence is crucial in maintaining bullish momentum and setting up the conditions for another rally.
Key Technical Points:
- Support at $0.77: Confluence of Fibonacci retracement and daily support makes this a key level to defend.
- Bullish Engulfing Candle: Liquidity sweep followed by an impulsive rebound signals demand is active.
- Upside Target $1.36: A rotation toward this high time frame level becomes likely if volume inflows confirm.
Price action around the $0.77 level has been decisive. Following a liquidity breach and impulsive candle lower, buyers quickly stepped in to spark a bullish engulfing candle, reclaiming support. This reaction suggests that demand is sitting at this level, providing the first confirmation that $0.77 is acting as a strong floor for continuation. Multiple daily closes above this support reinforce the bullish case and highlight the presence of accumulation.
Market structure also favors a continuation. The liquidity sweep beneath $0.77 has already cleared resting stops, reducing downside pressure. This event is often a precursor to renewed bullish momentum, as liquidity is absorbed and price stabilizes. The subsequent ability of buyers to keep price above $0.77 shows that the structure of higher lows can remain intact, keeping the broader bullish bias alive.
However, the key missing element is volume. While structural support has held and demand is visible, a sustained rotation toward $1.36 requires strong bullish inflows to validate momentum. Without this confirmation, the current price action risks stagnation, with upside capped until participation increases. Monitoring trading volume in the short term will be critical to gauge whether bulls are prepared to push Fartcoin higher.
What to Expect in the Coming Price Action:
If demand continues to defend $0.77 and bullish volume confirms, Fartcoin could rotate toward the $1.36 level, which represents a significant high time frame resistance. A failure to generate volume, however, could keep price consolidating near current levels, delaying the next move.
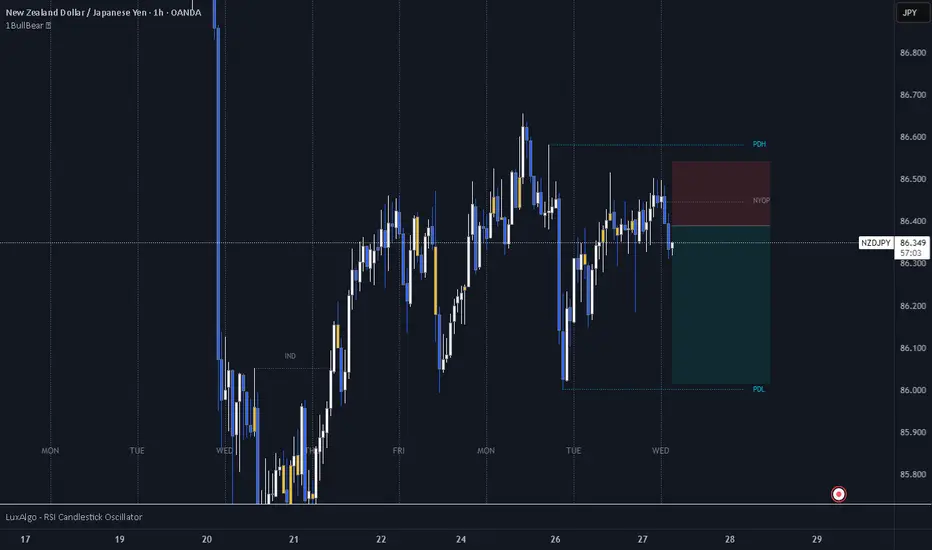
NZD/JPY – Sell- Why: NZD underperforming AUD despite mild bullish futures bias; JPY supported by strong bullish futures bias & intervention watch; risk-on backdrop still allows JPY to hold ground vs weaker risk FX.