IB EMA5 cross HP AHProj LuxAlgoGo long when the EMA 5 crosses above the EMA 65, and exit the long position when it crosses back below. This setup is combined with the harmonic pattern drawing a downward line, and it triggers when price touches the LuxAlgo support band.
Contains IO script
BTC: Transition from Long to ShortThe market has once again reminded us that trading leaves no room for guesswork. Around $116,000, Bitcoin’s upward momentum began to weaken: volumes were fading, candles were leaving long upper wicks, and the impulse was clearly slowing. The algorithmic model highlighted that holding a long position had become risky. The long was closed before reaching the first target zone, which helped avoid unnecessary losses and secure the gains from the prior move.
Soon after, the structure confirmed the shift: the market reversed, and around $112,000, the model marked conditions in favor of a bearish scenario. Since then, the price has dropped below $109,000, showing that sellers continue to dominate.
Now, however, the picture is becoming more nuanced. Additional analysis points to signs of downside exhaustion — the selling pressure is showing signs of overheating. This doesn’t mean an immediate reversal is guaranteed, but such areas often form the foundation for a corrective move upward. For the moment, the short scenario remains valid, but the probability of an incoming shift is growing.
This is exactly where the value of a systematic approach becomes clear. Without defined rules, traders risk closing too early or, conversely, staying in a trade far longer than necessary. Emotions — fear of losing profits or missing out on a move — are the biggest enemy here, pushing traders toward impulsive and chaotic decisions.
An algorithm acts differently. It defines exit zones, highlights potential reversal conditions, and helps guide the trade step by step. This transforms the market from chaos into a structured process: cold calculation instead of guessing, a clear plan instead of panic.
For now, BTC remains in a downward scenario, but the market is already laying the groundwork for a potential change in direction. The only question is who will be prepared when that moment comes.
P.S. This was the largest volume of liquidations of long positions since December.

AUSDT bulish This AUSDT currency has reached the oversold area and should experience a growth of at least 8%. In this strategy, I buy spot and wait for the target. The win rate of this strategy is above 80%. If the next stage drops further, I will enter with 2 times the volume, which happens in one out of every 8 transactions. Capital management is the main pillar of trading.

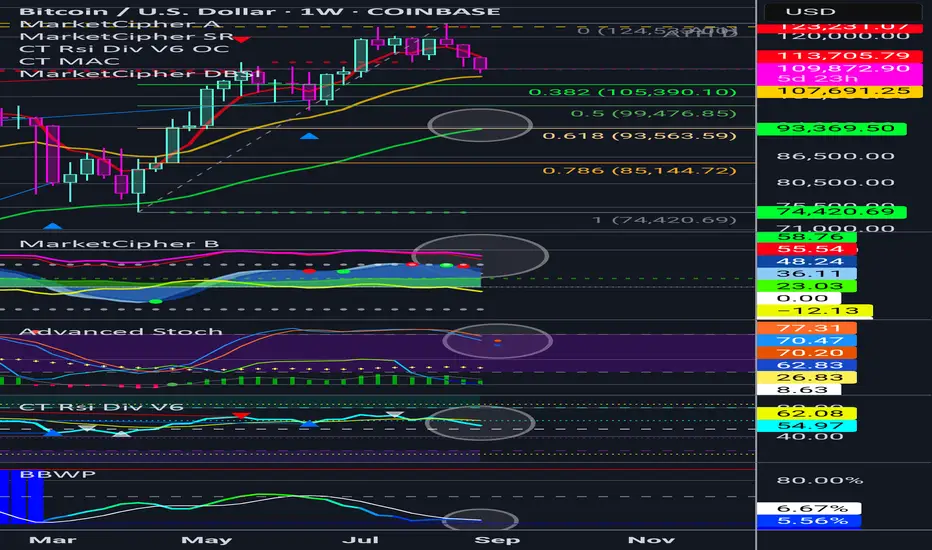
BTC 93-94K target on the Weekly...?Just an idea but what do you think...?
All indicators pointing we move down. And there so happens to be a 50EMA sitting at the 618 Fib retracement. Would love input.
NFA
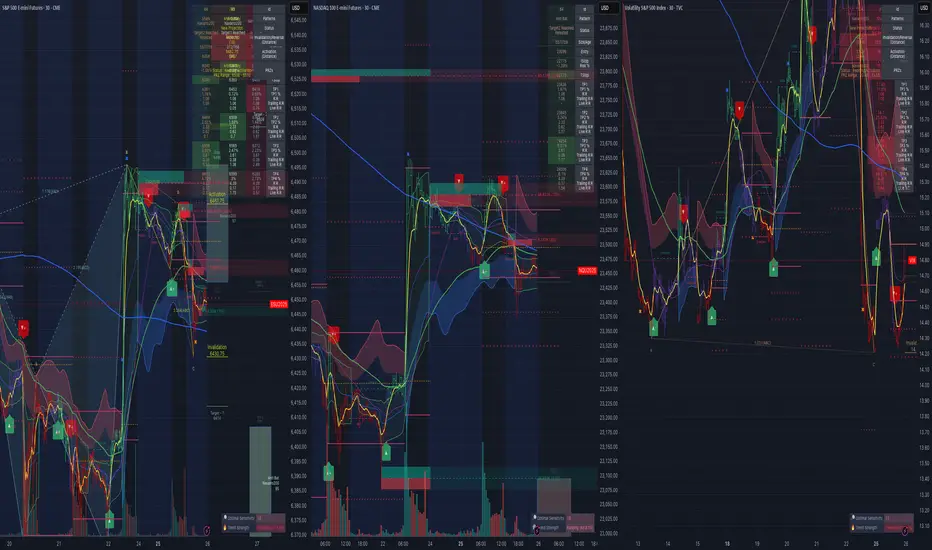
NVDA Earnings, US GDP, US Core PCE - August Wrap-UpAs if Jackson Hole noise wasn't enough, sprinkle in some additional major news
for this week.
NVDA Earnings (After Close Wednesday)
US GDP (Thursday)
US Unemployment Claims (Thursday)
US PCE / US Core PCE (Friday)
NVDA at nearly 8% market cap for S&P can certainly move the market
Look at NVDA, MAGS, SPY, QQQ and they all look like 50/50 charts - price could
go either direction
NVDA expecting +/- 11.00 points on the week, average earnings move is around 12.66 points
I'm looking to fade any big gap on NVDA into September monthly and quarterly expirations with low risk options trades and I'm also deleveraging some of my naked puts and ratio spreads
to take profits and add more buying power for the end of year
I'll be watching - let's see how everything shakes out

Setting up a Tradingview screener to fit your systemSetting up a Tradingview screener to fit your system. Very simple and if you have ideas to make it simpler let me know.

BNB tuched its TPThe first position reached its target with reward 2
Please go and see the previous analysis.
I am waiting for a new high to be recorded

EURUSD - TOKYO SESSION SWEEP Classic Asian liquidity sweep setup on EUR/USD. After clearing Tokyo Highs + BOS, I’m looking for a retracement entry back into the OB → targeting liquidity above. 🚀
Would you take this long or wait for confirmation?

XAUUSD - 4 hour AnalysisOANDA:XAUUSD has recently shown strong bullish momentum, breaking above short-term structure and printing a CHOCH (Change of Character), suggesting a potential shift toward bullish continuation. However, the impulsive move has left behind an imbalance (large wick + body) that often attracts price back for rebalancing before continuation.
📊 Trade Plan (2-Step Strategy)
Step 1 – Retracement Setup
Expect price to retrace toward 50% of the large bullish wick (around 3,350–3,345).
This aligns with classic ICT rebalancing logic, where large imbalance candles often retrace halfway before continuing.
Potential buy entry can be placed in this zone, with stop loss just below the wick low (~3,323).
Step 2 – Upside Continuation
After the retracement, price is expected to continue upward to retest the CHOCH zone (~3,404–3,408).
This level represents unmitigated supply and a natural liquidity target for institutions.
🎯 Targets
First Target (Retrace Fill): 50% of the wick (~3,345).
Final Target (CHOCH Retest): 3,404 – 3,408 zone.
Gold swept liquidity to the downside, printed a strong bullish candle, and confirmed a CHOCH. The most probable scenario is a short-term retracement to fill 50% of the imbalance before resuming upward to retest the CHOCH supply zone.

bearish market for solanaGreetings to our dear friends.
After breaking the bottom and pulling back, Solana could fall to the specified bottom and we could witness a bear market.

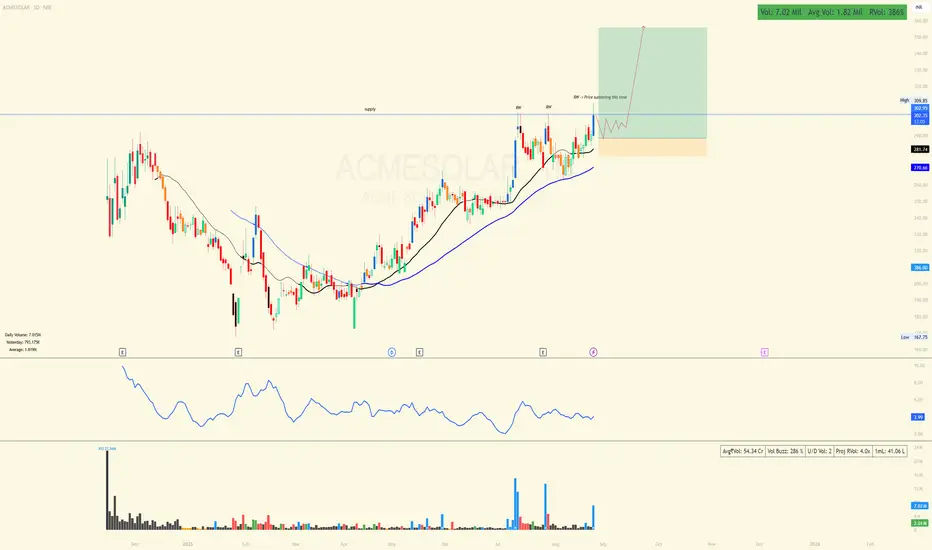
ACMESOLAR | 50SMA Squeeze → Supply BreakIn NSE:ACMESOLAR Price is trending above a rising 50SMA with 20EMA > 50SMA. Multiple taps of the 302–310 supply lid (RW) with higher lows into the level. RVol ~3–4x today = strong demand.
Why now:
Tight coil above 20EMA; shallow pullbacks to the 50SMA show acceptance.
Volume buzz high; up-day volume dominates low-volume dips.
Prior rejections at supply; this attempt shows price sustaining near the lid.
Trigger & Entry:
Break/close >305–310 with RVol >1.5x.
Add on retest & hold of 302–305 as support.
Invalidation / Risk:
Thesis fails on a daily close back below the 50SMA or <270.
Cut if breakout fails with wide-range red + heavy volume.
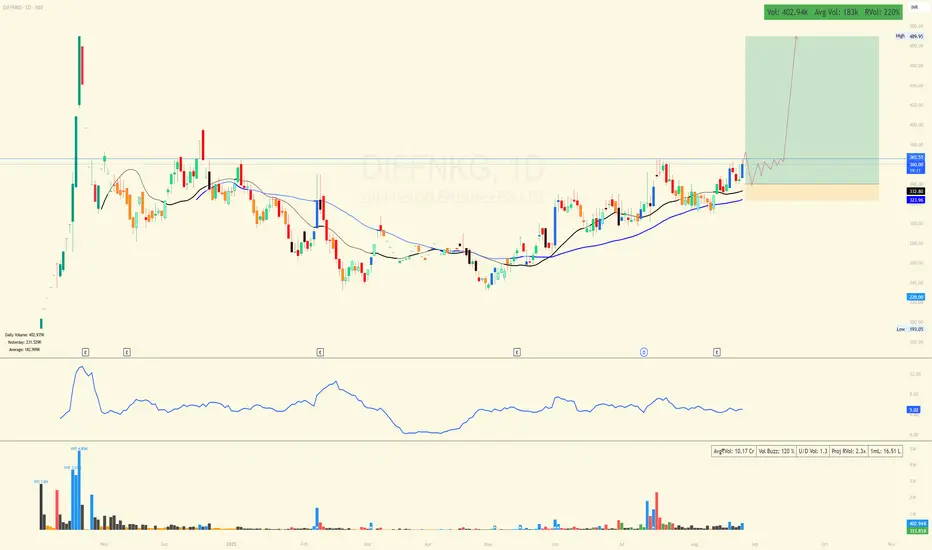
DIFFNKG 50SMA Baseline setupIn NSE:DIFFNKG Price has reclaimed and ridden a rising 50SMA with higher lows. 20EMA is above the 50SMA and price is coiling just under the prior pivot classic 50SMA squeeze → breakout condition. Relative Volume is elevated, showing fresh participation.
Why now:
Multiple tight closes above 50SMA = acceptance.
Volume dry-up during the coil, followed by RVol >2x on thrusts = supply absorption then demand.
Clean range 332–355 acting as launchpad.
Trigger & Entry: NSE:DIFFNKG
Break/close above 355–360 with RVol >1.5x.
Optional add on a 355 retest if it holds as support.
Invalidation / Risk:
Idea fails on a daily close back below the 50SMA or <323 (range floor).
Reduce if breakout prints wide-range red bar with high volume.
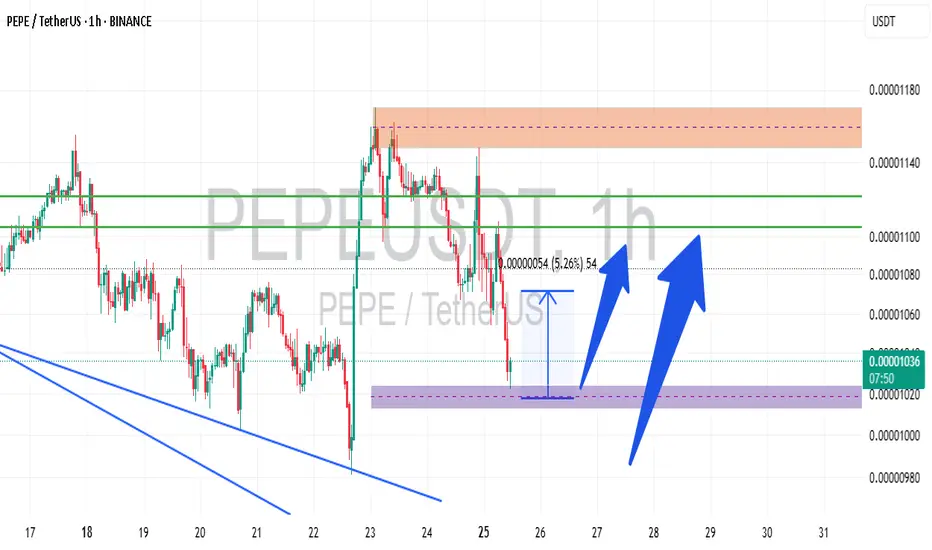
suport line fpr #pepeusdt long positionGreetings to my dear friends
From Pepe to the buying cycle to the 5% target
This strategy is spot and has no stop until the next range where you have to enter with double the capital, so capital management is important
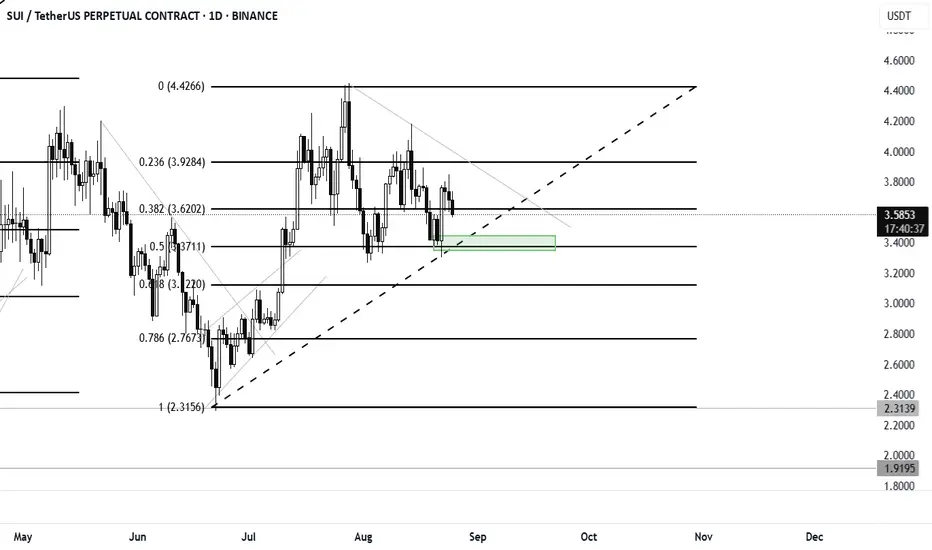
$SUI new Entry Points after rejectionCRYPTOCAP:SUI had heavy take profits at the resistance.
Marked is the new entry point at 0.5 Fib level.
I will be looking to long at 3.40$ and stoploss at 3.29
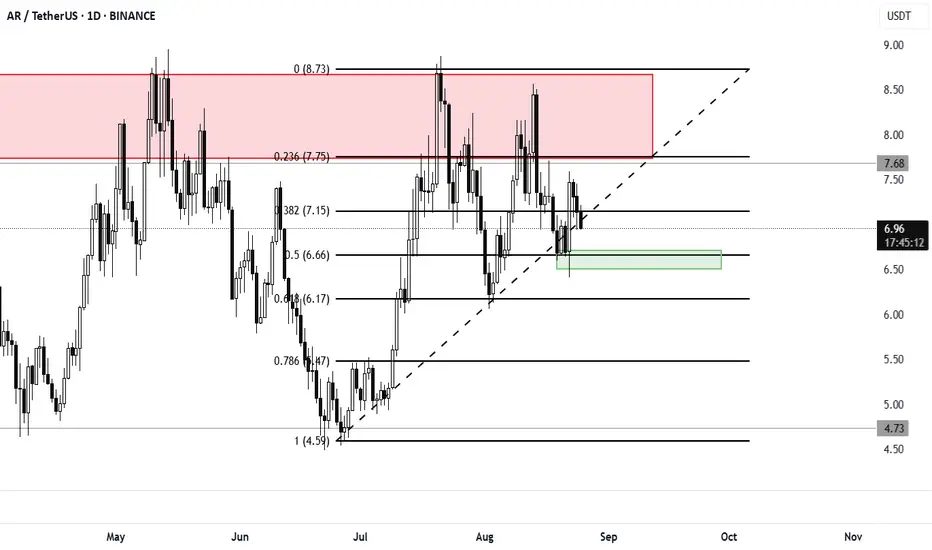
AR Took heavy rejection. New entry pointsNYSE:AR took heavy rejections and resistance is marked.
will be looking to long it from 0.5 Fib levels and marked entry zone.
ENA Bullish Order Block Plus 200 MA Strong confluenceENA has corrected after tapping into the 0.618 Fibonacci retracement, and price action is now gravitating toward a key bullish order block that has yet to be tested. This zone is particularly important, as it not only serves as a structural demand region but also aligns with the 200-day moving average, creating a strong confluence of technical support. How ENA reacts at this level will be pivotal in determining whether the trend can sustain its bullish momentum.
Key Technical Points:
- 0.618 Fibonacci Retracement: Recent correction respected this critical retracement level before shifting lower into support.
- Bullish Order Block + 200 MA: Strong confluence support area where demand is expected to absorb selling pressure.
- Weekly Target at $0.61: A continuation higher remains viable as long as price holds above the order block.
The recent corrective move in ENA has been orderly rather than impulsive, suggesting that sellers have not overwhelmed the broader trend. The decline into the bullish order block coinciding with the 200 moving average provides traders with a high-probability support zone, where buying interest is likely to reemerge. These conditions make this area the ideal battleground between supply and demand, and its defense will be crucial for continuation.
From a structural perspective, order blocks have the ability to maintain price stability for extended periods. If ENA holds this region without significant breakdowns, sideways accumulation could occur before a renewed move higher. This would provide the market time to reset momentum indicators and build the foundation for another leg up.
Volume analysis supports the bullish case. Strong influxes of buying volume are evident throughout recent trading sessions, confirming that demand continues to underpin the trend. Sustained participation from bulls at this level would reinforce the likelihood of a reversal from support and set the stage for a rotation higher.
The broader trend remains constructive, with higher lows and confluence zones supporting the market structure. As long as the bullish order block remains intact and volume continues to favor buyers, ENA retains the merit for continuation into higher targets.
What to Expect in the Coming Price Action:
ENA is approaching a high-confluence support zone where the bullish order block and 200 MA align. If this area holds, the setup favors a rotation back toward the $0.61 weekly target and potentially beyond. Consolidation at this support before a breakout is also a probable scenario. A breakdown below the order block would invalidate the immediate bullish outlook, but until then, the trend remains biased toward continuation higher.

MEMEUSD LONGMEMEUSD crossed 200EMA on daily. It can fail, but where to? lower? Considering that BTC % is dropping to hell, alts suppose to pump, lets see the pump.

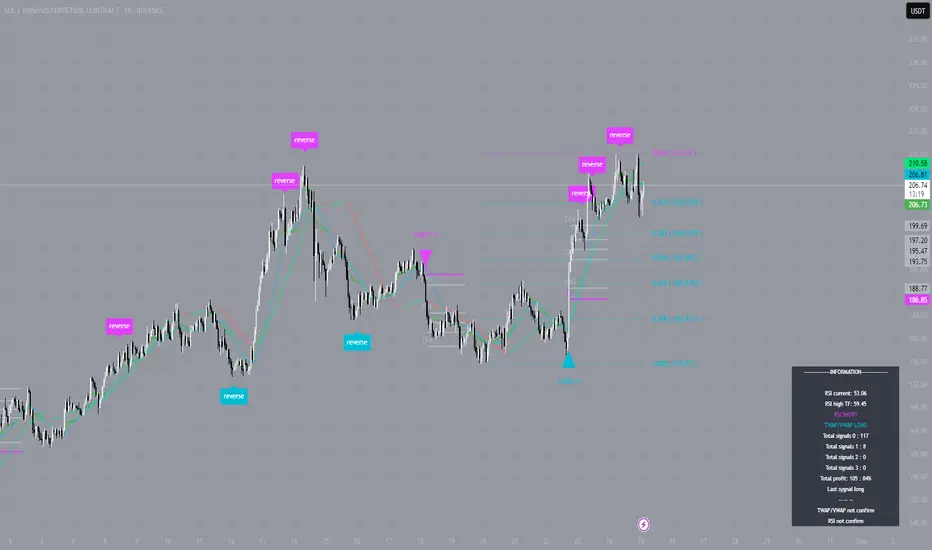
SOL — Hourly Scenario from $180: TP4 Reached, Trend Still Hold
When Solana was trading around $180, the market looked sluggish. Many expected the asset to drift into a sideways range, and few were ready to believe in further growth. But it is precisely in such moments that the power of a systematic approach becomes clear: the algorithmic model identified a set of conditions pointing toward an upward scenario.
From there, the movement developed quickly. The price advanced step by step, breaking through local resistance levels and solidifying the trend. Each profit-taking stage was reached in sequence, and today Solana has already surpassed TP4 and is holding above $200.
This is not just a technical milestone — it’s a confirmation of structural strength. On the 1H chart, the trend remains intact: key support levels are being defended, and no reversal impulse has yet emerged. The current working range of $199–$202 leaves the door open for a continuation toward $206–$210.
For traders, the takeaway here is that this isn’t coincidence but structure at work. The market always leaves traces: volumes, candle shapes, reactions to levels. The algorithm simply brings them together, capturing conditions where the probability of growth is statistically higher. And that’s what allows traders to hold positions longer, without giving in to noise or emotion.
The SOL case is another reminder of a simple truth: the market doesn’t reward those who try to guess direction, but those who follow structure. And the structure today says one thing — the trend is alive, and it hasn’t spoken its last word yet.
Emotions vs. StrategyTrading rarely breaks us technically — more often, it breaks us psychologically. Anyone who has ever opened a position knows this feeling: your heart races, your hand wants to close the trade too early, and the thought “What if I was wrong?” keeps gnawing at you. Emotions are a trader’s biggest enemy. And more often than not, they are the true reason for losses, not the market itself.
Imagine this: you open a long, and the price immediately moves against you. Instead of calmly waiting for your pre-set stop-loss, you move it, or worse — remove it altogether. Or the opposite: the trade is profitable, but the fear of losing makes you close far too early. The result? The strategy collapses, trades become chaotic, and the account balance shrinks.
Every trader has had that moment of realization: “I knew what I should have done, I had a plan — but I couldn’t handle the pressure.” That’s the most frustrating part, because knowledge and analysis were there, but discipline failed. And in those moments, you understand that the winners in this game are not the smartest ones — they’re the ones who can stay calm and stick to the system.
What really helps
1. A systematic approach. Trading must be built on an algorithm, not on impulses or guesses. If you have a clear plan — entry, stop-loss, profit targets — the risk of chaotic actions drops dramatically.
2. Writing the rules down. A written plan works better than one you keep “in your head.” Many successful traders keep a trading journal: why they entered, what emotions they felt, where they made mistakes. This builds awareness and helps improve discipline.
3. Automation and tools. Using algorithms that help manage trades takes away most of the emotional burden. Machines don’t hesitate, don’t fear, and don’t regret — they simply act according to conditions.
4. Proper risk management. Emotions flare up when the risk per trade is too large. If a position risks only 1–2% of your account, market swings don’t feel as painful — and that allows you to calmly stick to the plan.
5. Stop-losses and take-profits. These are not only for controlling risk and locking profits — they are tools for peace of mind. A trader who sets them in advance is less likely to act impulsively.
6. Diversification. Putting all of your capital into one trade is the fastest way to emotional burnout. Splitting positions across assets reduces pressure and makes price movements easier to tolerate.
7. Working on emotions directly. Meditation, sports, walks, proper sleep — they might sound trivial, but psychological resilience is built on these habits. A tired trader is far more likely to make poor decisions.
The market is chaotic only for those who approach it without a system. When you have an algorithm that highlights key zones, identifies trend shifts, and guides trade management step by step, emotions fade into the background. This is what transforms trading from a stressful lottery into a structured process. The core idea is simple: cold calculation instead of emotions, an algorithm instead of chaos, technical analysis instead of guesses. Everything else follows from that choice.

Crypto Market Drops Without News: External Factors Back in PlayToday we’re seeing a synchronized decline across the crypto market. Major altcoins and Bitcoin have dropped on average 2–4%, while some assets corrected even deeper — up to -9%. What’s notable here is the absence of significant crypto-related news that could justify such a sharp move.
This type of action often points to external influences. In this case, it’s geopolitics: escalation in the Middle East, where Israel has launched active military operations against Yemen. For global markets, events like this typically trigger risk-off sentiment, pushing investors toward safer assets. Cryptocurrencies, despite their popularity, are still perceived as high-risk instruments, so we’re seeing capital outflows.
From a technical perspective, many assets had already entered overbought zones after the recent rally, meaning any external shock could serve as a trigger for correction. The market was essentially “looking for a reason,” and geopolitics delivered one right on time.
For now, this looks more like a technical correction on news-driven noise rather than the start of a major bearish trend. Still, caution is warranted: volatility may remain elevated in the coming days, with potential for false moves in both directions.
The key takeaway is risk management. In periods like this, it’s wiser to reduce position sizes, lock in partial profits, and monitor how the market reacts to support levels. Geopolitics rarely dictates the long-term direction of crypto, but it often acts as a powerful short-term catalyst.

EUR/USD Long Setup: Riding the Wave After Powell’s Dovish TalkEUR/USD Long Opportunity Post-Powell Speech
Following Jerome Powell’s dovish remarks at the 2025 Jackson Hole Symposium, the EUR/USD is showing strong bullish potential. With the pair currently trading at 1.16626, I’m looking to enter buy positions targeting a move up to 1.18295. Key Points: Trade Direction: Strictly bullish. I see no reason to sell given the USD weakness post-Powell.
Entry Zone: Buying opportunities around 1.16626 or on a confirmed breakout above 1.1700.
Target: Aiming for 1.18295 (key resistance level).
Stop Loss: Place below 1.1597 to manage risk.
Market Context: The dovish Fed outlook supports EUR/USD upside, making this an ideal week for capturing momentum and passing prop firm trading challenges.
Risk Management: Use 1-2% position sizing to navigate volatility and ensure a favorable risk-reward ratio (targeting at least 2:1).
This setup offers a high-probability trade for swing traders and those aiming to pass funding challenges this week. Stay disciplined and monitor price action around key levels. Disclaimer: Trading involves risk. Always conduct your own analysis and consult a financial advisor.

Pepe LongCRYPTOCAP:PEPE looking good after a s/r flip in a key area, now in an uptrend. Bought here at 0.011. Red line = stop

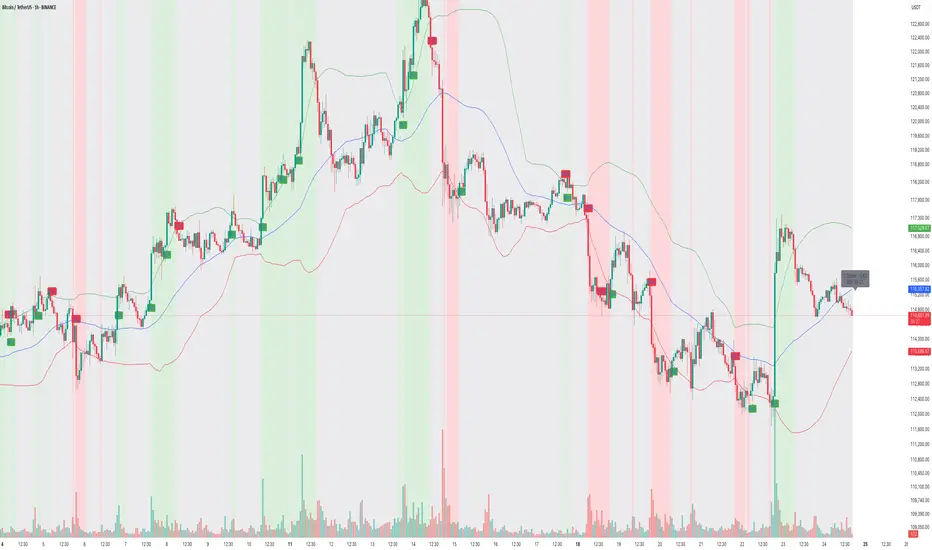
How to Use "Market Anomaly Detector (MAD)" 📊 Market Anomaly Detector (MAD) – Performance Walkthrough
🔑 Core Concept
The Market Anomaly Detector (MAD) is designed to spot both trend continuations and reversals using volatility-adaptive bands and a statistical anomaly filter.
• Trend Signals:
• ✅ Buy → when price closes above the upper (green) band.
• ✅ Sell → when price closes below the lower (red) band.
• Reversal Signals:
• 🔄 Sell → when price falls back below the upper (green) band after a breakout.
• 🔄 Buy → when price climbs back above the lower (red) band after a breakdown.
This dual-layer logic helps the indicator capture clean trending moves while also spotting failed breakouts/breakdowns.
⸻
📉 Z-Score Logic – Detecting Market Craze
The Z-Score filter measures how far price activity deviates from its normal behavior:
• 📈 Z > +1 → Market shows bullish strength / craze.
• 📉 Z < –1 → Market shows bearish strength / craze.
• ⚖️ Between –1 and +1 → Market is in neutral / low-momentum mode.
🔎 Current Snapshot (Weekend Session):
• Z-Score = –0.52 → clearly reflects very low momentum.
• Volume is also weak, as is typical during weekends.
• Despite low activity, MAD still adapts and keeps traders aligned with the actual statistical condition of the market.
⸻
🟢 Bullish Examples
• Captured breakout above 118K → 123K with clear momentum.
• Z-Score crossed +1 confirming bullish craze.
🔴 Bearish Examples
• Detected reversal near 121K → 116K with breakdown signals.
• Z-Score dipped below –1, validating the downside momentum.
⸻
🛠 How to Use
1. Look at band breakouts/breakdowns for trade triggers.
2. Watch Z-Score:
• Above +1 → only take bullish signals.
• Below –1 → only take bearish signals.
• Between –1 & +1 → reduce exposure / trade smaller size.
3. Works best on 15m / 1h / 4h with additional filters (VWAP, volume, S/R).
⸻
🎯 Summary
The Market Anomaly Detector (MAD) combines price bands with Z-Score statistics to give traders a 360° view of both market direction and market strength.
• 📊 Captures trends.
• 🔄 Detects reversals.
• ⚖️ Adapts to low-momentum phases (like weekends).
This balance makes MAD a versatile tool for traders who want to stay ahead of both momentum moves and false breakouts.