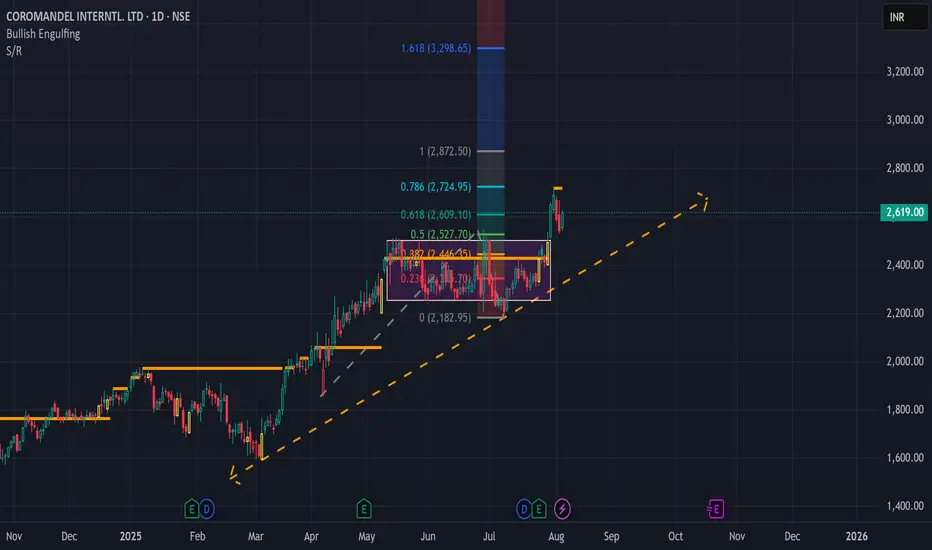
COROMANDEL In breakoutNSE:COROMANDEL is breaking out of a major rectangle Pattern. You can enter at current Point and Target for 2860. Keep stoploss at 2490by ProfitPearlUpdated 0
COROMANDEL : completing its Correction structure Swing Trading Opportunity 🚀 Symbol: COROMANDEL Timeframe: Daily Chart 📅 Current Price: ₹1,670.30 (as of Feb 25, 2023, 08:45 UTC) Target: ₹1,947–1,986 (Swing Target) 🎯 Stop Loss: ₹1,600.00 (Day Close Basis) ⚠️ Support Level: ₹1,505.05 (Extended Retracement Zone) 🛡️ Overview: Coromandel International Ltd. (COROMANDEL) is flashing a thrilling opportunity on the daily chart, perfect for swing traders looking to capitalize on a potential upward move! 🌟 After a sharp pullback, the stock has foundLongby LiveTradingBox3
COROMANDEL Swing Long SetupEnter only when 15minute candle closes above the Entry Zone Price - 1642.35 Target with Risk to reward 1:2 is 1835.75 Stoploss only when 1 day candle closes below the price - 1545.65 Note: This is not any financial advice, this is for education purpose only.Longby gupshupblogUpdated 14
Coromandel International (NSE: COROMANDEL) ForecastWait for the weekly close Based on the daily chart for Coromandel International (NSE: COROMANDEL), here is the summary: Key Levels: - Breakout Level: Around 1287-1290 Current Price: - Current Price: 1287.85 Chart Analysis: 1. Ascending Triangle Pattern: The stock has formed an ascending triangle pattern, a bullish continuation pattern, which it has recently broken out of. 2. Breakout Confirmation: The breakout from the ascending triangle indicates a potential upward move. 3. Targets: - ShLongby The90sTraderOfficial2
Coromandel International Ltd. (ticker: COROMANDEL) ForecastThe provided chart is a 4-hour candlestick chart for Coromandel International Ltd. (ticker: COROMANDEL) on the National Stock Exchange (NSE). Here’s a detailed analysis and summary of the chart: Timeframe and Data: - Timeframe: 4-hour - Data Range: From early January 2024 to late May 2024 Price Analysis: - Current Price: ₹1,246.25 - Price Movement: The stock has shown a mix of uptrend and consolidation phases within the given period. Technical Patterns and Indicators: - Double Top FormatiShortby The90sTraderOfficial0
COROMANDEL--@Support??this stock is now its near to the support zone, multiple times price takes the help of this zone to rise. this time also this zone will push the price upside. we have a strong demand zone lies under this support level. keep looking for long in this stock from support zone@1000by IIT-Trader13
 LongLongLongShort