XAUUSD: Key Pullback Zones Before the Next Leg UpXAUUSD remains in a strong daily uptrend, trading inside a well-defined ascending channel. Price is holding around 4,700, near recent highs, and moving in a “stair-step” structure: impulse → controlled pullback, with no major structural breakdowns. This is typical of a healthy trend where liquidity gets absorbed and repositioned progressively.
In the short term, the most important level is the GAP/imbalance around 4.63k, acting as a natural magnet zone for a pullback. In a bullish environment, it’s common to see price retrace into that inefficiency to “fill” part of the move before continuation. The key concept is simple: the best long timing is not chasing highs, but waiting for a controlled retracement as long as price remains above demand.
Main Daily Demand Zones
4.42k–4.50k: primary pullback area, if it holds, it confirms a classic buy-the-dip continuation scenario.
4.00k–4.18k: deeper major demand, a test here would imply a broader reset and deeper mean reversion risk.
Momentum-wise, RSI remains trend-consistent: no clear structural reversal signal, but it highlights that buying “high” without a pullback increases the risk of poor timing.
From a macro positioning perspective, COT is clearly bullish:
Non-Commercials heavily net long (296k vs 45k short)
Commercials heavily net short (typical hedging behavior)
With Open Interest rising (527,455), the move looks supported by fresh participation, not just short covering.
Seasonality also supports the bullish bias: January is historically positive for gold, especially mid-to-late month. This works best as a probability filter, not an entry trigger.
Retail sentiment shows 59% short vs 41% long, which is a clean contrarian bullish signal: the crowd keeps trying to fade the trend, often fueling further upside spikes and extensions.
Primary bias: bullish continuation.
Scenario A (preferred): pullback into 4.63k–4.65k and/or 4.50k–4.42k → bullish reaction (rejection / engulfing / strong close) → continuation to new highs.
Scenario B: direct breakout continuation → more fragile structure, higher risk of fakeouts and a sharp drop back into the GAP.
Invalidation: daily breakdown below 4.42k with strong closes below support → potential mean reversion toward the lower demand zone.
COT

EUR/USD | Bounce to 1.18 or Breakdown to 1.15?EURUSD is at a key inflection point: on the Daily chart the structure is still bearish (lower highs/lower lows inside a descending channel), but price has now reached a major demand/support zone with an ascending trendline coming in. This creates a high-probability “reaction area” where a corrective bounce can start. This is not a full reversal call: a long only makes sense with confirmation (base holding + higher lows + reclaim of the first key levels). Upside targets are 1.1695–1.1705 as the first magnet, then 1.1750, and finally 1.1800–1.1820 if price can reclaim and hold above resistance. If EURUSD fails to hold demand and closes below the base on the Daily, the long scenario is invalidated and bearish continuation opens toward 1.1570 and 1.1535.
COT: Non-Commercials are still net long EUR, but longs are decreasing and shorts are increasing (not a strong bullish signal), while USD Index positioning remains net short without aggressive expansion, so price confirmation is essential.
Seasonality for January is often mixed, typically favoring corrective moves over clean trends, meaning a bounce is possible but must be managed with discipline. FX sentiment is retail-short heavy (~57%), so a clean reclaim could trigger a short squeeze and accelerate into higher liquidity pools.
Trade idea: look for longs only with confirmation from demand, targeting 1.1700 → 1.1750 → 1.1800/1.1820; a break below the base invalidates the setup and shifts bias back bearish toward 1.1570/1.1535.

AUD/USD: Bull Trap Incoming?AUD/USD is showing clear signs of a slowdown in the bullish trend after December’s impulse, with price now consolidating below a key supply area and within a structure that is starting to lose momentum. On the daily chart, the market delivered a clean directional move, but the current phase is typical of a context where institutional players begin to distribute gradually, while retail traders tend to enter late, chasing the trend. This makes the current zone a major decision area: either price breaks higher and accelerates, or it triggers a bearish rotation into the demand blocks below.
From a technical standpoint, price action highlights a recent top in the 0.6740–0.6760 area, followed by an immediate rejection and pullback. At the moment, AUD/USD is trading within a balance zone between 0.6660–0.6685, which acts as a “holding” range where the market could attempt one last recovery before a potential breakdown. The key point is that the structure is becoming increasingly fragile: bounces are less explosive and price is no longer printing progressive highs with the same efficiency.
The most attractive probabilistic scenario is tied to a bearish rotation: a clean breakdown below the 0.6660 level would significantly increase the odds of a move into the first intermediate demand zone around 0.6600–0.6620, with a potential extension toward the deeper demand block between 0.6450–0.6520 (the area where the market previously accumulated before the bullish impulse). This lower zone represents the natural “magnet” if distribution completes, as it aligns with liquidity and a prior rebalancing area within the trend.
Daily RSI is also losing strength and normalizing, consistent with a market shifting from an impulsive phase into a corrective one. In this type of environment, the most dangerous moves are “W-shaped” patterns or sharp spikes above recent highs, as they often serve to grab liquidity before reversing aggressively. For this reason, the 0.6740–0.6760 range remains the ideal zone to monitor for a potential fake breakout, followed by a drop back below 0.6700 as a weakness trigger.
Looking at the COT report, Australian Dollar positioning shows Non-Commercial traders still net short (short exposure higher than long exposure). Meanwhile, the Dollar Index also shows a speculative component leaning short, but with dynamics that require caution: if USD finds macro support, even for a technical rebound, AUD/USD would automatically become vulnerable. The key takeaway is that we do not have a “clean bullish” positioning backdrop for AUD, making an extended rally less sustainable without a fresh accumulation phase.
From an FX sentiment perspective, the signal is extremely clear: the majority of traders are short AUD/USD (87%), with only 13% long. This matters because, from a contrarian angle, it could still fuel one final upside push via a short squeeze. However, when price is trading below supply and fails to progress, such an extreme sentiment imbalance can also act as a trap signal: if the market breaks lower, many shorts already in position may take profits too early, while late longs get liquidated, accelerating the downside move.
Finally, seasonality on AUD/USD suggests that January is often not a linear month: the market frequently experiences rotation and rebalancing phases after year-end trends. This fits perfectly with the idea of a mean reversion / pullback phase before any potential new directional cycle.
Operational conclusion: as long as AUD/USD remains below 0.6740–0.6760, the bias stays for a controlled correction, with downside acceleration risk below 0.6660. My focus is on a distribution pattern followed by a rotation toward 0.6600 and then 0.6450–0.6520, while keeping the alternative scenario open for one last bullish liquidity grab before the real move unfolds.

CADJPY – Bullish Structure IntactOn the CADJPY daily chart, price is trading within a well-defined bullish structure, characterized by higher highs and higher lows and supported by an ascending dynamic trendline. Following the impulsive move into the 114.50–115.00 area, the market is currently undergoing a consolidation phase below a daily supply zone, with compressed highs and a short-term loss of momentum. This price behavior is consistent with a technical pause rather than a structural reversal, especially considering that the lower demand areas between 112.50–111.00 remain clean, well-defended, and aligned with previous breakout levels.
From a COT perspective, the outlook remains constructive for CADJPY. On the CAD side, Commercials are showing a renewed increase in net long exposure, while JPY positioning continues to reflect structural weakness, leaving the market exposed to further carry-driven flows. January seasonality reinforces this setup: historically, the Japanese yen tends to underperform during this month, while the Canadian dollar shows relative stability, creating a favorable backdrop for a bullish continuation after potential pullbacks.
On the FX sentiment side, retail positioning is heavily skewed to the short side (above 70%), providing a clear contrarian signal. The majority of market participants remain positioned against the prevailing trend, increasing the probability of continuation once weak hands are flushed out.
In summary, CADJPY remains medium-term bullish, with a preference for long exposure on pullbacks into daily demand. Only a decisive and confirmed break below 111.00 would invalidate the constructive scenario and require a reassessment of the directional bias.

EURUSD at a Turning Point: Bull Trap Rally Into SupplyRight now, EURUSD is trading within a very clean daily structure, where price is essentially “compressed” between two major forces: a higher-timeframe supply zone overhead and a strong daily demand zone below. After the latest bearish leg, price is rotating back toward the lower side of the range again, and this is exactly the type of area where institutional money makes real decisions: either defend demand and rotate higher, or break the base and trigger continuation into deeper liquidity. From a pure price action perspective, the market is not trending aggressively at the moment, it’s transitioning, and transition phases are where traders either catch their best trades… or get chopped if they force entries too early.
On the daily chart, the most important element is the major demand area below current price, which has already acted as a pivot for bullish rotations in the past. This zone is not just a generic “support”: it’s a real liquidity pocket where buyers previously stepped in with enough strength to reverse momentum. Price is now revisiting that same area again after rejecting the upper side of the structure, and the reaction here will likely define the directional flow over the next 1–3 weeks. Above, the chart shows a well-defined supply zone sitting under a descending trendline. This creates a classic “sell-the-rally” environment, unless the market proves otherwise through a clear daily reversal sequence.
Technically, the current downside move looks more like a controlled retracement than panic selling. Price is bleeding lower into demand, and that usually opens two scenarios: the first is a rotation long from demand back into the mid-range/premium area, and the second is a “fake bounce” that fails under resistance and leads to a bearish breakdown continuation. The projected path on the chart highlights exactly this concept: a potential rebound into the grey zone (where sellers can re-enter), followed by a deeper push lower if bulls fail to reclaim structure.
From an RSI perspective, the market is pushing into oversold territory on the daily, which supports the idea that selling at these levels may be “late.” Oversold doesn’t mean “buy immediately,” but it does increase the probability of a bounce, especially when it aligns with a demand zone.
Looking at positioning, the COT picture is sending a key message: the Euro side is not positioned as a strong bullish story right now. In the Euro FX report, Large Speculators remain net long, but positioning is not extreme and the longer-term COT index is still relatively depressed. This suggests EUR is not in a “crowded long” state that would fuel an explosive bullish continuation. On the USD side, the COT index is higher, signaling that the market still holds a structural bias toward USD strength. This combination supports the idea that any EURUSD upside is more likely to be corrective/rotational, rather than the start of a new macro bull trend — unless price breaks and holds above the key daily supply.
Seasonality adds another layer: EURUSD in January often shows choppy and mixed performance early in the month, with direction becoming clearer later on.
Finally, FX sentiment shows around 60% of retail traders currently long EURUSD, versus 40% short. This isn’t an extreme reading, but it still leans toward a classic contrarian interpretation: retail is already positioned for upside while price remains in a technically vulnerable area. From an execution standpoint, this means that if EURUSD bounces from demand, it can still be a valid long, but it should be treated as a tactical long, not a “buy and hold” narrative. And if the bounce fails under resistance, sentiment positioning can amplify the downside move as late longs get trapped.
At this stage, my bias is neutral with a slight bearish tilt on the broader picture, but bullish for a short-term rotation if demand prints a strong and credible daily reaction. The key is not predicting direction, it’s reacting to confirmation at the most important location on the chart.

GBPNZD: Retail Is 68% Long…GBPNZD is trading around 2.3269 and after the strong rally we’ve seen, this feels like a zone where price may “breathe” a bit before the next move. In simple terms: we’re already high, so this is not the best place to chase a fresh long. Around this area (roughly 2.33–2.35), the market usually does one of two things: either it breaks and keeps running, or it delivers a classic “messy move” where it first flushes late buyers and then continues higher.
My base case is the second scenario: a pullback first, with a move down into the 2.305–2.300 zone, which is the most logical area where real buying interest could step in.
I still like the GBP-stronger-than-NZD idea. The COT positioning supports that NZD is structurally weaker than GBP, so even if we get a short-term drop, I don’t see it as a trend reversal, more like a reset before the next leg.
Seasonality also helps the bias: January tends to be mildly supportive for GBP, while NZD doesn’t really shine in this period. That’s why, in my view, any aggressive short from here is only a tactical pullback trade, not something I’d want to hold as a long-term bearish swing idea.
One more key point: retail sentiment is already heavily skewed long (around 68% long). And when the crowd is stacked on one side, the market often pulls a fake move first, shaking people out, hitting stops, and only then delivering the clean continuation. That’s exactly why I’d rather not buy up here.
Plan: I’m treating this area as “sell to buy lower.” Either price rejects from here and pulls back into 2.305–2.300, or I stay patient and wait for price to reach that zone and show confirmation before looking for a long with better upside and less stress. The only thing that would invalidate the pullback idea is strong acceptance above the 2.345–2.35 area, because if price holds above that zone, it’s not pulling back… it’s simply continuing.

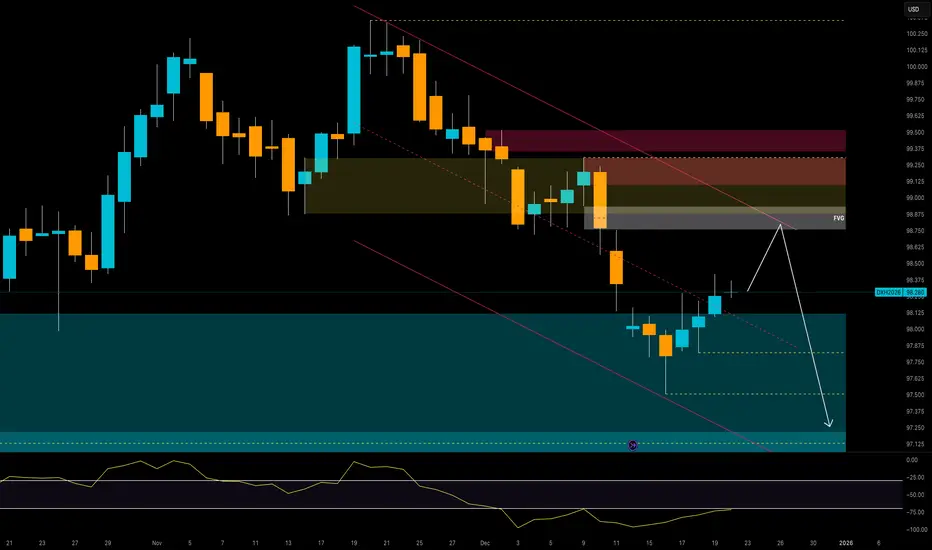
USDCAD The Asset is currently moving upwards, but a shift in institutional positioning tracked via COT and upcomming resistance zone suggests for sell side move. with an additional confirmation FRVP Gap

USDJPY – Structural Bullish ContinuationUSDJPY remains structurally bullish on the daily timeframe, with price continuing to respect an ascending channel that has been intact since Q4. The recent consolidation phase above prior daily demand has allowed the market to absorb supply without breaking structure, confirming strong underlying demand pressure. From a price action perspective, the pair is printing higher lows within the channel, while the most recent impulsive leg has reclaimed the mid-range equilibrium, suggesting continuation rather than distribution. The current pullback scenario appears corrective and controlled, with no signs of structural weakness as long as price holds above the daily demand zone around 154.50–155.00. From a COT standpoint, non-commercials remain net long Japanese Yen futures, but recent changes show a reduction in long exposure rather than aggressive short building. This typically aligns with trend continuation phases in USDJPY, especially when paired with rising open interest on USD Index futures, signaling sustained USD strength rather than exhaustion. Retail sentiment remains heavily skewed to the short side, with approximately 78% of traders positioned against the move. This persistent bearish crowd positioning acts as a contrarian fuel, increasing the probability of further upside expansion as stops remain above recent highs. From a seasonality perspective, January historically favors USDJPY strength, with positive average performance across 5, 10, and 20-year datasets. While short-term volatility is expected mid-month, the broader seasonal bias supports continuation rather than reversal. Conclusion: As long as price holds above the daily demand zone and maintains channel structure, USDJPY remains a buy-on-dips market. Upside targets remain aligned with the upper channel resistance and the 160.50–161.50 supply zone, where profit-taking and structural reassessment become relevant.

Long Idea On Canola (RS1!)Based on :
- Cot commercial extremes
- Volume profile,avwap and 2 demand zones

EUR/USD – When COT, Seasonality and Price Action Align BearishPrice has completed a bullish impulsive leg and reached a key daily supply zone around 1.1780–1.1800, where a clean and well-structured bearish reaction developed. The break of the ascending channel, followed by a sequence of lower highs and lower lows, confirms a daily structure shift.
Price is now rotating lower toward an initial intermediate demand area at 1.1620–1.1580, a technically relevant zone where a corrective bounce is statistically possible. However, the main liquidity magnet remains the deeper daily demand at 1.1560–1.1500, still unmitigated and representing the primary bearish extension scenario.
The technical bias remains short as long as price stays below the 1.1720–1.1740 resistance area.
2. COT Report – EUR vs USD
On EURO FX futures (CME), Commercials remain heavily net short, consistent with a distribution phase following the recent rally. Non-Commercials are still net long, but without meaningful expansion, a typical configuration near a medium-term top.
On the U.S. Dollar Index, Commercials maintain a structural net long position, while Non-Commercials are gradually reducing short exposure. This positioning supports the view of a USD stabilization phase, aligning with a broader corrective bearish continuation on EUR/USD.
3. Seasonality
Historical seasonality shows that January is on average a weak month for EUR/USD, particularly during the second half of the month. After an initial sideways phase, the pair statistically tends to develop downside pressure, with lows often printed between mid and late January.
This seasonal pattern favors short continuation or sell-on-rallies scenarios, rather than fresh bullish expansions.
4. Retail Sentiment
Retail sentiment shows a majority of long positions (around 54%), while price continues to move lower. This classic price–sentiment divergence reinforces the bearish bias, suggesting the market is moving against the retail crowd, as typically observed during directional corrective phases.

GBP/USD Daily: Bullish Structure IntactGBP/USD remains embedded within a well-defined bullish structure, characterized by higher highs and higher lows and supported by an ascending channel in place since the November lows. Following the strong December bullish impulse, price is currently consolidating below a key daily supply zone between 1.3500 and 1.3600, an area that has previously triggered profit-taking and bearish reactions.
The ongoing pullback is developing in an orderly manner, with no structural breakdowns so far, and is guiding price back toward a daily demand / equilibrium zone between 1.3350 and 1.3400, which aligns with the mid-range of the channel and former broken highs. As long as price holds above this area, the structural bias remains constructively bullish, with scope for continuation toward range highs and a potential extension into the 1.3700–1.3800 area. A clean and confirmed loss of the daily demand zone would invalidate the medium-term bullish scenario.
COT Report (British Pound & USD Index)
The COT data on British Pound futures still reflects a mixed but improving picture. Non-Commercials remain net short; however, a reduction in short positions compared to previous weeks suggests that speculative bearish pressure is gradually being absorbed.
On the USD Index side, Non-Commercials maintain a net short exposure, while Commercials continue to increase long hedging activity, pointing to a structurally fragile US dollar in the medium term. The combination of a stabilizing GBP and a still-weak USD continues to support a bullish underlying scenario for GBP/USD, particularly on controlled pullbacks.
Seasonality
January seasonality for GBP/USD shows a generally positive historical bias, especially during the second half of the month, with stronger performance when price follows a consolidation phase after a prior bullish impulse. Current price action aligns well with this historical pattern: a pause, liquidity absorption, and the potential for renewed upside later in the month, in line with macro conditions and positioning.
Sentiment (Retail Positioning)
Retail sentiment is currently balanced (50% long / 50% short), a neutral condition that reduces the risk of aggressive contrarian signals. Such a distribution typically favors cleaner directional moves, especially when supported by a coherent technical structure and macro backdrop. The absence of excessive retail positioning strengthens the view that any downside moves are more likely corrective rather than the start of a genuine bearish trend.
Operational Conclusion (Bias)
Medium-term bullish bias, with a preference for buy-the-dip opportunities around the daily demand zone. As long as price holds above 1.3350–1.3400, the bullish continuation toward 1.3600 and potentially 1.3700 remains valid. A cautious approach is warranted near supply, with aggressive positioning only upon clear structural confirmation.

EURCAD: Smart Money Trap LoadingMacro / COT
The latest COT data paints an interesting picture:
EUR – Non-Commercials remain heavily net-long, and long exposure continues to increase. This indicates that a large portion of speculative capital is already positioned to the upside.
CAD – Commercials are accumulating long exposure, while Non-Commercials are reducing longs and adding shorts.
From a Smart Money perspective, when commercials accumulate, they historically tend to anticipate medium-term reversals. This increases the probability that EURCAD is entering a distribution phase.
Seasonality
Historically, January is not supportive for the Euro. Multi-timeframe seasonality data (2–20 years) shows a negative tendency during the early part of the year.
This reinforces a medium-term bearish bias, especially after technical relief rallies.
Retail Sentiment
Currently, 73% of retail traders are SHORT EURCAD.
Such an extreme imbalance increases the probability of a temporary bullish squeeze, often used to clean weak retail shorts before the real directional move takes place.
In other words: bullish spike first → potential bearish reversal afterwards.
Price Action — Daily Chart
On the daily chart, price is trading inside a descending channel and bouncing from lower demand, moving toward a key supply area between 1.6180 – 1.6250.
The technical structure suggests:
1️⃣ Potential push higher into supply
2️⃣ Reaction and shift in structure
3️⃣ Targets around 1.6000 – 1.6030
RSI confirms weak momentum on rallies — an ideal context to sell a deep retracement rather than chase breakouts.
Key Levels
Sell Zone: 1.6180 – 1.6250
Target: 1.6030 → extension 1.5980
Invalidation: Daily close above 1.6300
This scenario remains valid as long as price does not structurally break above the supply block.

EURGBP | Retail 80% Long: Selling the RallyOn the daily timeframe, EURGBP continues to move inside a well-defined descending channel. The latest bearish impulse pushed price directly into the 0.865–0.860 demand zone, where we’re seeing an initial technical reaction — but still no clear signs of a full reversal.
RSI is hovering near oversold territory, which increases the probability of a corrective bounce. However, as long as price stays below the 0.872–0.878 supply area, the dominant bias remains bearish.
The COT report provides a more structural perspective:
institutional traders remain net long EUR and net short GBP, meaning that — in the medium term — the broader context still favors a bullish EURGBP. However, in recent weeks we’ve noticed:
• a slowdown in the growth of EUR long positions
• early signs of short covering on GBP
This does not invalidate the EUR>GBP narrative, but it does suggest that the euro’s advantage is weakening.
Seasonality in January is historically slightly negative for EURGBP: the month often starts with weakness and only stabilizes later. This is consistent with the current downside move.
Retail sentiment, on the other hand, is extremely skewed:
more than 80% of retail traders are long EURGBP.
From a contrarian perspective, this supports the idea of further downside.
Overall picture suggests:
• bearish technical structure
• COT still pro-EUR, but losing momentum
• unfavorable seasonality
• retail heavily exposed on the long side
For that reason, I currently treat EURGBP as a “sell the rally” market:
any rebounds into 0.872–0.878 (or mid-channel) may offer short setups with potential targets:
→ 0.860
→ 0.855
→ and, in extension, deeper liquidity pockets below
The bearish bias would be invalidated only by a daily close above 0.880–0.882, especially if supported by renewed COT strength and an improvement in sentiment.

GOLD | Pullback in the making? Watching the FVG and demand zoneGold continues to trade inside a well-defined bullish channel on the daily chart, but the last vertical expansion has created vulnerability to deeper pullbacks. The strong impulse followed by rejection signals profit-taking and a potential transition from momentum phase to corrective phase.
In the short term, price may complete a technical bounce toward the midline of the channel, before potentially rotating lower into the Fair Value Gap around 4.240–4.260. A breakdown below this area would open room toward lower demand zones, aligned with previous institutional order flow still unmitigated.
RSI has exited overbought territory, indicating waning momentum and consistent with a trend-normalization phase.
Positioning:
The COT report shows Non-Commercials increasing long exposure, supporting a medium-term structural bullish bias. However, the simultaneous expansion of shorts highlights growing hedging activity and the potential for corrective volatility.
Seasonality for January historically shows positive average performance, but often after interim drawdowns — reinforcing the idea of a technical pullback before any renewed extension higher.
Retail sentiment remains predominantly long. Typically, when most traders are positioned in the same direction, the probability of contrarian moves increases, adding weight to the short-term downside scenario.
Trading bias:
Medium-term bullish, but preference remains for entries on deeper pullbacks into value areas rather than chasing late breakouts.
Key levels:
• 4.560 — upper channel resistance
• 4.260 — FVG and first liquidity zone
• 4.170-4.200 — intermediate demand
• 4.000-4.070 — primary strategic demand zone
Plan:
Wait for a retracement into marked zones and look for clear accumulation patterns and bullish re-engulfing confirmations before considering new long positions.

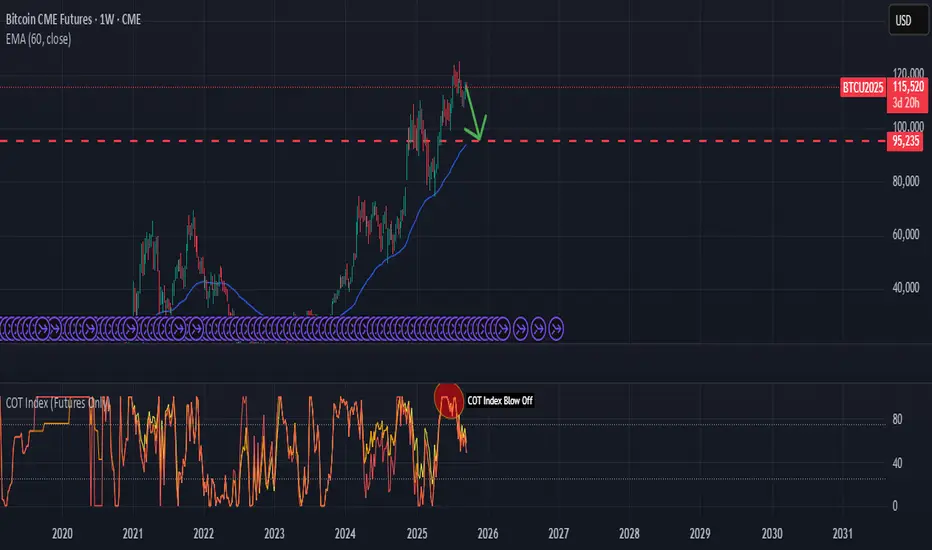
Bitcoin Blow-Off TopBitcoin is showing signs of exhaustion after a strong rally into the $120k region. On the weekly timeframe, several signals point toward a potential corrective leg lower:
📊 Key Technicals
Major Supply Zone: $115k–$120k area has acted as resistance, with sellers defending this level.
Trend Structure: Price has broken momentum after the blow-off move and is now trading below recent highs.
EMA Support: Price is extended above the EMA 60 (94k), leaving room for mean reversion.
COT Data: Commercials are heavily net short with a COT Index blow-off signal, indicating distribution from strong hands to weak hands.
🎯 Trade Thesis
The risk-reward favors the short side from current levels.
Initial downside target sits at the $95k region (prior resistance turned support + EMA alignment).
A break of that level could open the door toward the $80k handle in the medium term.
📌 Plan
Entry: 114k–116k
Stop: Above 120k
Targets:
TP1: 95k
TP2: 80k
💡 This setup combines market structure, supply zone rejection, and institutional positioning via COT. The technical picture suggests Bitcoin is vulnerable to a deeper pullback before any further sustainable rally.
NZD/USD Daily: Corrective Bounce Toward Key SupplyBase bias: short-term corrective upside → potential sell zone higher.
Macro context: the USD remains supported by institutional positioning and a resilient US macro backdrop, while NZD continues to look vulnerable.
1️⃣ Technical Structure (Daily)
Price reacted strongly from the daily demand area (blue zone) after filling part of the prior impulse. A higher low has formed and price is currently trading inside/around a fair value gap (FVG) aligned with the ascending trendline.
A continuation toward the 0.5840–0.5880 supply zone remains possible.
As long as price holds above 0.5720–0.5740, the corrective recovery remains intact; a breakdown below that area increases the probability of a move back toward prior lows.
RSI is recovering from weakness, consistent with a corrective bounce rather than a confirmed structural reversal.
2️⃣ COT (Commitments of Traders)
USD Index: non-commercials remain broadly positioned pro-USD / short NZD. Recent flows show renewed support for the dollar.
NZD Futures: non-commercials remain significantly net short. The recent uptick in longs is marginal compared with the broader bearish imbalance.
Overall, institutional positioning continues to suggest medium-term downside pressure on NZD. Rallies into key supply zones are more likely to be sell opportunities.
3️⃣ Retail Sentiment
Retail traders are ~64% long NZD/USD. Historically, persistent retail long skew often precedes contrarian downside moves.
4️⃣ Seasonality
January has historically been weak to neutral-weak for NZD/USD, with average returns below other months and wide variability.
Seasonality does not support a sustained bullish trend and aligns more with a temporary bounce followed by renewed selling pressure.

GBPUSD – Daily Bullish Channel While Specs Stay ShortOn the daily chart GBPUSD is still respecting a clear bullish channel from the November lows. Price just reacted from a previous imbalance / FVG around 1.34 and is consolidating inside a broader supply zone, but structure remains constructive as long as we hold the mid–lower part of the channel.
1. Daily structure
After the October–November selloff, GBPUSD has been making higher highs and higher lows inside an ascending channel. Current price is trading around the mid-range of that channel, with a small pullback into the daily FVG / demand around 1.3360–1.3430. As long as daily closes hold above this block and the lower trendline, the path of least resistance remains to the upside, with room into the higher supply layers between 1.3550–1.3600 and above.
2. COT data (GBP & USD Index)
GBP futures: non-commercials are still net short, but they have started to cover shorts (short positions decreasing while longs tick higher). This suggests the pain trade is still to the upside if price continues to grind higher. Commercials are net long GBP, which fits with accumulation into prior lows. USD Index futures: specs are slightly net short USD, which reinforces a softer-USD backdrop and supports a bullish bias on GBPUSD as long as risk sentiment does not deteriorate sharply.
3. Seasonality
Seasonality on GBPUSD shows that recent years (5–10Y and especially 2Y) tend to favour mild GBP strength into late December / early January, while the very long-term average is more neutral. I interpret this as a supportive, but not decisive, tailwind: seasonality aligns with the current bullish structure but is not a stand-alone signal.
4. Sentiment
Retail traders are slightly net short into a rising market – a contrarian bullish signal, but not yet at an extreme. This fits with the idea of buying dips while the crowd tries to fade the trend.

EURUSD: Extended rally into daily supplyOver the past few weeks, EURUSD has continued to extend higher, pushing deep into a daily supply zone that overlaps with a previous distribution area. The ascending channel is still intact, but I’m starting to see some loss of momentum and the first signs of selling pressure within the 1.1780–1.1850 range.
On the daily chart, price has left a potential imbalance open, with a more interesting demand structure sitting between 1.1700 and 1.1650. If recent lows are taken out, I would expect price to rotate back into that zone to fill liquidity and test buyer strength. Only a clean break and hold above 1.1850 would invalidate the corrective scenario and reopen the path toward higher highs.
The COT data shows:
Non-commercials remain net long on the euro, but positioning is not increasing as aggressively as in previous months.
On the Dollar Index, non-commercials still hold a meaningful short exposure, but they’ve been gradually reducing it.
In my view, this suggests a market that may have already priced in much of the pro-euro bias, creating room for a short-term technical reset.
Seasonality
Historically, December tends to be positive for EURUSD, but the final part of the month often brings volatility and rebalancing flows — consistent with the idea of a pullback before any renewed extension.
Retail sentiment
Current sentiment shows roughly 81% of retail traders short.
Typically, that’s a contrarian bullish signal. However, given that we’re trading inside supply and the structure is stretched, I interpret it as the uptrend is still alive, but the risk of a corrective phase is increasing.
Invalidation
This corrective view is invalidated with daily closes above 1.1850 and strong continuation inside the channel.

EURCAD: Pullback First, Then Potential BreakdownSeasonality shows that EUR tends to be moderately bullish in December, especially when looking at 5–10 year horizons, while CAD typically experiences mild weakness during the same period and historically regains strength between January and February. In the short term, this means seasonality favors EUR over CAD, but as we move into the new year the balance shifts toward CAD appreciation. This creates a favorable environment for waiting on technical pullbacks first and then looking for selling opportunities at higher levels.
Retail sentiment currently shows roughly 54% short positions versus 46% long, indicating that positioning is not extreme, yet traders are slightly biased to the short side. Historically, when retail is predominantly short, price tends to remain supported for a while before eventually reversing. As a result, there may still be room for bullish retracements in the very short term, although this does not change the broader bearish context.
From a COT perspective, speculators appear to be covering CAD short exposure, which is supportive for CAD in the medium term, while EUR is attracting additional long interest but not at extreme levels. Overall, this suggests that upside in EURCAD is likely limited and the risk of a medium-term reversal remains elevated.
Technically, price is trading within a descending channel that has been respected multiple times and is currently testing a demand zone, which may generate a short-term reaction. RSI has not yet completed a full bullish divergence, indicating that one more bounce remains possible, while the daily structure continues to print lower highs and lower lows. A potential rebound toward the 1.6120–1.6150 area, where former support may now act as supply, would allow the market to retest structure before resuming the dominant downtrend.

USD/CAD at a Turning Point: Smart Money vs Retail CrowdTechnical Context (Macro View)
USD/CAD has completed a distribution phase following the rally of recent months and is now rotating decisively back into a broad daily demand area between 1.3650 and 1.3550, a zone that has historically generated strong directional reactions. Short-term structure remains bearish, but price is now trading within a potential absorption area, with RSI compressed in the lower range, consistent with bearish momentum exhaustion. From a structural standpoint, this is not an environment to chase extended shorts, but rather to monitor for technical long reactions from high-value support.
COT Report (Commitments of Traders)
USD Index: Non-Commercials are net short, accompanied by a significant contraction in overall open interest, signaling a loss of structural strength in the US dollar following the previous bullish excess.
Canadian Dollar (CAD): Non-Commercials are heavily net short CAD, while Commercials continue to absorb, a classic setup often preceding a potential inversion or corrective rebound in CAD.
Retail Sentiment
79% of retail traders are long USD/CAD, while only 21% are short. This highlights a strong retail exposure positioned against the recent bearish move. However, context is key: sentiment is already at extreme levels, but price is now sitting at an institutional support area, increasing the probability of a short squeeze or technical rebound rather than an immediate continuation of downside extension.
Seasonality
Historical seasonality for USD/CAD shows that late December to early January often favors consolidation phases or rebounds. Data over 5, 10, and 20 years indicate a bearish pressure that progressively loses strength, with frequent mean-reversion dynamics.
Seasonal Conclusion: current timing aligns with a potential rebound or pause in the bearish trend, rather than the start of a fresh downside acceleration.

EURJPY: Bullish Trend Under Pressure | COT & SeasonalityEURJPY remains in a well-defined medium-term bullish trend on the daily timeframe, characterized by a clear sequence of higher highs and higher lows within an ascending channel. The latest impulse pushed price above the upper boundary of the channel, an area where historically the market tends to lose momentum and attract profit-taking. Recent candles confirm this behavior, showing fading momentum and early corrective closes, consistent with a consolidation or technical pullback phase rather than trend exhaustion.
From a technical perspective, the 181.00–180.00 area stands out as a key zone of interest. This region aligns with a daily fair value gap, a prior consolidation base, and the dynamic support of the ascending channel. As long as price holds above this zone, the broader bullish structure remains intact. Any retracement into this area should be interpreted as corrective price action within the trend, not as a reversal. Only a clear and sustained break below 179.80 would open the door to a deeper correction toward the lower demand zone.
The COT report reinforces the idea of slowing upside momentum. On the JPY side, non-commercial traders continue to increase short positions, indicating persistent bearish expectations on the yen. However, the sharp rise in open interest suggests a mature trend environment, where the risk of corrective squeezes increases. On the EUR side, commercials remain heavily net short, a typical hedging behavior when prices trade at elevated levels. This divergence points to limited short-term upside potential for EURJPY.
Seasonality adds further context. December is historically supportive for the euro, while the Japanese yen tends to strengthen toward year-end. This mixed seasonal backdrop favors a phase of unstable equilibrium, with higher probability of consolidation or corrective moves rather than aggressive bullish continuation.
Looking at FX sentiment, retail positioning is heavily skewed to the short side on EURJPY. While this contrarian signal has supported the bullish trend in previous phases, near technical extremes such imbalance loses directional strength and increases the likelihood of orderly pullbacks before any potential trend resumption.
Operational conclusion: the broader bias remains bullish, but in the short term a corrective or consolidation phase is more likely. The 181.00–180.00 zone is the key area to monitor for potential bullish reactions aligned with the primary trend. Caution is warranted near highs, with greater focus on confirmed price action signals at value areas.

US Dollar Index – Temporary Relief Before Further Downside?The US Dollar Index continues to trade under structural pressure on the daily chart, following the strong downside impulse that broke November’s value area and pushed price into a key weekly demand zone around 97.90–97.30. After a clear momentum swing lower, the index is now showing early signs of corrective strength, but the broader context continues to favor weakness into year-end.
On the technical side, price has reacted from support and is attempting a corrective retracement toward the 98.75–99.00 supply zone. This zone aligns with:
– Daily bearish trendline resistance
– A fresh Fair Value Gap (FVG)
– Previous structure imbalance
If price completes this pullback, the zone provides a high-probability region for bearish continuation targeting new lows into 97.50–97.20. The RSI remains below the midline, indicating momentum has not fully shifted to the upside and that current strength is corrective, not impulsive.
Seasonality reinforces this bearish narrative. December historically records negative averages in the Dollar Index across virtually every timeframe. The 20-year average in particular shows strong downward pressure late in the month, with typical weakness accelerating into year-end. Current price action is consistent with this seasonal pattern.
From a positioning standpoint, the latest COT report shows Non-Commercial traders significantly net short, with shorts sitting at 28,652 vs. longs at 14,778. This imbalance continues to reflect confidence in downside continuation. At the same time, the Commercial category reduced long exposure and increased shorts, adding further weight to bearish bias. The aggregate positioning structure is clearly aligned with the existing downtrend.
Overall, the Dollar Index remains structurally bearish. A final upside correction into the 98.75–99.00 supply zone could precede the next leg lower. Only a clean break and close above 99.20 would weaken the bear case and signal a potential shift in directional bias. Until then, rallies remain sell-side opportunities.
GBP/USD Ready for a Year–End Breakout?Daily Technical Analysis
GBP/USD is currently trading around the 1.337 area, holding above a rising channel structure after breaking through the 1.322 demand zone at the start of December. Recent daily candles show slowing bullish momentum under a higher–timeframe supply zone extending toward 1.345–1.355 and potentially 1.360.
The technical outlook suggests a possible short–term pullback: a liquidity sweep below daily lows could bring price back toward the lower trendline and potentially into the 1.331–1.324 area before any continuation higher.
Bullish invalidation remains below 1.322.
The bullish continuation target remains 1.345, with potential extension toward 1.360 if momentum holds.
COT Positioning
Non–Commercials remain heavily short on the British Pound relative to longs (135,834 vs 60,319 contracts), indicating that most speculative positioning remains bearish on GBP. However, the latest weekly update shows a significant increase in long positions (+8,067) and a smaller increase in shorts (+3,402), suggesting a gradual sentiment shift with underlying bullish accumulation.
On the USD Index side, speculative positioning remains net short (28,652 short vs 14,778 long). Combined, this creates a medium–term directional bias supportive of GBP/USD upside: strengthening GBP + weakening Dollar Index is a potentially expansive backdrop.
Retail Sentiment
Retail sentiment currently shows 52% short and 48% long on GBP/USD. This is nearly neutral but slightly contrarian bullish, as the marginal majority of short positioning runs against the recent trend. Any pullback may encourage further retail short exposure, potentially setting up a bullish rotation afterwards.
Seasonality - December Bias
Seasonality confirms a historically bullish tendency in December:
– 20–year average: slightly positive
– 15–year average: positive
– 10–year average: slightly positive
– 5–year average: strongly positive
– 2–year average: strongly positive
This reinforces the potential for year–end upside continuation and supports a bullish narrative above 1.345 following any corrective pullback.
Trade Outlook
The base scenario remains a short–term pullback into key levels, followed by potential bullish continuation toward upper supply zones.
Short–term pullback zone: 1.331–1.324
Bullish continuation zone: 1.345–1.355
Primary extension target: 1.360
Conclusion
GBP/USD maintains a bullish daily structure. Despite heavy speculative short positioning, recent COT flows, positive seasonality, and balanced retail sentiment continue to support the idea of further upside into year–end. Technically, price is approaching a decision level below 1.345: I will be watching for a structured pullback before assessing the next bullish leg toward 1.360.
A break below 1.322 would invalidate the bullish structure and return price to a deeper accumulation phase.
