NZD/USD Daily: Corrective Bounce Toward Key SupplyBase bias: short-term corrective upside → potential sell zone higher.
Macro context: the USD remains supported by institutional positioning and a resilient US macro backdrop, while NZD continues to look vulnerable.
1️⃣ Technical Structure (Daily)
Price reacted strongly from the daily demand area (blue zone) after filling part of the prior impulse. A higher low has formed and price is currently trading inside/around a fair value gap (FVG) aligned with the ascending trendline.
A continuation toward the 0.5840–0.5880 supply zone remains possible.
As long as price holds above 0.5720–0.5740, the corrective recovery remains intact; a breakdown below that area increases the probability of a move back toward prior lows.
RSI is recovering from weakness, consistent with a corrective bounce rather than a confirmed structural reversal.
2️⃣ COT (Commitments of Traders)
USD Index: non-commercials remain broadly positioned pro-USD / short NZD. Recent flows show renewed support for the dollar.
NZD Futures: non-commercials remain significantly net short. The recent uptick in longs is marginal compared with the broader bearish imbalance.
Overall, institutional positioning continues to suggest medium-term downside pressure on NZD. Rallies into key supply zones are more likely to be sell opportunities.
3️⃣ Retail Sentiment
Retail traders are ~64% long NZD/USD. Historically, persistent retail long skew often precedes contrarian downside moves.
4️⃣ Seasonality
January has historically been weak to neutral-weak for NZD/USD, with average returns below other months and wide variability.
Seasonality does not support a sustained bullish trend and aligns more with a temporary bounce followed by renewed selling pressure.
COT

GBPUSD – Daily Bullish Channel While Specs Stay ShortOn the daily chart GBPUSD is still respecting a clear bullish channel from the November lows. Price just reacted from a previous imbalance / FVG around 1.34 and is consolidating inside a broader supply zone, but structure remains constructive as long as we hold the mid–lower part of the channel.
1. Daily structure
After the October–November selloff, GBPUSD has been making higher highs and higher lows inside an ascending channel. Current price is trading around the mid-range of that channel, with a small pullback into the daily FVG / demand around 1.3360–1.3430. As long as daily closes hold above this block and the lower trendline, the path of least resistance remains to the upside, with room into the higher supply layers between 1.3550–1.3600 and above.
2. COT data (GBP & USD Index)
GBP futures: non-commercials are still net short, but they have started to cover shorts (short positions decreasing while longs tick higher). This suggests the pain trade is still to the upside if price continues to grind higher. Commercials are net long GBP, which fits with accumulation into prior lows. USD Index futures: specs are slightly net short USD, which reinforces a softer-USD backdrop and supports a bullish bias on GBPUSD as long as risk sentiment does not deteriorate sharply.
3. Seasonality
Seasonality on GBPUSD shows that recent years (5–10Y and especially 2Y) tend to favour mild GBP strength into late December / early January, while the very long-term average is more neutral. I interpret this as a supportive, but not decisive, tailwind: seasonality aligns with the current bullish structure but is not a stand-alone signal.
4. Sentiment
Retail traders are slightly net short into a rising market – a contrarian bullish signal, but not yet at an extreme. This fits with the idea of buying dips while the crowd tries to fade the trend.

EURUSD: Extended rally into daily supplyOver the past few weeks, EURUSD has continued to extend higher, pushing deep into a daily supply zone that overlaps with a previous distribution area. The ascending channel is still intact, but I’m starting to see some loss of momentum and the first signs of selling pressure within the 1.1780–1.1850 range.
On the daily chart, price has left a potential imbalance open, with a more interesting demand structure sitting between 1.1700 and 1.1650. If recent lows are taken out, I would expect price to rotate back into that zone to fill liquidity and test buyer strength. Only a clean break and hold above 1.1850 would invalidate the corrective scenario and reopen the path toward higher highs.
The COT data shows:
Non-commercials remain net long on the euro, but positioning is not increasing as aggressively as in previous months.
On the Dollar Index, non-commercials still hold a meaningful short exposure, but they’ve been gradually reducing it.
In my view, this suggests a market that may have already priced in much of the pro-euro bias, creating room for a short-term technical reset.
Seasonality
Historically, December tends to be positive for EURUSD, but the final part of the month often brings volatility and rebalancing flows — consistent with the idea of a pullback before any renewed extension.
Retail sentiment
Current sentiment shows roughly 81% of retail traders short.
Typically, that’s a contrarian bullish signal. However, given that we’re trading inside supply and the structure is stretched, I interpret it as the uptrend is still alive, but the risk of a corrective phase is increasing.
Invalidation
This corrective view is invalidated with daily closes above 1.1850 and strong continuation inside the channel.

EURCAD: Pullback First, Then Potential BreakdownSeasonality shows that EUR tends to be moderately bullish in December, especially when looking at 5–10 year horizons, while CAD typically experiences mild weakness during the same period and historically regains strength between January and February. In the short term, this means seasonality favors EUR over CAD, but as we move into the new year the balance shifts toward CAD appreciation. This creates a favorable environment for waiting on technical pullbacks first and then looking for selling opportunities at higher levels.
Retail sentiment currently shows roughly 54% short positions versus 46% long, indicating that positioning is not extreme, yet traders are slightly biased to the short side. Historically, when retail is predominantly short, price tends to remain supported for a while before eventually reversing. As a result, there may still be room for bullish retracements in the very short term, although this does not change the broader bearish context.
From a COT perspective, speculators appear to be covering CAD short exposure, which is supportive for CAD in the medium term, while EUR is attracting additional long interest but not at extreme levels. Overall, this suggests that upside in EURCAD is likely limited and the risk of a medium-term reversal remains elevated.
Technically, price is trading within a descending channel that has been respected multiple times and is currently testing a demand zone, which may generate a short-term reaction. RSI has not yet completed a full bullish divergence, indicating that one more bounce remains possible, while the daily structure continues to print lower highs and lower lows. A potential rebound toward the 1.6120–1.6150 area, where former support may now act as supply, would allow the market to retest structure before resuming the dominant downtrend.

USD/CAD at a Turning Point: Smart Money vs Retail CrowdTechnical Context (Macro View)
USD/CAD has completed a distribution phase following the rally of recent months and is now rotating decisively back into a broad daily demand area between 1.3650 and 1.3550, a zone that has historically generated strong directional reactions. Short-term structure remains bearish, but price is now trading within a potential absorption area, with RSI compressed in the lower range, consistent with bearish momentum exhaustion. From a structural standpoint, this is not an environment to chase extended shorts, but rather to monitor for technical long reactions from high-value support.
COT Report (Commitments of Traders)
USD Index: Non-Commercials are net short, accompanied by a significant contraction in overall open interest, signaling a loss of structural strength in the US dollar following the previous bullish excess.
Canadian Dollar (CAD): Non-Commercials are heavily net short CAD, while Commercials continue to absorb, a classic setup often preceding a potential inversion or corrective rebound in CAD.
Retail Sentiment
79% of retail traders are long USD/CAD, while only 21% are short. This highlights a strong retail exposure positioned against the recent bearish move. However, context is key: sentiment is already at extreme levels, but price is now sitting at an institutional support area, increasing the probability of a short squeeze or technical rebound rather than an immediate continuation of downside extension.
Seasonality
Historical seasonality for USD/CAD shows that late December to early January often favors consolidation phases or rebounds. Data over 5, 10, and 20 years indicate a bearish pressure that progressively loses strength, with frequent mean-reversion dynamics.
Seasonal Conclusion: current timing aligns with a potential rebound or pause in the bearish trend, rather than the start of a fresh downside acceleration.

EURJPY: Bullish Trend Under Pressure | COT & SeasonalityEURJPY remains in a well-defined medium-term bullish trend on the daily timeframe, characterized by a clear sequence of higher highs and higher lows within an ascending channel. The latest impulse pushed price above the upper boundary of the channel, an area where historically the market tends to lose momentum and attract profit-taking. Recent candles confirm this behavior, showing fading momentum and early corrective closes, consistent with a consolidation or technical pullback phase rather than trend exhaustion.
From a technical perspective, the 181.00–180.00 area stands out as a key zone of interest. This region aligns with a daily fair value gap, a prior consolidation base, and the dynamic support of the ascending channel. As long as price holds above this zone, the broader bullish structure remains intact. Any retracement into this area should be interpreted as corrective price action within the trend, not as a reversal. Only a clear and sustained break below 179.80 would open the door to a deeper correction toward the lower demand zone.
The COT report reinforces the idea of slowing upside momentum. On the JPY side, non-commercial traders continue to increase short positions, indicating persistent bearish expectations on the yen. However, the sharp rise in open interest suggests a mature trend environment, where the risk of corrective squeezes increases. On the EUR side, commercials remain heavily net short, a typical hedging behavior when prices trade at elevated levels. This divergence points to limited short-term upside potential for EURJPY.
Seasonality adds further context. December is historically supportive for the euro, while the Japanese yen tends to strengthen toward year-end. This mixed seasonal backdrop favors a phase of unstable equilibrium, with higher probability of consolidation or corrective moves rather than aggressive bullish continuation.
Looking at FX sentiment, retail positioning is heavily skewed to the short side on EURJPY. While this contrarian signal has supported the bullish trend in previous phases, near technical extremes such imbalance loses directional strength and increases the likelihood of orderly pullbacks before any potential trend resumption.
Operational conclusion: the broader bias remains bullish, but in the short term a corrective or consolidation phase is more likely. The 181.00–180.00 zone is the key area to monitor for potential bullish reactions aligned with the primary trend. Caution is warranted near highs, with greater focus on confirmed price action signals at value areas.

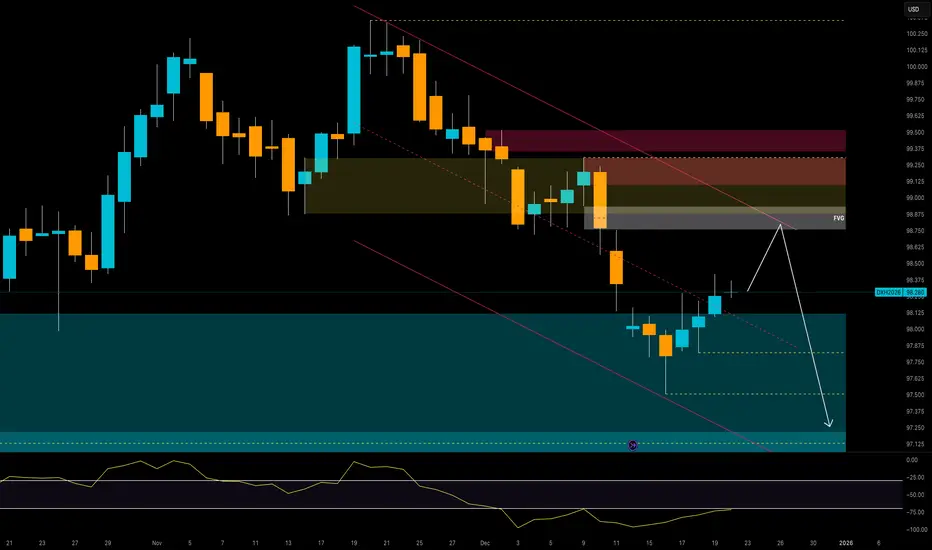
US Dollar Index – Temporary Relief Before Further Downside?The US Dollar Index continues to trade under structural pressure on the daily chart, following the strong downside impulse that broke November’s value area and pushed price into a key weekly demand zone around 97.90–97.30. After a clear momentum swing lower, the index is now showing early signs of corrective strength, but the broader context continues to favor weakness into year-end.
On the technical side, price has reacted from support and is attempting a corrective retracement toward the 98.75–99.00 supply zone. This zone aligns with:
– Daily bearish trendline resistance
– A fresh Fair Value Gap (FVG)
– Previous structure imbalance
If price completes this pullback, the zone provides a high-probability region for bearish continuation targeting new lows into 97.50–97.20. The RSI remains below the midline, indicating momentum has not fully shifted to the upside and that current strength is corrective, not impulsive.
Seasonality reinforces this bearish narrative. December historically records negative averages in the Dollar Index across virtually every timeframe. The 20-year average in particular shows strong downward pressure late in the month, with typical weakness accelerating into year-end. Current price action is consistent with this seasonal pattern.
From a positioning standpoint, the latest COT report shows Non-Commercial traders significantly net short, with shorts sitting at 28,652 vs. longs at 14,778. This imbalance continues to reflect confidence in downside continuation. At the same time, the Commercial category reduced long exposure and increased shorts, adding further weight to bearish bias. The aggregate positioning structure is clearly aligned with the existing downtrend.
Overall, the Dollar Index remains structurally bearish. A final upside correction into the 98.75–99.00 supply zone could precede the next leg lower. Only a clean break and close above 99.20 would weaken the bear case and signal a potential shift in directional bias. Until then, rallies remain sell-side opportunities.
GBP/USD Ready for a Year–End Breakout?Daily Technical Analysis
GBP/USD is currently trading around the 1.337 area, holding above a rising channel structure after breaking through the 1.322 demand zone at the start of December. Recent daily candles show slowing bullish momentum under a higher–timeframe supply zone extending toward 1.345–1.355 and potentially 1.360.
The technical outlook suggests a possible short–term pullback: a liquidity sweep below daily lows could bring price back toward the lower trendline and potentially into the 1.331–1.324 area before any continuation higher.
Bullish invalidation remains below 1.322.
The bullish continuation target remains 1.345, with potential extension toward 1.360 if momentum holds.
COT Positioning
Non–Commercials remain heavily short on the British Pound relative to longs (135,834 vs 60,319 contracts), indicating that most speculative positioning remains bearish on GBP. However, the latest weekly update shows a significant increase in long positions (+8,067) and a smaller increase in shorts (+3,402), suggesting a gradual sentiment shift with underlying bullish accumulation.
On the USD Index side, speculative positioning remains net short (28,652 short vs 14,778 long). Combined, this creates a medium–term directional bias supportive of GBP/USD upside: strengthening GBP + weakening Dollar Index is a potentially expansive backdrop.
Retail Sentiment
Retail sentiment currently shows 52% short and 48% long on GBP/USD. This is nearly neutral but slightly contrarian bullish, as the marginal majority of short positioning runs against the recent trend. Any pullback may encourage further retail short exposure, potentially setting up a bullish rotation afterwards.
Seasonality - December Bias
Seasonality confirms a historically bullish tendency in December:
– 20–year average: slightly positive
– 15–year average: positive
– 10–year average: slightly positive
– 5–year average: strongly positive
– 2–year average: strongly positive
This reinforces the potential for year–end upside continuation and supports a bullish narrative above 1.345 following any corrective pullback.
Trade Outlook
The base scenario remains a short–term pullback into key levels, followed by potential bullish continuation toward upper supply zones.
Short–term pullback zone: 1.331–1.324
Bullish continuation zone: 1.345–1.355
Primary extension target: 1.360
Conclusion
GBP/USD maintains a bullish daily structure. Despite heavy speculative short positioning, recent COT flows, positive seasonality, and balanced retail sentiment continue to support the idea of further upside into year–end. Technically, price is approaching a decision level below 1.345: I will be watching for a structured pullback before assessing the next bullish leg toward 1.360.
A break below 1.322 would invalidate the bullish structure and return price to a deeper accumulation phase.

EUR/AUD: Is This Daily Rejection the Start of a Breakdown?1. COT Positioning
The latest COT data reflects a clear divergence between EUR and AUD positioning:
• EUR futures (Non-Commercial) continue to show strong net-long positioning, with +5,367 new long contracts added and the long/short ratio holding firm. This supports medium-term EUR strength.
• AUD futures (Non-Commercial) show an opposite movement, with +6,517 new short contracts added and a further reduction in speculative long exposure. This reinforces AUD weakness.
From a COT perspective, the gap between EUR strength and AUD weakness remains wide. This does not immediately justify a deeper EURAUD downside move unless commercial positioning begins to shift. However, extended net-long imbalances can sometimes precede corrective phases, meaning current EUR strength may be late-cycle rather than early-stage accumulation.
2. Seasonal Tendencies
December seasonality is notably skewed:
• The EUR historically performs well in December across all major lookback periods (20Y, 15Y, 10Y, 5Y, 2Y), creating a supportive seasonal tailwind.
• The AUD shows mixed to mildly positive seasonal behaviour at shorter timeframes, but lags the EUR significantly over the 10-year dataset.
Overall, seasonality favours EUR strength against AUD into year-end, adding a bullish seasonal bias to EURAUD.
3. Sentiment
Retail sentiment on EURAUD currently shows:
• 68% short
• 32% long
Such an imbalance typically acts as a contrarian bullish signal. As long as retail traders remain heavily short, upward pressure on EURAUD is likely to persist.
4. Daily Chart Structure
Price is currently rejecting a major daily supply zone after a sustained three-week upside rotation. The rejection aligns with key technical factors:
• descending trendline resistance
• previous distribution area
• RSI rejection from mid-range
Key levels:
• Daily supply: 1.7806 – 1.7921
• First downside target: 1.7558 demand
• Secondary liquidity zone: 1.7500 – 1.7440
The recent bearish move off supply suggests the start of a potential corrective phase. However, the higher timeframe structure remains bullish, and this decline may represent a pullback rather than a full structural reversal.
Macro factors (COT + seasonality + sentiment) lean bullish, which conflicts with the short-term downside impulse.
Short-term bias: Bearish corrective move toward 1.7558 demand
Medium-term bias: Bullish continuation unless 1.7440 breaks
The location is favourable for tactical shorts following the daily rejection, but aggressive management is required. Deep downside targets carry higher risk unless bearish momentum increases.

GBPJPY: COT & Seasonality Align for Bullish ContinuationCOT (Commitment of Traders): On GBP futures, Non-Commercial traders remain heavily net short, with an unbalanced structure and a further increase in short exposure over recent weeks. This positioning is typically contrarian in nature and remains consistent with continued upside potential in the cross. On the JPY side, Non-Commercials are still net long, but the broader context points to a structurally weak yen. Positioning momentum is fading, suggesting a higher risk of short covering rather than genuine defensive strength. From a relative perspective, the GBP vs JPY COT spread continues to favor further upside in GBPJPY.
Seasonality: Historical seasonality highlights December as one of the strongest months for GBPJPY, showing positive average performance across the 20-, 15-, 10- and 5-year datasets, with frequent accelerations during the second half of the month. This reinforces the broader bullish bias and reduces the probability of deep reversals as long as the technical structure remains intact.
Sentiment (retail): Retail positioning shows a clear majority short (around 80%), a classic setup that tends to support trend continuation and potential squeezes above highs, particularly when aligned with a well-defined trend and no signs of institutional distribution.
Daily technicals: The daily chart maintains a clean bullish structure, defined by higher highs and higher lows within an ascending channel. Price continues to trade above key value areas while respecting dynamic demand zones. The 206.5–205.5 area represents the first continuation demand, while a broader daily demand sits lower around 203–200, overlapping with a daily FVG and structural support. On the upside, 211.5–213 stands out as daily supply and the natural upside objective. Technically, there is room for an extension toward new highs as long as no structural breakdown or distribution signals emerge. The daily RSI remains constructive, with no meaningful bearish divergences, fully consistent with trend continuation.
Operational conclusion: The medium-term bias remains bullish. The preferred strategy is buying pullbacks into daily/H4 demand zones, with invalidation only below the key structural lows. Counter-trend shorts should be avoided. Short opportunities become relevant only if clear exhaustion signals appear at daily supply, supported by divergences and a confirmed structural shift, which are currently absent.

USDJPY – Daily Compression at Key Demand: COT Divergence PointsFrom a COT perspective, the overall picture remains consistent with a phase of potential short-term structural weakening in the JPY, while at the same time showing signs of maturity in the USDJPY move. On JPY futures, Non-Commercial traders are still net long the yen (longs exceeding shorts), but the latest data highlights an increase in short positions alongside a reduction in longs, a typical distribution pattern following months of accumulation. At the same time, Non-Commercials on the Dollar Index remain heavily net short, suggesting that USD strength is increasingly fragile and driven more by tactical flows than by strong long-term conviction. This COT divergence historically tends to favor corrective moves on USDJPY rather than impulsive upside extensions.
On the daily chart, the technical structure is well defined: after the strong bullish impulse in November, price is developing a consolidation flag / descending channel, characterized by lower highs and compression toward a clearly defined daily demand zone between 154.00 and 154.50. This area has already been defended multiple times and aligns with a volume equilibrium zone. A clean break below this demand would open room toward the lower demand area around 152.00–152.50, while as long as price holds above the base of the channel, the bias remains corrective rather than structurally bearish. From a technical standpoint, the higher-probability scenario is a reaction from the demand zone with an attempt to break the upper trendline, rather than an immediate downside acceleration.
USDJPY seasonality in December has been historically positive to neutral-bullish over the past 10–20 years, with a tendency for recoveries in the second half of the month following early weakness. This supports the case for a technical rebound rather than a direct bearish continuation. Retail sentiment is almost perfectly balanced (51% long / 49% short), providing no extreme contrarian signal and reinforcing the idea of a market in a waiting and building phase, consistent with the current daily range and compression.
Overall, the operational bias remains neutral-to-bullish on weakness. The 154.00–154.50 area is a key reaction zone where a change in structure could justify tactical long exposure, with invalidation below daily demand. Only a decisive break and acceptance below 154 would shift the outlook toward a bearish continuation targeting 152, while a break of the descending trendline would confirm the resumption of the medium-term bullish trend toward 157.50–158.00.

EUR/USD Daily Outlook: Bullish Structure | COT & SeasonalityOn the daily chart, EUR/USD has developed a clean recovery structure after the November low, characterized by a well-defined sequence of higher lows and price holding above the short-to-medium term ascending trendline. The 1.1650–1.1600 area represents a key dynamic and structural demand zone, already defended multiple times, while the impulsive breakout toward 1.1730 confirmed renewed institutional interest on the long side. Price is now trading just below a relevant daily supply zone between 1.1750 and 1.1820, aligned with prior highs and a distribution area visible on higher timeframes. As long as this zone is not cleared with a strong daily close, the most likely scenario is a corrective pause or a controlled pullback toward 1.1680–1.1650 before any renewed attempt at the highs. From a COT perspective, the backdrop remains constructive for the euro: non-commercials are still net long EUR FX, with a reduction in short exposure and a positioning structure consistent with accumulation rather than distribution. At the same time, the US Dollar Index shows non-commercials still heavily net short, suggesting that large players are not aggressively defending the dollar and that pullbacks on EUR/USD are more likely continuation opportunities than structural reversals. From a seasonality standpoint, December has historically shown a moderately positive bias for EUR/USD, particularly in the second half of the month, favoring gradual upside moves rather than sharp directional spikes—consistent with a typical year-end environment of compressed volatility but positive directional bias. In summary, the broader bias remains bullish, though not an immediate breakout scenario: the highest-probability path favors technical pullbacks toward the 1.1650–1.1680 area to build trend-aligned long exposure, while only a confirmed daily break above 1.1820 would open room toward 1.1900. Structural invalidation sits below 1.1550, which currently remains a low-probability scenario.

USDCAD: Massive Pullback Incoming or Final Trap?USDCAD is reacting from a major demand area at 1.3720–1.3770, which aligns with:
• the lower boundary of the yearly ascending channel;
• an institutional zone that has been defended multiple times (Q3 and early Q4);
• a daily RSI showing relative oversold conditions;
• a liquidity cluster below the October lows that has now been swept.
The rebound is technically justified, but its sustainability will largely depend on CAD structure (strong in the latest COT data) and on December seasonality, which is historically unfavorable for USDCAD.
The base case is a bullish pullback toward 1.3890–1.3930, followed by renewed downside pressure if macro sentiment continues to support the CAD.
The daily chart highlights:
• Primary trend: still bullish, but undergoing a deep corrective phase.
• Midline channel break → bearish acceleration into the demand area.
• Current price action: sharp rejection with increased relative volume at the lows (typical structural “spring”).
• The 1.3880–1.3930 zone is the first major supply: confluence between previous structure, the last breakdown area, and a psychological pre-pivot region.
Key technical levels:
Support: 1.3720 (demand), 1.3660 (extreme), 1.3570 (macro support).
Resistance: 1.3880, 1.3930, 1.4050.
Technical outlook:
As long as the price remains above 1.3720, the market favors a corrective rebound.
Below 1.3660, price opens the path toward 1.3570.
Seasonality – December
December is historically a bearish month for USDCAD, with negative readings across 20-, 15-, 10-, and 5-year datasets:
• 20-year avg: -0.0014
• 10-year avg: -0.0091
• 5-year avg: -0.0195 (significantly negative)
• Only the 2-year pattern shows a more neutral/volatile structure.
Seasonality takeaway: bearish bias, suggesting the current rebound is more likely a technical pullback rather than the start of a new trend.
COT Analysis (CAD + USD Index)
CAD – COT data (Nov 4, 2025)
• Non-Commercials increased CAD shorts aggressively (+8,288) while reducing longs (-1,180).
→ Indicates speculative CAD weakness in recent weeks.
• Commercials significantly increased CAD longs (+13,164).
→ Typical of institutions accumulating CAD at discounted prices.
Interpretation:
CAD displays a clear divergence: speculators are bearish, while commercials are increasingly bullish. This suggests a potential macro turning point where institutions anticipate medium-term CAD strength.
USD Index – COT data (Nov 4, 2025)
• Non-Commercials increased both longs (+6,038) and shorts (+5,474).
→ Polarized market.
• Commercials increased longs (+1,188).
→ Marginal support for the USD.
Macro COT conclusion:
• CAD: institutional buying pressure.
• USD: indecision and polarization.
Overall COT bias → medium-term bearish USDCAD, although consistent with a short-term corrective bounce.
Retail Sentiment
• Short: 37%
• Long: 63%
Retail positioning is clearly long.
Contrarian interpretation: downside risk remains elevated after the pullback.
Macro Context
• Oil remains volatile but structurally firm → historically CAD-supportive.
• The Fed maintains a cautious stance with potential rate cuts in 2026 → structural pressure on the USD.
• The BoC, although dovish, may delay cuts relative to the Fed → supportive for CAD in the medium term.
Probability 60% – Base Scenario
Pullback toward 1.3880–1.3930 before renewed bearish pressure.
Confirmations:
• Daily close above 1.3820
• Bullish H4 structural shift
Target: 1.3890
Extension: 1.3930
Failure level: below 1.3720.
Alternative Bearish Scenario – Probability 40%
A direct break below 1.3720 → continuation toward 1.3660 and then 1.3570 (macro level).
Confirmations:
• Pullback failure / squeeze
• H4 bullish breakout in oil
• Daily rejection on the USD Index.
USDCAD is currently rebounding within a broader corrective structure.
COT and seasonality do not support a strong bullish reversal, but short-term price action allows room for a move toward 1.39, where institutional interest will likely re-emerge to resume the broader macro bearish narrative.
Barring macro shocks, the preferred structure remains:
corrective rally → short setup at 1.3880–1.3930 → target 1.3720 and potentially 1.3660.

GBP/USD: Institutions Accumulate, USD Weakens – Key PullbackMacro Context and USD Index (DXY) – Neutral/Weak USD Bias
The COT report on the Dollar Index shows a configuration that suggests sustained bearish pressure on the USD:
Non-commercial traders are adding both long positions (+6,038) and short positions (+5,474), but the overall structure remains clearly short-dominant (32,207 shorts vs. 16,645 longs).
Commercials significantly increase their USD long exposure (+1,188), though their activity typically reflects hedging rather than a directional view.
Open interest rises sharply, signaling renewed institutional participation on the sell side of USD.
In summary, net pressure remains bearish on the USD, a condition that favors upside continuation in GBP/USD.
COT on the British Pound (GBP) – Clear Improvement in Institutional Sentiment
The GBP report is far more revealing:
Non-commercials aggressively cut long exposure (–19,354) while sharply increasing shorts (+15,403).
However, commercials substantially increase their GBP long exposure (+40,231) while reducing short exposure (+504).
This dynamic is typical of market turning points:
When non-commercials rapidly reduce longs and add shorts, it often represents short-term emotional selling.
Commercials, meanwhile, accumulate heavily, suggesting that current price levels are perceived as attractive value zones.
Interpretation:
GBP is likely entering a structural accumulation phase.
Combined with USD weakness → this supports a moderately bullish medium-term bias on GBP/USD.
Retail Sentiment – Contrarian Confirmation of Potential Upside
Retail short: 56%
Retail long: 44%
Retail positioning is predominantly short → classic contrarian signal → reinforces a bullish scenario for GBP/USD.
Seasonality – December Historically Bullish
December typically shows positive seasonal behavior, especially across the 5-year and 2-year curves.
The 10-year curve is slightly bullish as well; only the 20-year curve is mostly neutral.
Interpretation: December tends to favor accumulation and upward extensions, particularly in the second half of the month.
Price Action & Key Levels
Price recently bounced from the ascending channel highlighted in green.
A strong bullish impulse candle broke previous micro-structure, and the pair is now undergoing a technical pullback.
The blue zone (1.3160–1.3230) represents the major daily demand area that initiated the latest rally.
Primary Scenario (Bullish – Higher Probability):
A retracement toward 1.3240–1.3260 is expected, aligning with a retest of the ascending trendline.
From this region, a bullish continuation toward:
• 1.3420 (first supply zone)
• 1.3550 (intermediate liquidity pocket)
• 1.3600–1.3650 (macro supply and seasonal target)
The daily RSI remains neutral, with no signs of exhaustion, leaving ample room for further upside.

EUR/GBP: Smart Money Unwinding Begins — The Pullback Trap1. Price Action (Daily Chart)
At the moment, EUR/GBP is moving through a bearish correction within a broader medium-term bullish structure. Price has cleanly rejected the 0.8800–0.8850 supply zone, which aligns with the upper boundary of the ascending channel.
The breakdown of the inner trendline and the daily close below the channel’s midline signal that momentum has shifted to sellers.
RSI is deeply oversold, so I expect a technical rebound before any continuation of the sell-off. The first level I’m watching for a retest is 0.8780–0.8800, a former support → now resistance.
As long as we remain below that zone, I maintain a short bias, targeting the 0.8680–0.8650 confluence, where the channel support, daily demand, and previous structural levels align.
A sustained reclaim above 0.8810–0.8830 would invalidate this scenario.
2. Sentiment (Retail Positioning)
Sentiment data shows 74% retail short and only 26% long.
As a contrarian trader, this makes me cautious about selling lows: the crowd is already on the move, usually late. This doesn’t invalidate the downside bias, but it reinforces the idea of waiting for a proper pullback before considering new short entries.
3. COT (Commitment of Traders)
The COT report sends a clear message: we may be entering a distribution phase on the cross.
On the EUR side, Non-Commercials remain strongly net-long (243k vs 135k) but are reducing long exposure.
On the GBP side, Non-Commercials remain net-short (79k vs 91k) and are aggressively cutting long positions.
This tells me the market had been positioned long EUR / short GBP, and is now unwinding that consensus — a classic signature of a correction after a mature bullish trend.
Commercials, as often seen at potential turning points, are doing the opposite: accumulating GBP and distributing EUR, suggesting that current EUR/GBP levels are no longer attractive from a hedging/fundamental standpoint.
4. Seasonality
November seasonality is historically moderately bearish for EUR/GBP across the 10-, 15- and 20-year studies.
December, on the other hand, shows a much stronger positive seasonal tendency.
For me, this creates a clear narrative:
• expected weakness into late November,
• potential accumulation zone in early December,
• likely seasonal recovery in the second half of the month.

EUR/CHF – Rejection or Breakout?On EUR/CHF, I’m seeing a moderately bullish overall structure, although I recognize a real risk of rejection within the supply zone I’m monitoring on the daily timeframe. Since September, the broader market structure has been clearly bearish: price has been moving inside a well-defined descending channel, and the rebound from the 0.922–0.923 area simply pushed price back toward the upper boundary of that channel, right into my 0.9315–0.9335 supply zone, where the descending trendline also aligns. It’s normal to see profit-taking and liquidity from late buyers coming into play here.
As long as I don’t see a clean daily close above 0.9330–0.9340, the downtrend is not technically invalidated for me. The most likely scenario based purely on price action is an initial bearish reaction from the current area, potentially followed by a pullback toward 0.9280–0.9290, which now acts as the first meaningful support (former resistance + top of the inner channel). Only if I see clear rejection in that zone — pin bars or bullish engulfings on H4/H1 — I will consider long entries targeting 0.9360–0.9380 and, in extension, the large supply zone at 0.9410–0.9450. I completely invalidate this long setup below 0.9250, and definitively below 0.9220.
Regarding the COT, even though the data is outdated due to the shutdown, the structural picture remains intact: speculators are strongly net long EUR (255k vs 137k) and strongly net short CHF (7.5k vs 35k). This combination — “specs long EUR / short CHF” — continues to support a medium-term bullish bias for this cross. COT doesn’t give me timing, but it does prevent me from trading against the macro flow: deep pullbacks still look more like buying opportunities than the start of a fresh bearish trend.
Seasonality shows that both EUR and CHF are typically weak in November, so there isn’t a strong directional edge. What matters more is December, where both currencies tend to strengthen, with CHF historically performing slightly better. This makes seasonality essentially neutral for EUR/CHF, so I use it only as a soft confirmation rather than a directional driver.
On the sentiment side, I notice that 69% of retail traders are short EUR/CHF. That’s a strong contrarian signal in favor of further upside: retail is still anchored to the bearish narrative of the past months, so a breakout above 0.933–0.934 could trigger a sharp squeeze, even more so if price extends above 0.937–0.938.

NZDJPY: Premium Short Setup Below 89.00 – Seasonality + COT1. Macro Outlook
NZDJPY remains a cross strongly driven by risk dynamics: NZD typically behaves as a risk-on currency, while JPY is a classic risk-off safe haven. The current global environment — characterized by slowing economic momentum, yield volatility, and speculative position rotation — generally supports downside pressure on the cross, although with less linearity compared to the previous quarter.
2. COT (Commitments of Traders)
JPY
Non-commercial traders remain clearly net-long JPY, reflecting a structural preference for Yen strength.
However, weekly changes show:
• –8,589 long contracts closed
• +9,446 new short contracts added
→ This indicates profit-taking and a reduced bullish aggressiveness on the Yen.
NZD
Speculators remain heavily net-short NZD (44k shorts vs 23k longs).
But last week’s flows show:
• +11,287 new longs
• +10,792 new shorts
→ A rebalancing phase rather than a trend reversal; signals uncertainty.
COT Conclusion:
The structural bias remains bearish for NZDJPY, but the pro-Yen speculative impulse is slowing. This increases the likelihood of a short-term bullish retest before further downside continuation.
3. Seasonality
JPY
Historically strong in November–December.
NZD
Neutral-to-weak in November; slightly positive in December but unstable.
The seasonal differential favors NZDJPY weakness between late November and early December, consistent with a move back toward autumn lows.
4. Retail Sentiment
• 83% short
• 17% long
This extreme bearish clustering among retail traders increases the probability of a short-term upside squeeze before macro-consistent downside resumes.
Implication:
⚠️ Avoid selling in the middle of the range
✔️ Only sell from premium levels and with confirmation
5. Price Action
Since August, the pair has been trading inside a structural 84.8–89 range, with highs losing quality and repeated lows — a classic distributive profile.
The recent bounce into 88 pushed price back into upper supply without breaking bullish structure, creating an ideal setup for selling rallies.
RSI remains neutral/slightly bullish but fails to confirm a new high, suggesting a potential bearish divergence that supports the short bias.
🔻 Primary Bias: SHORT below 88.70–89.00

USDCAD: Institutions Accumulating? Perfect Pullback Into FVG1. MACRO & COT FRAMEWORK
COT – CAD
→ Speculators remain heavily net short on CAD.
The Canadian dollar shows a massive net-short imbalance, exceeding 100k net contracts.
Speculators are still selling CAD aggressively → supportive for upside continuation on USD/CAD.
COT – USD
→ USD is still net short overall, but positioning is shifting.
The dollar is beginning to reverse positioning: fewer shorts + more longs = improving USD strength.
→ Overall COT environment favors further upside for USD/CAD.
2. RETAIL SENTIMENT
Retail Longs: 51%
Retail Shorts: 49%
Retail is almost evenly split, slightly long.
This is mostly neutral, but historically, when sentiment is balanced, price tends to follow institutional flows → which remain long USD/CAD.
Sentiment confirms a bullish bias.
3. SEASONALITY (USD/CAD – November)
November is historically a slightly bullish month for USD/CAD.
The 20-year, 15-year, and 10-year composites all show a positive seasonal tendency.
The current month is tracking a similar pattern.
Seasonality supports a long bias into the second half of November.
4. TECHNICAL ANALYSIS
The pair remains in a structurally bullish uptrend with a clean ascending channel.
Higher highs and higher lows confirm trend integrity.
Price is currently correcting toward the mid-range of the channel.
The market is entering a Daily FVG between 1.3950 – 1.3980.
A prior sweep has already tapped the lower trendline, adding confluence.
Immediate Support Zone
1.3950 – 1.3980 (FVG + structural support)
→ ideal area for long accumulation.
Upside Target:
1.41500 → clear liquidity level above previous swing high.
RSI remains above 40 and cooling off, indicating a healthy pullback within a bullish trend.

EURAUD: Institutional Buying Pressure & Bullish November SetupThe pair has broken out of the descending channel and is now forming a new ascending structure.
Price reacted strongly from the 1.7550–1.7600 demand zone, which aligns with a key structural support and an oversold RSI area.
The current consolidation phase is unfolding below a daily inefficiency (gap) around 1.7800–1.7920, which represents the first bullish target.
If the bullish structure holds, we could see a three-wave move towards 1.7920, with a potential mid-term pullback to 1.7700 before the next impulsive leg.
🔹 2. COT Report
Euro (EUR)
Non-commercials: 252k long vs 138k short → net long
Commercials: strongly net short
Weekly change: +2.6k shorts / -789 longs → slightly reduced bullish momentum
➡️ EUR remains fundamentally strong, though speculative momentum has slightly cooled.
Australian Dollar (AUD)
Non-commercials: 42k long vs 101k short → deeply net short
Shorts increased by +10k this week, indicating renewed institutional bearish pressure.
➡️ AUD remains weak with a clear bearish bias.
👉 Overall COT bias: favors EUR strength and AUD weakness, supporting a bullish view on EURAUD.
🔹 3. Seasonality
EUR typically strengthens in November, especially during the last 10 days of the month (+0.003 / +0.004 average).
AUD historically shows November weakness across 10Y, 5Y, and 2Y averages.
➡️ Seasonal patterns support the bullish case for EURAUD, aligning with COT positioning.
🔹 4. Retail Sentiment
70% short vs 30% long
➡️ Retail traders are heavily short, providing a contrarian bullish signal.
📈 Conclusion
The medium-term bias remains bullish on EURAUD, with potential upside extension toward 1.7920, and possibly 1.8050 if macro momentum persists.
The key support to defend lies at 1.7600 / 1.7550.
A daily close below this level would invalidate the bullish scenario and reopen the path toward 1.7400.

EUR/USD at the Edge: Bounce Before Breakdown?🧩 Macro & COT Context
(Note: data frozen as of September 23 due to CFTC shutdown)
The latest available COT report showed non-commercial traders still net long on EUR (≈ +114K contracts), but with a steady increase in both commercial longs (+4.9K) and commercial shorts (+3.3K) — signaling a more balanced positioning. Meanwhile, the USD Index showed a slight pickup in long exposure (+1.5K), hinting at a gradual shift toward USD strength until updated data resumes.
💭 Sentiment
Retail traders are 67% short vs 33% long, a typical contrarian setup where the crowd is selling the pullback. This supports a short-term bullish bounce, but only until the next supply zone is reached.
📈 Seasonality
Historically, November has been a neutral-to-bearish month for EUR/USD (-0.0021 on 20Y average; -0.0063 on 10Y). The pair tends to weaken during the second half of the month, before recovering into December.
📊 Technical Structure (Daily Chart)
Price remains inside a descending channel since late September, recently retesting the upper boundary and supply area at 1.1570–1.1710, where a clean rejection formed.
RSI holds below the midline (~45), confirming weak momentum.
The overall structure stays bearish, with room for continuation toward the 1.1380–1.1400 demand zone, aligning with both channel projection and liquidity targets.
Main Bias: Short continuation
Sell Zone: 1.1570–1.1620 (upper channel + supply)
Target 1: 1.1400
Target 2: 1.1350 (weekly liquidity pool)
Invalidation: Daily close above 1.1715
Summary
📊 COT (last update): EUR still net long → neutral bias until new data
📉 Seasonality: Historically weak November
📈 Sentiment: Retail short → short-term bullish bounce possible
🧭 Technical Bias: Bearish below 1.1715

NZD/USD: A Trap for Early Buyers? Retail 90% Long1️⃣ Technical Context
NZD/USD is trading around 0.5630, within a descending channel that started in mid-July. After testing the lower boundary of the channel and the demand zone between 0.5570–0.5620, price reacted with a mild technical bounce — yet without any structural reversal confirmation.
The daily RSI shows a bullish divergence and remains above 30, signaling a possible short-term rebound toward 0.5750–0.5800 before a potential continuation lower.
Key Levels
Resistance: 0.5750 / 0.5820 (upper channel + prior supply)
Support: 0.5570 / 0.5500 (demand + channel bottom)
Technical Bias: bearish while below 0.5820, but short-term corrective potential toward the upper channel remains.
2️⃣ COT Data (latest available report)
NZD Futures (CME):
Non-commercial: Long +3,044 | Short +6,160 → rising net short exposure.
Commercial: Long +2,869 | Short -286 → commercials remain hedged, confirming structural weakness in NZD.
USD Index: Non-commercials remain net short but are reducing exposure, signaling gradual USD strength.
→ Interpretation: COT data confirms a pro-USD, bearish bias on NZD, consistent with the broader technical trend.
3️⃣ Seasonality
Historically, November is slightly positive for NZD/USD, especially in shorter time frames (5–2 years).
20 years: -0.001
10 years: -0.003
5 years: +0.004
2 years: +0.005
→ Suggesting a short-term recovery phase in early November, followed by renewed weakness later in the month.
4️⃣ Retail Sentiment
Long: 90%
Short: 10%
Average long price: 0.5766
→ The overwhelming long positioning suggests many retail traders are trying to catch a bottom, which raises the risk of further downside pressure in the short term (potential liquidity sweep below 0.56).
5️⃣ Trading Outlook
Overall Bias: bearish with a short-term corrective potential.
Main Scenario:
→ Pullback toward 0.5750–0.5800 (upper supply zone), then likely continuation lower toward 0.5550–0.5500.
Alternative Scenario:
→ A daily close above 0.5820 would invalidate the bearish setup and open room toward 0.5950.
Confluences:
✅ RSI bullish divergence
✅ Short-term positive seasonality
⚠️ Retail extremely long
⚠️ COT bearish for NZD

GBP/JPY – Bearish Continuation Setup | Possible Pullback to 2031️⃣ Technical Context
On the daily chart, GBP/JPY is trading around 201.12, moving inside a descending channel that began in mid-October. Price action has recently tested the lower boundary of the channel and the 200.00–200.70 demand zone, showing a short-term bullish reaction but no confirmed structural reversal yet.
The RSI daily near 30 suggests a potential short-term rebound but no confirmed bullish reversal.
Key Levels
Resistance: 203.50 / 204.50 (upper channel + previous supply)
Support: 200.00 / 199.00 (demand + psychological level)
Technical Bias: Bearish below 203.50; only a daily close above 204.00 would invalidate the bearish setup.
2️⃣ COT Data (stable due to shutdown)
Latest available report:
JPY: Net long positions increased by +14,727 among non-commercials, while commercials remain heavily short (hedging). This indicates a structural strengthening of the Yen.
GBP: Net short positions remain stable (-3,392), with a slight increase in non-commercial longs (+3,704) but not enough to shift sentiment.
→ Interpretation: The COT context confirms a pro-JPY bias and weak GBP outlook, maintaining a bearish fundamental bias for GBP/JPY.
3️⃣ Seasonality
November seasonality shows a negative pattern for GBP/JPY, especially on the 10–20 year horizon.
20-year avg: -0.69%
10-year avg: -1.31%
Only the 2-year cycle shows a mild positive move (+0.88%), suggesting that mid-term seasonality supports bearish pressure until mid-November, followed by a potential technical rebound later in the month.
4️⃣ Retail Sentiment
Short: 64%
Long: 36%
Most retail traders are short, with an average short entry around 195.98, well below the current market price at 201.
→ This means the majority are still in profit, which increases the likelihood of a short-term bullish squeeze before the next downward move resumes.
✅ COT favors JPY strength
✅ Seasonality remains negative for GBP/JPY
✅ Technical structure confirms lower highs
⚠️ Retail positioning suggests possible short-term fakeout to the upside
GBP/JPY remains in a bearish continuation context, consistent with Yen strength and negative seasonality. However, a technical pullback toward 203.00–203.50 is likely before a renewed bearish impulse targeting the 198.50 area.

GBP/USD — The Trap Above 1.32 Before the Real Drop BeginsGBP/USD continues its bearish momentum after rejecting the major supply zone around 1.3450–1.3600.
From a structural perspective, price has formed a clear series of lower highs and lower lows, confirming the bearish continuation setup.
📉 Macro Context:
COT data (delayed due to the U.S. government shutdown) still shows a fragile Pound: non-commercial traders are almost balanced but with a slight reduction in shorts, while commercials remain heavily short. Meanwhile, the Dollar Index COT reveals a growing long positioning — a clear sign of renewed USD strength.
Sentiment: 82% of retail traders are long on GBP/USD → a strong contrarian signal.
Seasonality: November is historically weak for GBP/USD, showing a negative tendency in 10- and 15-year averages.
🔎 Technical Setup:
After a failed attempt to reclaim the 1.33–1.34 range, the pair dropped aggressively.
A short retracement toward 1.3150–1.3200 could serve as a liquidity grab before further downside continuation.
As long as price remains below 1.3270, the bearish bias remains intact.
🎯 Key Levels:
Resistance: 1.3150 – 1.3200
Support: 1.3000, 1.2850, then 1.2750
Invalidation: Daily close above 1.3270
🧩 Bias: Bearish continuation
