USDJPY | Liquidity Sweep Before Year-End RallyUSD/JPY remains structurally bullish within a broad ascending channel that has defined price action since mid-2024. Despite recent pullbacks, momentum remains positive while price trades above the 151.50–152.00 structural support, aligning with the broader macro bias of USD strength and JPY weakness.
1️⃣ Seasonal Bias
Historical data from Market Bulls shows that November tends to favor USD/JPY upside, with an average gain between +0.8% and +1.2% across the 10- to 20-year datasets. This month’s seasonal strength often follows October consolidations, suggesting continuation potential toward year-end highs.
2️⃣ COT Positioning (Commitment of Traders)
USD Index: Non-commercials increased net longs by +1,541, confirming a persistent bullish bias on the USD side.
JPY Futures: Non-commercial traders added a significant +14,727 long positions, but commercial hedging remains heavily long, indicating that institutional demand is more protective than speculative.
The divergence implies temporary JPY strength, but the overall positioning still favors USD dominance in the medium term.
3️⃣ Sentiment Data
Retail traders remain 60% short vs 40% long on USD/JPY, providing a contrarian bullish signal. Historically, retail positioning against trend continuation adds conviction to a potential bullish extension.
4️⃣ Technical Structure (Daily Chart)
Price is consolidating near 153.40, just below the upper boundary of the ascending channel. A short-term pullback toward 152.00–151.50 could act as the liquidity grab zone before continuation.
Support Zone: 152.00 → 151.50
Key Demand Area: 150.50 (aligned with prior daily gap and mid-channel support)
Resistance Zone: 155.50 → 156.00 (upper trendline projection)
RSI: Currently neutral (~52), suggesting there’s still room for upside momentum before reaching overbought conditions.
The market may engineer liquidity below 152 before a bullish reaction targeting 155.50 and potentially the 156.80 macro extension zone by mid-November.
5️⃣ Confluence Summary
✅ Seasonality: Bullish
✅ COT: USD stronger bias vs JPY
✅ Retail Sentiment: Contrarian bullish
✅ Structure: Bullish continuation pattern within channel
⚠️ Short-term Risk: Liquidity sweep below 152
COT

AUD/USD – Waiting for the Pullback Before the Next Bullish Leg?After rebounding strongly from October lows, AUD/USD is testing the 0.6580–0.6620 supply zone while staying above the key support area at 0.6520–0.6550.
On the macro side, the RBA remains data-dependent after pausing its rate cuts, citing sticky services inflation and resilient labor markets. Meanwhile, the USD has been capped by softer growth data and growing expectations for further Fed easing into early 2026 — a mix that keeps AUD/USD in recovery mode, at least short term.
COT positioning (last valid as of September 23, due to the CFTC shutdown) still reflected heavy speculative shorts on the Aussie — a structure that supported the recent bullish correction but is now outdated.
Retail sentiment shows 77% of traders short, suggesting a strong contrarian upside bias, consistent with the technical picture.
Seasonality data points to a mildly positive bias in October–November, typically followed by neutral behavior in December.
Technical structure:
Price has broken out of the descending channel and is building a short-term higher-low structure.
Support (demand zone): 0.6520–0.6550
Resistance (supply zone): 0.6580–0.6620 → breakout could extend toward 0.6680–0.6720
RSI: mid-range, indicating room for another impulse higher.
🎯 Trading Plan
Base scenario: Look for a pullback into 0.6520–0.6550 to rejoin the bullish leg targeting 0.6680–0.6720.
Alternative: A rejection from 0.6600–0.6620 could trigger a short-term correction toward 0.6500 before buyers return.
Invalidation: Daily close below 0.6475 (loss of structure).
⚙️ Bias: Short-term bullish, medium-term neutral-to-bullish.
🕒 Focus: RBA tone, Chinese PMIs, and U.S. ISM/labor data — all key for the next leg of AUD/USD.

GOLD Short-Term Pullback 🔹 COT (Commitment of Traders)
(Last update: September 23, 2025 – data not refreshed due to the CFTC shutdown)
Gold (COMEX)
Non-commercial longs: 332,808 (+6,030)
Non-commercial shorts: 66,059 (+5,691)
→ The latest available data (outdated) showed an increase in both positions, with a stronger rise on the long side — indicating institutional accumulation in late September ahead of the October rally.
Although outdated, the COT report still reflects a mildly bullish structure, but no longer captures the current market dynamics after recent volatility.
🔹 FX Sentiment (Retail Positioning)
58% long / 42% short
📌 Retail traders remain moderately long on gold. This supports a short-term contrarian bearish bias, aligning with the ongoing corrective move in price.
🔹 Seasonality
Historically, October and November tend to be statistically bullish months for gold, with average gains between +2% and +4% over 10–20-year periods.
📌 Seasonal conclusion: the context remains bullish on a seasonal basis, with potential for recovery once the current correction stabilizes.
🔹 Price Action
After the strong bullish impulse that pushed XAU/USD into the 4,350–4,400 area, price entered a phase of consolidation/distribution.
Current structure shows:
Key resistance: 4,250–4,300
Main demand zone: 3,950–3,900
RSI remains neutral but continues to lose momentum, consistent with a possible minor bearish leg before a new bullish wave.
🎯 Main Scenario:
Expecting a continuation of the corrective phase toward 3,950–3,900, aligning with the daily demand area and a likely institutional reaccumulation zone.
From there, a potential bullish resumption could emerge within November’s seasonal strength.
⚙️ Invalidation: daily close below 3,850, which would compromise the medium-term bullish structure.

GBP/NZD: Smart Money Flows Back Into Sterling🔹 COT (Commitment of Traders)
British Pound (GBP)
Non-commercial longs: 84,500 (+3,704)
Non-commercial shorts: 86,464 (−912)
→ Institutions increased long exposure and trimmed shorts → signaling renewed bullish interest in the pound.
New Zealand Dollar (NZD)
Non-commercial longs: 12,295 (+3,044)
Non-commercial shorts: 33,415 (+6,160)
→ Both positions increased, but the stronger rise in shorts suggests a bearish institutional sentiment on the NZD.
Institutional flow supports GBP strength and NZD weakness → overall bullish bias on GBP/NZD.
🔹 FX Sentiment (Retail Positioning)
69% short / 31% long
📌 Retail traders are heavily short — a contrarian bullish signal aligned with the COT positioning.
🔹 Seasonality
British Pound (GBP): October is historically neutral to slightly positive (+0.2% to +0.4% on average over 5–10 years).
New Zealand Dollar (NZD): October shows mild positivity in the short term (2–5 years) but turns neutral/negative over 10–20 years.
📌 Seasonal takeaway: slight divergence, but GBP retains the upper hand in the medium term.
🔹 Price Action
Price remains within a rising channel, testing the dynamic support around 2.3050–2.3100.
After a pullback from the 2.3450–2.3550 supply zone, price is now reacting from the channel’s lower boundary.
RSI is neutral but showing potential for a technical rebound.
🎯 Main Scenario:
A pullback around 2.3100–2.3150 could provide a new long opportunity toward 2.3500–2.3600, with extension to 2.3800.
⚙️ Invalidation: daily close below 2.2950.
🔹 Trading Outlook
Primary Bias: Bullish
Confluences:
COT → Institutions long GBP, short NZD
Sentiment → Retail excessively short = contrarian long
Seasonality → Favors GBP
Price Action → Rising channel structure still valid
🎯 Technical Target: 2.3500 → 2.3800
🚫 Invalidation: below 2.2950

EUR/JPY: Smart Money Turns to the Yen🔹 COT (Commitment of Traders)
Euro (EUR)
Non-commercial longs: 252,472 (−789)
Non-commercial shorts: 138,127 (+2,625)
→ Institutional traders slightly reduced longs and added shorts → signaling mild weakening momentum on the euro.
Japanese Yen (JPY)
Non-commercial longs: 176,400 (+14,727)
Non-commercial shorts: 96,900 (−3,362)
→ Sharp increase in longs and notable short covering → bullish flow into the yen, reflecting potential medium-term strength.
Combined Interpretation:
COT confirms a bearish bias on EUR/JPY, with euro weakness and increasing yen demand.
🔹 FX Sentiment (Retail Positioning)
83% short / 17% long
Retail traders are heavily short — a contrarian signal that may trigger a short-term bounce, though the broader macro backdrop still favors the yen.
🔹 Seasonality
Historically, October tends to be neutral to slightly positive for EUR/JPY over 5–10 years (+0.5% on average), while 15–20-year data shows a mild negative tendency (around −0.6%).
Seasonal takeaway: neutral bias, with correction risk if yen strength persists.
🔹 Price Action
Price is consolidating below 176.00 after a sharp rejection from the 177.50–178.00 supply zone.
The technical structure shows lower highs, with the ascending trendline now at risk of breaking.
RSI remains neutral but losing momentum.
🎯 Main Scenario:
A break below 175.30–175.00 would open space toward 173.50, then 171.80.
Invalidation: daily close above 176.50.

NZD/CHF Setup – 94% of Retail Long While Institutions Sell Hard🔹 COT (Commitment of Traders)
New Zealand Dollar (NZD):
Non-commercial longs: 12,295 (+3,044)
Non-commercial shorts: 33,415 (+6,160)
→ Institutions increased exposure on both sides, but short positions rose more aggressively, maintaining a net short stance and signaling structural weakness in the NZD.
Swiss Franc (CHF):
Non-commercial longs: 8,227 (+1,992)
Non-commercial shorts: 31,245 (−1,030)
→ A solid reduction in shorts and rise in longs, indicating a renewed bullish interest in the Swiss franc.
📊 Combined Interpretation:
Institutional flow clearly favors CHF strength and NZD weakness, confirming a bearish bias on NZD/CHF.
🔹 FX Sentiment (Retail Positioning)
94% long / 6% short
📌 Retail traders are heavily long, a strong contrarian bearish signal.
This imbalance highlights the risk of further downside, perfectly aligned with the institutional view.
🔹 Seasonality
NZD: October shows mildly positive performance over 5–10 years, but weakness across 15–20 years → a short-term neutral-to-bullish but uncertain context.
CHF: October is historically positive across all time horizons (5–20 years), with average gains between +0.5% and +1.2%, confirming a seasonal bullish bias for CHF.
📌 Seasonal Conclusion: Seasonality supports a bearish outlook for NZD/CHF, consistent with both the COT and retail sentiment data.
🔹 Price Action
The pair continues to trade within a well-defined descending channel.
Clear bearish breakout from the 0.4660–0.4700 supply zone, followed by a strong daily close lower.
Currently retracing toward 0.4620–0.4640, an area where fresh selling pressure may emerge.
RSI remains neutral with no bullish divergence, confirming sustained downside momentum.
Key supports: 0.4550 (TP1), 0.4500 (TP2).
Resistance: 0.4660 (invalidation above 0.4680).
🎯 Base Scenario: A short-term correction toward 0.4630–0.4640 followed by renewed bearish continuation toward 0.4500.
❌ Invalidation: Daily close above 0.4680.

EUR/NZD Correction Loading… or Just a Trap? Watch 2.0000 Closely🔹 COT (Commitment of Traders)
Euro Futures: Non-commercial longs slightly decreased (-789) while shorts increased (+2,625) → mild bearish tone on EUR.
NZD Futures: Non-commercial longs rose sharply (+3,044) along with shorts (+6,160) → institutional traders adding exposure on both sides, but still heavily net short on NZD (≈3:1 short/long).
📌 Combined Interpretation: Despite the small decline in EUR sentiment, the strong short positioning on NZD keeps the broader bias bullish for EUR/NZD in the medium term, though near-term correction is likely after recent highs.
🔹 FX Sentiment (Retail Positioning)
82% short vs 18% long.
📌 Retail traders are extremely net short → strong contrarian bullish signal. This suggests the downside could be limited before another potential upside leg.
🔹 Seasonality
October is typically positive for NZD.
EUR tends to be flat to slightly negative in October.
📌 Seasonal bias: mildly bearish for EUR/NZD — NZD’s seasonal strength could fuel a temporary pullback, aligning with the current technical setup.
🔹 Price Action
Rejection from major supply zone 2.0250–2.0350, forming a potential double-top.
Price now consolidating near 2.0050–2.0000, sitting just above key structure and ascending trendline support.
RSI neutral → room for further retracement.
Break below 2.0000 could accelerate the correction toward 1.9850–1.9750 demand zone.
Bullish structure would resume only above 2.0250.
🎯 Outlook: Expect a corrective leg toward 1.9850–1.9750 before potential bullish continuation. Structure remains constructive as long as price stays above 1.9700.

EUR/AUD Ready for Another Drop? Watch 1.7500!🔹 COT (Commitment of Traders)
Euro Futures: Non-commercial longs slightly decreased (-789) while shorts increased (+2,625) → mild bearish sentiment on the Euro.
AUD Futures: Non-commercial longs increased (+1,718) while shorts surged strongly (+10,148) → clear bearish positioning on the Australian Dollar.
📌 Combined Interpretation: Mixed signals — institutional investors are trimming Euro longs while heavily increasing AUD shorts, which could sustain EUR/AUD strength in the short term despite mild Euro weakness.
🔹 FX Sentiment (retail positioning)
56% short vs 44% long.
📌 Retail slightly net short → mild contrarian signal supporting short-term upside for EUR/AUD, but not extreme enough to indicate a reversal.
🔹 Seasonality
October is historically neutral to slightly bullish for the Australian Dollar, suggesting potential resilience.
However, Euro tends to gain modestly into late Q4, often supported by defensive flows.
📌 Seasonal bias leans slightly bearish for EUR/AUD in October, but momentum remains fragile and can easily flip on macro catalysts.
🔹 Price Action
EUR/AUD rejected from the 1.7920–1.7950 supply zone, confirming a descending channel structure.
Price bounced from the local support around 1.7660–1.7680, with sellers still in control below the upper trendline.
RSI neutral, showing potential for continuation lower after a minor corrective pullback.
Key downside target remains at 1.7500, followed by 1.7400 extension if momentum persists.
Bullish invalidation only above 1.7930, which would confirm a breakout from the descending channel.
🔹 Trading Outlook
Main Bias: Bearish short-term, supported by technical rejection and macro weakness in the Euro.
Contrarian Risk: Slightly short retail exposure could trigger a corrective bounce before the next leg down.
Key Levels:
Resistance: 1.7800 / 1.7930
Support: 1.7600 / 1.7500 / 1.7400

USD/CHF Bulls Eye 0.8080 – But Is a Trap Coming First?🔹 COT (Commitment of Traders)
USD Index: Non-commercial longs increased (+1,541), shorts decreased (-1,009). → Speculators turning more bullish on the Dollar.
CHF Futures: Non-commercial longs rose (+1,992), shorts declined (-1,030). → Speculators also turning more bullish on the Swiss Franc.
📌 Combined Result: Strength on both USD and CHF, but the imbalance favors the Dollar.
🔹 FX Sentiment (retail positioning)
74% long USD/CHF vs 26% short.
📌 Retail is heavily long → contrarian signal → risk of a downside correction, even though the macro setup still favors USD.
🔹 Seasonality
October is historically bearish for USD/CHF (average -0.01 to -0.02 over the last 10–20 years).
November tends to be neutral, while December is again weak.
📌 Seasonal bias → contradicts Dollar strength, adding short-term downside risk.
🔹 Price Action
Price consolidating around 0.7980, after a recovery from the BPR (Balanced Price Range).
Structure suggests possible continuation higher toward the 0.8050–0.8080 supply zone.
RSI neutral, with room for further upside.
A break below 0.7940 would invalidate the bullish scenario and expose downside toward 0.7900.

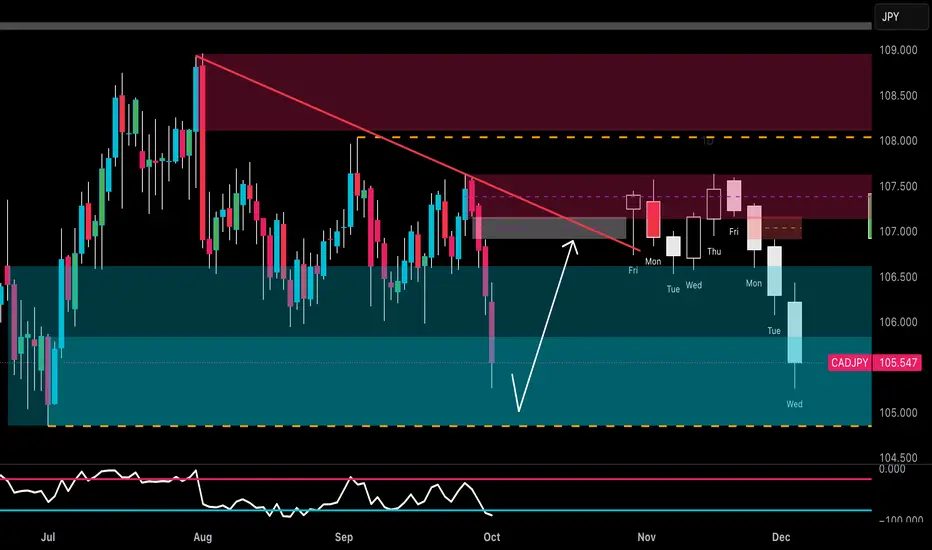
CADJPY Set for October Crash? Institutions Bet Big on Yen 📊 Multi-Factor Analysis – CADJPY
COT Data
JPY: Net long positions are strongly increasing → Non-Commercial long +14.7K, Commercial long +12K. Institutional flows favor the Yen, confirming a bullish bias on JPY.
CAD: Heavy liquidation → Commercial longs -49K, shorts -59K, Non-Commercial longs decreasing (-2.9K). Net positioning shows bearish sentiment on CAD, with a clear prevalence of short exposure among speculators.
👉 Interpretation: Institutional flows point toward a strong JPY and weak CAD → bearish bias on CADJPY.
Seasonality
CAD: Historically weak in October (negative averages in 20Y and 15Y, worsening in 5Y and 2Y).
JPY: Historically strong in October, especially on short-term frames (5Y and 2Y very bullish).
👉 Interpretation: Seasonality supports a bearish scenario on CADJPY during October.
Retail Sentiment
90% Long vs 10% Short on CADJPY.
👉 Extreme retail long positioning = contrarian bearish signal → potential for further downside pressure.
Technical Analysis
CADJPY broke below the descending trendline.
Currently trading inside the weekly demand zone (105–106), acting as short-term support.
RSI oversold → likely technical bounce toward 106.8–107.2 (supply + trendline) before continuation lower.
Primary structure remains bearish, with medium-term targets at 104.80–105.00.
EUR/GBP Rejected at 0.8760 - Is a Pullback to 0.8660 Next?🔹 COT (Commitment of Traders)
GBP Futures: Non-commercial longs increased (+3,704) while shorts decreased (-912) → speculators are turning more bullish on the Pound. Commercials slightly increased shorts (-1,853) but remain largely neutral.
Euro Futures: Non-commercial longs decreased (-789) while shorts increased (+2,625) → signaling bearish pressure on the Euro.
📌 Combined Result: Clear imbalance in favor of GBP, with stronger net positioning compared to the Euro.
🔹 FX Sentiment (retail positioning)
EUR/GBP: 87% short vs 13% long.
📌 Extremely skewed retail positioning → contrarian signal → short-term upside potential for EUR/GBP, but macro context still favors GBP strength.
🔹 Seasonality
September and October show a historically neutral to slightly bearish bias over 15–20 years.
November–December tend to favor the Euro with seasonal rebounds.
📌 In the short term, there is no strong seasonal support for an EUR/GBP rally.
🔹 Price Action
Strong rejection from the 0.8740–0.8760 supply zone, with consolidation below resistance.
Possible retracement toward demand area 0.8660–0.8680, aligning with the dynamic trendline.
RSI is neutral, no major divergences, but momentum is cooling.
Structure remains bullish only above 0.8760; otherwise, risk of reversal toward 0.8620–0.8600.

EUR/USD Rejected Hard at 1.19 COT (Commitment of Traders)
Euro FX: Non-commercials slightly reduced longs (-789) but increased shorts significantly (+2,625). Commercials added both longs (+4,978) and shorts (+3,375), signaling hedging but with a defensive bias. → Net positioning remains positive on the Euro, but short pressure is increasing.
USD Index: Non-commercial longs rose (+1,541), while shorts decreased (-1,009). → USD strengthened by large speculators.
📌 Interpretation: Imbalance in favor of the Dollar, with the market turning more cautious on the Euro.
FX Sentiment
55% short EUR/USD vs 45% long.
📌 Retail is slightly skewed short → often contrarian → could support limited upside, but not extreme.
Seasonality
September is historically weak for EUR/USD (-0.01/-0.012 over 5–10 years).
October is also negative, while November–December historically show rebounds.
📌 Short-term seasonal bias (September–October) remains bearish.
Price Action
Strong rejection from the 1.1850–1.1900 supply zone.
Currently testing the 1.1740 area.
Bearish structure with probable downside targets at demand zones:
1.1650 → first key level.
1.1550 → deeper bearish extension if USD strength persists.
Only a stable recovery above 1.1820 would invalidate the bearish scenario.
Trading Outlook
Main Bias: Bearish in the short term (Sep–Oct), supported by COT (USD strength), negative seasonality, and technical rejection.
Contrarian Risk: Slight retail shorts could trigger minor rebounds, but overall setup favors selling rallies.

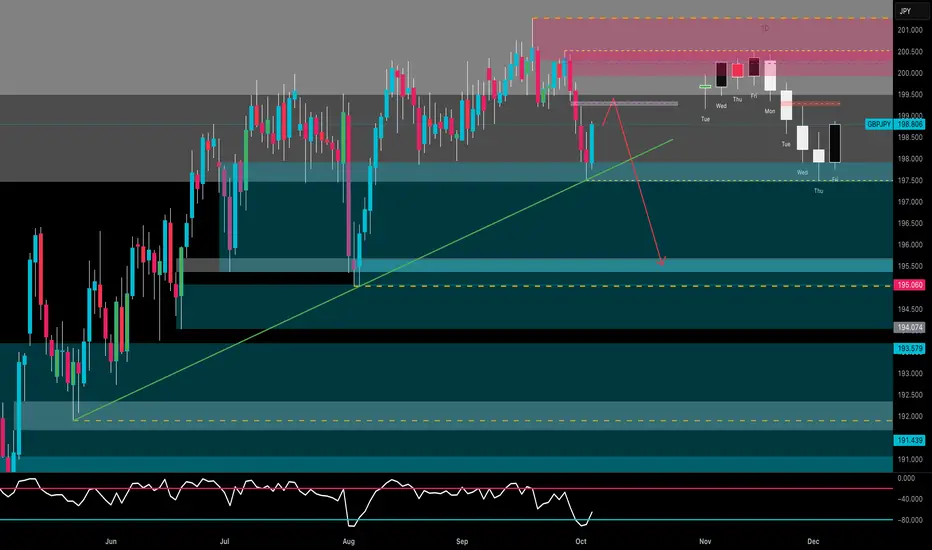
GBP/JPY Bears Back in Control – Is 195.50 the Next Target?🔹 COT (Commitment of Traders)
GBP Futures: Non-commercial longs increased (+3,704) while shorts decreased (-912) → speculators are turning more bullish on the Pound.
JPY Futures: Non-commercial longs sharply increased (+14,727) while shorts declined (-3,362) → strong bullish momentum returning to the Yen.
📌 Combined interpretation: Opposite momentum — both GBP and JPY show long accumulation, but the strength is significantly higher on the Yen, suggesting potential short-term weakness for GBP/JPY.
🔹 FX Sentiment (retail positioning)
59% short vs 41% long.
📌 Retail slightly skewed short → moderate contrarian signal, but not extreme. A short-term bounce is possible, though the broader macro picture remains fragile for GBP.
🔹 Seasonality
October is historically bullish for GBP/JPY on a 5–10 year average (+1.8% to +2.4%).
However, 15–20 year data show a more neutral to slightly negative bias, reflecting volatility rather than stable direction.
📌 Overall, a neutral-to-bullish seasonal bias, but vulnerable to a technical correction after the strong rallies seen in August–September.
🔹 Price Action
Strong rejection from the 200.50–201.00 supply zone with consecutive bearish daily closes.
Current dynamic support sits around 197.00–196.50, aligned with the ascending trendline.
RSI remains neutral and far from oversold → room for further downside.
Possible pullback toward 199.00–199.50 before a new bearish leg.
Main downside targets: 195.50, then 194.00 as an extended target.
🔹 Trading Outlook
Main Bias: Short-term bearish, with JPY strength (COT) and a corrective structure following the 201.00 top.
Contrarian Risk: Slight retail short bias could trigger a minor bounce before continuation lower.
Key Levels:
Resistance: 199.50 / 200.50
Support: 197.00 / 195.50 / 194.00
🎯 Outlook: Expect a pullback toward 199.00 before another bearish move toward 195.50. Daily structure remains bearish as long as 200.50 holds.
Options Traders Display Caution As Gold Bulls Gun For $4000With gold trading less than $120 from the $4,000 milestone, it would be rude not to test that key level. While market positioning suggests a move beyond it is possible, options traders appear to be bracing for higher volatility — or even a pullback.
Matt Simpson, Market Analyst at City Index

Sugar SB Futures: Extreme COT Divergence – Short Squeeze Ahead?
ICEUS:SB1!
🔎 Market Situation
The latest COT report shows one of the most extreme positioning imbalances in 18 years for Sugar #11:
• Commercials: Net Long 128,130 contracts → 2nd highest since 2007 (only surpassed in Sep/Oct 2020 with ~160k).
• Non-Commercials (Funds): Net Short –125,628 contracts, almost a mirror image.
• COT Index: above 80% since July, peaking at 100% → continuous accumulation by Commercials.
• Open Interest: very high → massive market participation.
• On-Balance Volume (OBV): still negative → typical for final shakeouts before reversals.
📈 Historical Parallels
Looking back at the 5 biggest Commercial Long positions (2011, 2015, 2018, 2020, 2025):
2020: +55% rally within 3–6 months after record Commercial longs.
2015: +30% rally within 90 days.
Other cases: Average performance +10% (T+30), +21% (T+60), +31% (T+90).
👉 Every major COT extreme in Sugar was followed by a double-digit rally.
🟢 Trading Idea (Setup)
Bias: Bullish (expecting potential short squeeze / fund covering).
Entry Trigger: Breakout above key moving averages (e.g. 50-day SMA).
Stop: ATR-based or below recent swing lows.
🎯 Targets
TP1 = partial profit at +1.5R.
TP2 = trend-following → historically, rallies extended 20–30% within 2–3 months.
📅 Seasonality: Q4–Q1 tends to be bullish for Sugar (ethanol demand, Brazil harvest).
⚖️ Risk/Reward
Historical CRV of similar setups: 1:3 to 1:5.
Best rallies occurred when Commercials held positions >100k for several weeks while funds stayed heavily short.
📌 Conclusion
Sugar is showing one of the rarest COT setups of the past two decades.
Commercials are heavily long, funds massively short, and open interest is extreme.
The last time this happened (2020), Sugar rallied more than 50%.
📈 History suggests we could see another powerful move higher.
⚠️ Reminder: Next WASDE report → 09 Oct 2025

GBP/USD Setup: Breakout or Fakeout at 1.3600 Key Level?🔎 Technical Analysis
On the daily chart, GBP/USD is trading around 1.3550 after rejecting the dynamic support of the ascending channel. The key resistance lies at 1.3600. A daily close above this level could open the way towards 1.3700–1.3750, a strong supply zone. RSI remains in consolidation, far from extremes, suggesting more room for upside.
Scenarios:
Bullish: Break above 1.3600 → target 1.3700–1.3750.
Bearish: Rejection below 1.3500 → retracement to 1.3400, extension to 1.3280.
📊 COT Report
USD Index (CFTC 09/09/2025): Non-commercials added +5.5K longs and +6K shorts, net short remains dominant → slightly weak USD bias.
British Pound: Non-commercials trimmed longs (-1.2K) and shorts (-748), but commercials added massive longs (+66K) → long-term bullish hedging on GBP.
👉 Overall: GBP supported, USD weak → bullish bias for GBP/USD.
📅 Seasonality
September historically shows a neutral/slightly bearish tendency for GBP/USD (-0.3% average over 20 years). The 2-year model suggests a mid-September drawdown followed by recovery in October.
👉 Mixed bias: short-term weakness possible, but October seasonality favors GBP strength.
🧠 Retail Sentiment
63% short vs 37% long.
Retail is heavily short – a classic contrarian signal, pointing towards a possible upside liquidity grab above 1.3600–1.3700.
📌 Trading Plan
Primary bias: Bullish above 1.3500 targeting 1.3700–1.3750.
Confirmations: COT favors GBP, retail short, bullish technical structure.
Risks: September seasonality slightly bearish → potential pullback to 1.3450 before resuming higher.

EUR/USD Breakout Incoming? COT & Sentiment Point to 1.1850COT Report (09/09/2025)
EUR (Euro FX CME): Non-Commercials increased longs (+2,389) and reduced shorts (-3,696) → bullish bias.
USD (US Dollar Index): Non-Commercials remain net short (24,750 vs 19,192 longs). Slightly bearish bias on the dollar.
👉 The combination suggests a favorable context for Euro strength against USD.
📊 Seasonality
September is historically flat or slightly negative for EUR/USD, but over the last 5 years seasonality shows a recovery in the second half of the month.
👉 This reinforces the idea that downside risk is limited and that pullbacks may offer long opportunities.
🧠 Sentiment
Retail traders: 74% short, only 26% long.
Classic contrarian signal: retail is short, which supports a long bias.
📉P rice Action & Technicals (H1/D1/W1)
Price is moving inside a daily ascending channel (uptrend in progress).
Key resistance: 1.1800 – 1.1850 (weekly supply cluster).
Main support: 1.1650 – 1.1600 (daily demand zone, RSI reacted).
Daily RSI above 50 → positive momentum, not overbought.
✅ Operational Summary
EUR/USD shows a favorable context (fundamentals + COT + sentiment) supporting the upside.
Technical structure favors a test of 1.1850 resistance.
Best strategy: look for long entries on pullbacks or breakouts, with invalidation below 1.1650.

CADJPY Breakdown Incoming? Specs Selling CAD, Buying JPY1. Retail Sentiment
68% long vs 32% short → The majority of retail traders are positioned long.
From a contrarian perspective, this increases the risk of a downside move to flush out these long positions.
2. Seasonality
JPY (September): historically tends to appreciate from mid-month onward.
CAD (September): historically weak, with flat to negative performance.
Seasonal Bias: favors strong JPY / weak CAD → bearish CADJPY outlook.
3. Commitment of Traders (COT)
CAD (Sept 16, 2025):
Non-commercials: still heavily net short (128k short vs 21k long).
Commercials: strong long exposure (218k), but speculative flows remain bearish.
Bias: CAD continues to be sold by speculators → bearish pressure.
JPY (Sept 16, 2025):
Non-commercials: net long (161k long vs 100k short).
Commercials: strong shorts (163k), as usual for hedging.
Bias: speculators are accumulating JPY longs, reinforcing strength.
👉 COT View = Weak CAD, Strong JPY → Bearish confirmation for CADJPY.
4. Technical Analysis
Current price: 106.77, trading inside the daily demand zone (106.50–106.00).
Structure:
Well-defined descending channel.
Multiple bounces in the 106.00–106.20 area → key support zone.
RSI neutral, not yet oversold.
Scenarios:
Scenario A (probable): break below 106.20 → extension towards 105.50, then 104.80 (swing low zone).
Scenario B (alternative): technical bounce from demand (106.20–106.00) → recovery towards 107.80/108.00 (weekly supply).
✅ Conclusion: CADJPY shows a bearish setup supported by COT, seasonality, and contrarian sentiment. The technicals highlight a descending channel with potential breakdown below 106.00. Best setups: short on pullbacks with targets at 105.50–105.00.

EUR/GBP at a Critical Level: Breakout or Fakeout?1. Seasonal Tendencies
September over a 20y–15y horizon is historically neutral to slightly positive.
In the last 5y and 2y, however, seasonality has shown stronger bullish tendencies with significant average gains.
October, on the other hand, historically turns negative, suggesting that the current bullish momentum may face resistance and a potential reversal next month.
📌 Seasonal Conclusion: Short-term bullish support until the end of September, but a correction risk in October.
2. Sentiment
90% of retail traders are short from around 0.8623.
Only 10% are long, with worse average entries at 0.8682.
Such an extreme imbalance signals a high risk of a bullish squeeze: retail traders are fighting the trend and often end up trapped.
📌 Sentiment Conclusion: Contrarian bullish → likely continuation higher into liquidity zones.
3. Commitment of Traders (COT)
Euro: Non-Commercials reduced longs (-4,788) and added shorts (+3,130). Commercials increased longs. Net pressure is bearish from speculators, but institutional support remains.
Pound: Non-Commercials increased longs (+5,947) and cut shorts heavily (-21,078). Commercials drastically reduced longs (-71,750).
Speculators are becoming more bullish on GBP, while institutions are scaling back. Short-term this may favor GBP, but with retail heavily short on EUR/GBP, there’s still room for upward pressure.
📌 COT Conclusion: Mixed outlook, but with a slightly bullish bias on EUR/GBP as long as the market unwinds retail shorts.
4. Technical Analysis (Daily Chart)
EUR/GBP is trading at 0.8720, testing a daily supply area (0.8730–0.8770).
Structure: ascending channel, with the latest bullish impulse from 0.8620.
RSI is in overbought territory, signaling stretched conditions.
📌 Technical Conclusion: The market is at a critical juncture → a break above 0.8730 opens the door for longs, while a strong rejection would confirm a correction.
Overall Bias: Slightly bullish in the short term (September + retail shorts), but reversal risk rises into October.

Sugar Futures Long SetupThis is my play — based on seasonality, COT index, and supply/demand.
Seasonality into Q4 historically supports sugar strength.
COT Index: commercials/hedgers are now heavily long, which typically signals a turning point — these players are often positioned opposite speculators at major inflection zones.
Managed money has been trimming shorts, opening the door for a short-cover rally.
Price is pressing into a long-term base zone, with RSI washed out and downside momentum stalling.
Trade Plan
✅ Entry: initiating longs around current levels (~15.8c/lb).
🎯 Target (TP): 17.50c/lb — confluence of prior resistance and seasonal tendency.
🔒 Stop: under recent structure lows (~14.8c/lb) for clean invalidation.
Bias
Positioning, seasonals, and supply/demand all line up for a long setup.
With commercials positioned aggressively long, I see this as a potential turning point with asymmetric upside into 17.5c.
⚠️ Not financial advice — just my read on sugar positioning and seasonals.

USDCAD Breakdown Ahead? Seasonality & COT Divergence1. Retail Sentiment
59% short vs. 41% long: retail traders are moderately short on USD/CAD.
This leaves room for a potential upside squeeze, but positioning is not extreme, so the contrarian signal remains only partial.
2. COT Report
US Dollar (COT):
Large Speculators net short USD (–5,558 contracts).
Commercials net long USD (+6,642 contracts).
→ Speculators are unloading USD, pointing to structural weakness.
Canadian Dollar (COT):
Large Speculators net short CAD (–108,917 contracts).
Commercials net long CAD (+115,041 contracts).
→ A classic pattern: commercials are buying CAD while speculators remain heavily short. Historically, such extreme divergence often precedes CAD appreciation phases.
COT Summary:
USD: weakness from speculators.
CAD: commercials strongly long, speculators extremely short.
→ Clear divergence: potential CAD strength, bearish bias for USD/CAD.
3. Seasonality
September has historically been bearish for USD/CAD:
–0.37% over the last 20 years.
Also negative on 10- and 2-year averages, more mixed on 5 years.
The second half of the month tends to favor CAD strength.
4. Technical Outlook
Supply Zone: 1.3850–1.3900 (key resistance repeatedly tested and rejected).
Demand Zone: 1.3700–1.3720 (first short target), followed by 1.3600–1.3650.
Structure:
Strong rejection from the 1.3890 area.
Lower highs forming.
50–100–200 MAs in bearish confluence.
Daily rejection candle, confirming downside continuation potential.
5. Trading Plan
Bias: Bearish (short USD/CAD).
Setup:
Short on pullbacks to 1.3840–1.3860.
Target 1: 1.3720.
Target 2: 1.3650.
Invalidation: daily close above 1.3900.
Confluences:
✔ Retail moderately short → room for squeeze, but not extreme.
✔ COT: weak USD + strong CAD commercials → bullish CAD signal.
✔ Seasonality: September historically bearish for USD/CAD.
✔ Technicals: rejection at supply + bearish structure.

EUR/USD at Make-or-Break Zone: Rejection Incoming1. COT Report (Commitment of Traders)
USD Index: Non-commercials (speculators) remain net short on the dollar (13,645 long vs 18,666 short). However, last week saw a slight increase in longs (+487) and a decrease in shorts (-597). This indicates a modest improvement in sentiment toward the greenback, though not yet a full reversal.
Euro: Non-commercials remain heavily long (255,660 long vs 136,068 short). Yet, last week showed a reduction in longs (-2,726) and an increase in shorts (+721), suggesting profit-taking and weaker bullish conviction.
👉 Overall, the COT reflects a potential rebalancing: euro net longs are being reduced, while dollar shorts are unwinding. This aligns with a possible relative strengthening of the USD.
2. Retail Sentiment
72% of retail traders are short EUR/USD, while only 28% are long.
👉 A classic contrarian signal: when the majority is short, the risk of upside squeezes remains. However, context matters—price is near key technical resistance, which leaves room for a potential fake-out to the upside before a reversal.
3. Seasonality (September)
Historically, September has been slightly positive for EUR/USD (+0.0021 average over the past 20 years).
👉 Seasonality favors a mild sideways-to-bullish bias in the early weeks of the month, with heightened volatility mid-month.
4. Technical Analysis (Chart)
Price is trading around a major resistance zone (1.1750–1.1800), which has already been rejected multiple times.
Structure: consolidation persists within the 1.1650–1.1750 range. Key demand lies at 1.1550–1.1600, extending down toward 1.1400 if breakdown occurs.
RSI is neutral—not overbought—leaving room for directional moves.
👉 Technical setup: failure to break 1.1750 opens the risk of a retracement toward 1.1600–1.1550, and potentially 1.1400, consistent with your chart projection.
Conclusion
COT: euro longs unwinding, dollar shorts decreasing → tilt in favor of USD.
Retail sentiment: contrarian, heavily short → risk of short-term upside spikes.
Seasonality: mild positive bias in September with mid-month volatility.
Technical: strong resistance at 1.1750, risk of rejection toward 1.1600–1.1550.
📌 Trading Bias : Neutral-to-bearish. In the short term, EUR/USD could test/spike above 1.1750 to hunt stops, but the medium-term outlook (COT + technicals) remains skewed toward a bearish correction into 1.1550–1.1450. Only a solid weekly breakout above 1.1800 would invalidate the short scenario.

NASDAQ on the Edge: Head & Shoulders + Bearish SeptemberOn the daily chart, a clear Head & Shoulders formation has developed: left shoulder in mid-July, head in early August, and right shoulder completed at the end of August. The neckline has been broken with volatility, and price is now retesting the supply zone at 23,600–23,800. This pullback aligns with a weekly area of strong supply, suggesting a potential rejection.
The projected target of the pattern points toward 22,800–22,600, an area overlapping with a key structural support. RSI shows bearish divergence and remains below the midline, reinforcing the short bias.
COT Report (August 26, 2025)
Non-Commercials (funds/speculators): +1,875 longs, -362 shorts → small long increase, but without strong conviction.
Commercials (hedgers): -5,832 longs, -1,579 shorts → clear reduction in long exposure, less bullish protection.
Net change: -5,275 longs → overall unwinding of long positioning, signaling underlying weakness.
Interpretation: Speculators remain net long, but commercials significantly cut exposure, suggesting caution on further upside.
Seasonality (September)
Historically, September has been a negative month for NASDAQ:
10-year average: -148 pts
5-year average: -313 pts
2-year average: -804 pts
The seasonal pattern supports a bearish bias, with weakness usually concentrated in the first half of the month.
Synthesis & Trade Bias
Technical: Bearish Head & Shoulders → target 22,800–22,600.
COT: Net long reduction by commercials → bearish pressure.
Seasonality: September statistically weak.
➡️ Bias: Short on NASDAQ (NQ).
