Crashpattern

Epitome of a BubbleThis chart is unbelievable. This isn't a penny stock, this is Apple. This is Apple during the worst economic crisis of our lives which is in some ways worse than the Great Depression. What are investors buying at these highs thinking? Are they thinking unemployed people buy expensive phones? Are they thinking the collapse of so many businesses means it's a great time to buy into the market? Or that when equities are even more overvalued than at the peak of the tech boom/crash of 2000, it's the best time to buy into tech? The answer is simple: nobody is thinking.
This is a very odd time when people have started to herd... to act like lemmings running toward the cliff. They've lost the ability to think as individuals and just follow whatever the person next to them is doing, no matter how absurd. On the news, in the streets, and in the markets we see mob-mentality run amok. When the pain comes, and it will come, we will look back and wonder what the hell everyone was thinking. Let me assure you, nobody is thinking. People don't think when they are in a mob.
Don't bother now, but after this has all imploded, google: blow-off-top, the dotcom bubble, the Dutch Tulip Bubble, or the South Sea Bubble. You'll recognize what you find, and you'll learn something.


Another Crash Immanent?I noticed that the current rally in the S&P 500 shares fractal like similarities to the pre-crash market. Running through some trendline analysis with support becoming resistance on both the pre-crash and post crash rally it appears that we could see a similar February like crash coming to the new rally. Obviously markets aren't always the same but there is a great deal of symmetry throughout the market, in patterns like head and shoulders for instance. Something to watch out for as the market gives us more clarity in the next few days. Who can honestly say the current rally is representative of the fundamentals in the real economy right now? Another crash might be unavoidable.

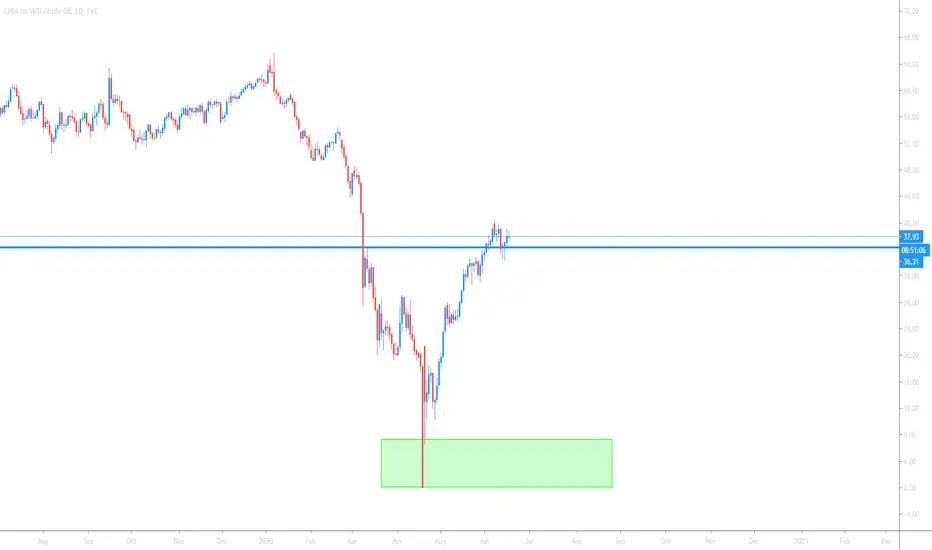
CRUDEOIL - KILLZONESimilar analysis as my other charts, Oil previously crashed and hit the bottom at this level. I see many indications that this will fall again and potentially hit the bottom.
Price is constantly testing support and now consolidating. Once price has broken support its a big sell.

3 Days for another -60% Crash.After all that rejection at 10K. Watch out for another -60% crash in 3 days.

WAIT!!!Is that a Head and Shoulder pattern Nifty just completed, saying i have turned Bearish from Bullish???

DAX INDICES COMPARING 2000 AND 2008 CRASHIF THE MARKET BREAK EMA LINE THAT WILL BE A STRONG BUY SIGNAL

(Modern Economic History) The Crash before the Crash? There are several types of "Crashes before the Crash"
Types of "Crashes before the Crash" Include:
1. "Fundamental Collapse" A foundational collapse where everyone is suppose to learn an important economic or philosophical "lesson". An entire Era and "economic school" collapses and "students (traders)" never return to class for at least a semester? Considered an "essentially" collapse where everyone knows something was going wrong and yet they still allow the collapse!?
2. "Popular Crash" or "Sudden and Quick Collapse". (which also includes sudden computer or mathematical algorithms high frequency collapses)
3. Controlled Crash (slow economic collapse)
4. Euphoric Collapse (blips and glitches) "Economic Echos" and "general taps and reminders from god"
All of these types of Crashes or Collapses can be very painful over a long period of time. Sometimes for 20 to 30+ years like the "Great Depression" that lasted into the middle 1955's (and all grandparents still remember). These types of crashes can also be about "food" and "all life on earth". Simple Controlled Crashes can also last 2 or 3 years like in ones that started in 2000 and 2008.
"crash before the crash"?
:(

The Bottom Of S&P 500After are few weeks seeing a pull back by the bulls by 20%, In late April a push down to nearly 30% to corrective levels by the bears to me seems to be arising and then this should be the bottom before we clime to 4000 level.
Sorry If my English is Sh*t.

KHCKraft/Heinz looks about ready to blow out of this massive falling wedge. Kinda has me thinking stock markets maybe done crashing because the wedge bottom line just lines up so perfectly. If KHC has in fact bottomed here it could be putting in a big move up probably 200% move up

US 30 Breaking the 200 WMA: Great Crash of 2020Breaking the 200 week MA is a severe technical breakdown. Becomes bottomless after this. Last seen in 2008, 56% selloff.
Panic selloff. Irrational exuberance replaced by irrational fear. Short the rallies, try not to get killed; GLTA!
Not advice, clearly just an irrational idea. A fierce bear rally can occur at any time, trade at your own risk.

Ladys&Gentlemen: BITCOIN -The great FOMO depression of 2020-2022Hi,
this is the BTC view. Please also watch my Dow Jones chart of the great FOMO depression.
as i´m professional lazy i will not write too much,
The corona virus is a catalyst for the great FOMO depression of 2020-2022.
As you can see, (watch DOW JONES chart "the great FOMO depression") we have the same pattern like the great depression at the beginning of the 19th. century.
Bitcoin and Cryptocurrencies will solve the liquidity crisis, bring new value into the world via smart contracts and a new decentralized financial system through Ethereum and other great blockchains...
The estimated high of BTC in the year June/july 2022 will correlate with the estimated low of the Dow Jones. So open up an international broker account and learn to pick the solid companies which will prosper.
The world will not end. The Dow Jones low of 2008 is not the end. It is a new start. A once in a lifetime opportunity.
I wish you all the best

Ladys and Gentlemen: The great FOMO depression of 2020-2022. Hi,
as i´m professional lazy i will not write too much,
The corona virus is a catalyst for the great FOMO depression of 2020-2022.
As you can see, we have the same pattern like the great depression at the beginning of the 19th. century.
Please also watch my Bitcoin Chart Version of "The great FOMO depression of 2020-2022"
Bitcoin and Cryptocurrencies will solve the liquidity crisis, bring new value into the world via smart contracts and a new decentralized financial system through Ethereum and other great blockchains...
The estimated high of BTC will correlate with the estimated low of the Dow Jones. So open up an international broker account and learn to pick the solid companies which will prosper.
The world will not end. The Dow Jones low of 2008 is not the end. It is a new start. A once in a lifetime opportunity.
I wish you all the best

Use HG Divergence to predict US market crashingPurpose of the observation:
Use HG weekly chart Divergence to continuously monitor US market and predict the crashing timing.
- Mar 2019 HG divergence indicated a downtrend.
- Jul 2019 HG divergence indicated a uptrend.

Chinese New Year - massive dump is most probably scenario !!!RSI is hitting the upper line, which never failed in BTC history to predict imminent crashing event.
On the other hand, talking about fundamental analysis, Chinese New Yea r event is going to happen in two weeks.
Historically, every January , BTC has had great price rise movements (5-10%) between 3th-7th January and massive DUMPS a few days later as you can check it out here:
1. 2015 (14 January) - Dump from 320$ to 150$, which is -50%
2. 2016 (16 January) - Dump from $460$ to $360$, which is -20%
3. 2017 (11 January) - Dump from $1120 to $770, which is -35%
4. 2018 (16 January) - Dump from 17500$ to $9700, which is -45%
5. 2019 (10 January) - Dump from 4000$ to $3500, which is -15%
6. 2020 (?)
Why this happens ? Because Chinese New Year , which is like western Xmas seasonal sell off, but much bigger. This massive dumps happens 10-15 days before Chinese New Year date.
In 3-7 days we will see how much % BTC will drop . My best is 30% = $5,000, reaching out the bottom at early Spring ($3,000) right before long trend reversal.

BTC is gonna harddump in next 24hPrice would need to stay above 8500 for 3 weeks to reverse the current baerish trend.
After a high %10 price rise, time to fall.

BTC Crash every January (-15 to -50%)As you can check it out here:
1. 2015 (14 January) - Dump from 320$ to 150$, which is -50%
2. 2016 (16 January) - Dump from $460$ to $360$, which is -20%
3. 2017 (11 January) - Dump from $1120 to $770, which is -35%
4. 2018 (16 January) - Dump from 17500$ to $9700, which is -45%
5. 2019 (10 January) - Dump from 4000$ to $3500, which is -15%
6. 2020 (?)
In 10 days we will see how much % BTC will drop. My best is 30% = $5,000, reaching out the bottom at early Spring ($3,000) right before long trend reversal.

Time fib and equal measured move on the SPX, Crash indicatorWe are on a 2.618 TIME FIB of the 2 previous pre-market crashes
The equal measured move takes us to 3470
Most probably is the last rally before the crash

This is why BTC will drop to $3.000.doji pattern with low peak 2019 volume record bearish longterm trend
. 3 days prior to Xmas Day Selloff
. Bearish Cross on 3-Day ( only third time in BTC 's history, all previous ones set up a new midterm-6months bearish market with 50% losses )
. Bulls shorted at 7500 peak three days ago achieving 15% gains :dollar:
Only men blinded by pigheadedness wouldn't see the massive dump that it's comming.

BTC DOWNtrend is REALWe pumped from 7.400 to 9.600 (29%) two months ago, but the bear trendline kept his downtrend :downtrend: continued.
24h ago, BTC hit 6.500 following a (15%) pump wave til 7.500 peak. Nice short profits, now back to the main longterm trend.
Bulls are enjoying a small flash pump which is necessary in any trend (up or down) in order to short and continue the trend.
BTC trend remains the same; downtrend .
Most FA and TA, even the mainly one 200EMA, are still intact. These indicators explain how BTC will hit 3k :downtrend: by early Spring.
horterm: downtrend ($6800)
Midterm: downtrend ($5900)
Longterm: downtrend ($3000) - March 2020

6K is imminent, $5.000 soon.As you can see BTC is repeating the same pattern which was played out the previous year, just quicker.
if 7.050 is broken, which is most probably scenario, then 6k will be displayed for a few days as the new support .
The chart is showing up 200EMA indicator , the only reliable indicator for BTC .
This idea displays an unavoidable scenario: bulls are doing their best to stop the price crash without luck. BTC will drop to $5.000 in the following weeks (1-2).
On the other hand the volume is decreasing, which supports the idea about sideway trading = further price crash.
As previously discussed, 200EMA is so far away, minning cost s for most machines are around 3k, and otherwise, bear in mind about minners have been able to still minning with losses for an average 6months according to previous halvings.
In a nutshel, most of indicators show up strong SELL signals.
There's a huge descending triangle which has been forming when BTC hit 14k 5 months ago, this retracement was expectable.
Furthermore, there's an special interest for whales about stretching out the bottom ($4.000) in order to make bigger gains in late 2020 (Expect a cup and handle pattern which plays the keyrole for trend switcher).
BTC probably will drop to 6k in the following day/s and if that happens, we can talk freely about 5k before Xma s.
Open shorts whenever you got a profit (even if that's less than 1%) while you can do it. Stop losses = 1%.
