BTC/USDT | Hold 90K or Prepare for a Heavy Flush? Let's See!CRYPTOCAP:BTC pushed into $94,700, tapped the target perfectly, and then slipped into a sharp correction. Right now Bitcoin is trading around $90,000, and the entire market is focused on a single decision level. If BTC can stabilize above $90,000 within the next 24 hours, the bullish structure stays alive and we can look for a continuation toward $97,000 and then $100,000.
If BTC fails to hold $90,000, the door opens for a deeper decline and the first downside target becomes the $78,000 demand zone. This is the point where the next major direction gets decided.
Please support me with your likes and comments to motivate me to share more analysis with you and share your opinion about the possible trend of this chart with me !
Best Regards , Arman Shaban
Crypto
Why the Market Loves to Trap Traders!!!If trading ever feels personal, it’s not.
The market isn’t hunting you; it’s hunting liquidity.
Understanding this single idea changes how you read charts forever.
1️⃣ The Market Moves Toward Liquidity, Not Logic
Most traders expect price to move because a pattern is “complete” or a level is “perfect.”
In reality, price moves to where orders are sitting.
Where is liquidity usually found?
- Above obvious highs
- Below obvious lows
- Around round numbers
- Near breakout levels everyone is watching
The market goes where the orders are, not where traders hope it goes.
2️⃣ Breakouts Are the Most Common Liquidity Pools
When price approaches a clear resistance, traders place:
- breakout buys above
- stop-losses from shorts just above
That creates a liquidity magnet.
Price spikes above the level, fills those orders…
and often reverses sharply once liquidity is consumed.
That’s not manipulation... that’s mechanics.
3️⃣ Traps Reveal Who’s Really in Control
A trap happens when price:
- breaks a key level
- fails to follow through
- returns back inside the range
This tells you something critical:
➡️ The side that should have won… didn’t.
4️⃣ Professionals Don’t Chase; They Wait
Retail traders react to the breakout.
Professionals wait for the reaction after the breakout.
They ask:
- Did price accept above the level?
- Did momentum expand or fade?
- Did structure shift or snap back?
Patience turns traps into opportunities.
📚The Core Lesson
The market’s job is not to reward anticipation. It’s to test conviction.
Once you stop trading where everyone else enters and start observing who gets trapped,
price action becomes clearer, calmer, and more logical.
⚠️ Disclaimer: This is not financial advice. Always do your own research and manage risk properly.
📚 Stick to your trading plan regarding entries, risk, and management.
Good luck! 🍀
All Strategies Are Good; If Managed Properly!
~Richard Nasr
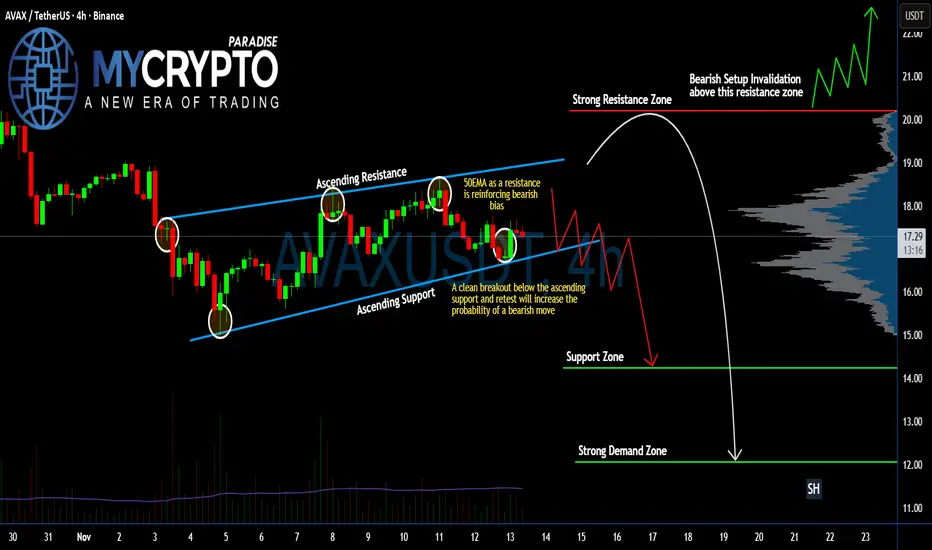
Is #AVAX Ready For a Massive Bearish Move or Not? Must Watch Yello Paradisers! Have you been keeping an eye on what’s happening with #AVAXUSDT? If not, you might be walking straight into a bearish trap. Let's break down the #Avalanche setup:
💎#AVAX has been trading inside an ascending channel, clearly respecting both the ascending support and resistance. We’ve now seen multiple strong rejections from the upper boundary, and most importantly, the 50 EMA is now acting as resistance, reinforcing a growing bearish bias across the board.
💎Current price of #AVAXUSD is $17.26, and we’re hovering just above the key ascending support. A clean breakdown below this support, followed by a bearish retest, would flip the structure and significantly increase the probability of a sharp bearish continuation.
💎If this bearish scenario plays out, we’re targeting the next Support Zone around $14.24. But that’s not where the real pain ends. The real liquidity is parked in the Strong Demand Zone around $12.07, where we could see aggressive buyer activity re-enter—if the market doesn’t capitulate first.
💎This entire bearish setup becomes invalid only if #AVAX manages to reclaim the $20.19 resistance zone. A breakout above that would invalidate the breakdown scenario and likely open the gates for a fast rally into the $22+ region.
Trade smart, Paradisers. This setup will reward only the disciplined.
MyCryptoParadise
iFeel the success🌴
ADA/USDT | Cardano Pulls Back After the Rally! What's Next?CRYPTOCAP:ADA pushed all the way to $0.485 before getting hit with a sharp correction and right now price is trading near $0.40 which is roughly a sixteen percent drop from the recent high. Nothing major has changed in the broader structure because the key zone has always been the $0.32 to $0.36 demand range. If ADA drops into that area again I expect a fresh wave of buyers to step in just like the previous reactions.
For now I want to see if momentum cools down a bit more and whether ADA will revisit the deeper demand levels. That is still the zone where the next strong bullish leg can start building again.
Please support me with your likes and comments to motivate me to share more analysis with you and share your opinion about the possible trend of this chart with me !
Best Regards , Arman Shaban

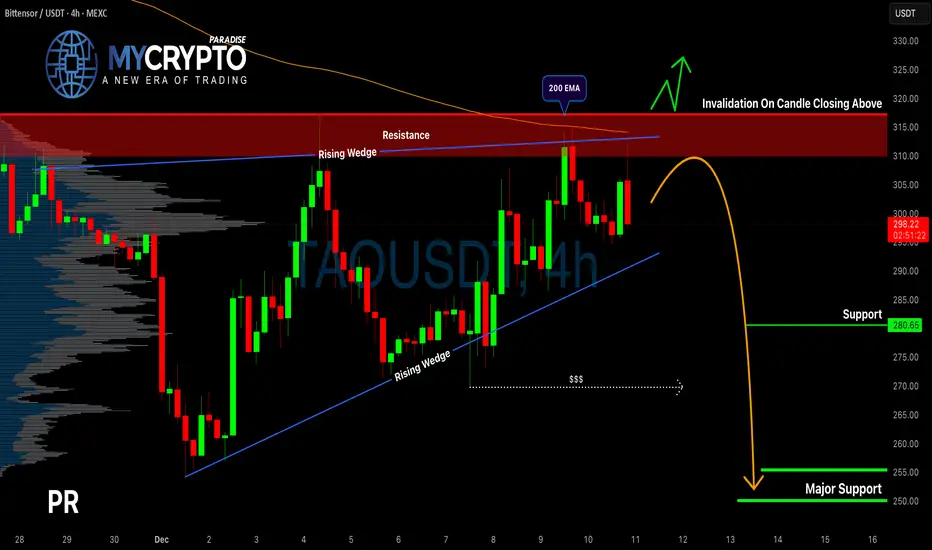
TAO Showing Weakness at Resistance — Is a Breakdown Imminent?Yello Paradisers! Are we about to witness a sharp rejection from resistance… or is this just the calm before the breakout storm?
💎TAOUSDT is currently reacting from a strong resistance zone and what makes things even more interesting is the rising wedge pattern that has formed in this area. This type of structure historically points to a higher probability of a bearish move, and right now, the conditions are lining up for potential downside.
💎But to secure a better risk-to-reward (RR) setup, a small pullback from the current level would be ideal. After that, we’ll look for a clear bearish candlestick formation to confirm entry. The main targets lie below, around the liquidity pools and key support zones, which also align with strong long-term levels.
💎Still, there’s one critical invalidation point:
If the price breaks and closes above the resistance zone, it would invalidate the entire bearish setup. In that case, the smart move is to wait patiently for a cleaner structure and more reliable signals before acting.
🎖This is what trading like a professional looks like, clear setups, no emotional bias, and total commitment to risk management. It's not about predicting every move perfectly, it's about positioning only when the odds are in your favor.
MyCryptoParadise
iFeel the success🌴
SOL/USDT | Solana Is Testing Buyers Right Now, Pump or Dump?CRYPTOCAP:SOL rallied all the way to $146 before pulling back again and right now price is trading near $132. The correction is completely normal and the main demand zone sits between $122 to $132 which is exactly where Solana is reacting at the moment. This is the zone that needs to hold because losing it would open the door for a deeper drop.
If buyers fail to defend the current range there is still a clean lower demand area around $105 where I expect stronger accumulation and a possible start of the next bullish leg. For now I am watching to see if SOL stabilizes inside the $122 to $132 zone because a proper hold there usually leads to another upward push.
Please support me with your likes and comments to motivate me to share more analysis with you and share your opinion about the possible trend of this chart with me !
Best Regards , Arman Shaban

LTC/USDT | LTC Drops Hard but the Real Opportunity Might Be AheaCRYPTOCAP:LTC rallied all the way to $113 before getting slammed with a heavy correction, dropping more than 34% down to $75. Right now Litecoin is trading near $81 and the momentum is still clearly bearish. As long as this pressure continues, I expect a deeper correction toward the $63 to $70 demand zone.
This is the area that really matters for the next major move. If Litecoin reaches this zone and shows a clean bullish reaction, it becomes a high-interest region for a strong mid-term reversal. A proper reaction here can easily trigger a 100%+ upside move in the coming weeks or months.
For now I’m watching to see how price behaves as it approaches $63 to $70 because that’s where the next big opportunity is likely to form.
Please support me with your likes and comments to motivate me to share more analysis with you and share your opinion about the possible trend of this chart with me !
Best Regards , Arman Shaban

GBP/USD | Testing Supply Zone and Setting Up for Possible Drop!By analyzing the #GBPUSD chart on the 4 hour timeframe, we can see that after the initial drop, price bounced and pushed back into the 1.344 supply zone. Once it hit that level, strong selling pressure kicked in and GBPUSD dropped to 1.334. Right now the pair is trading around 1.336.
If price can hold below 1.33790, we can expect a deeper decline. If it fails to stay below that level, we may first see a pullback toward 1.340 before any major drop happens.
Please support me with your likes and comments to motivate me to share more analysis with you and share your opinion about the possible trend of this chart with me !
Best Regards , Arman Shaban
AUDUSD 4H chart patterns...AUDUSD – Target Levels (Based on my Chart)
From the image, AUDUSD (4H) is at a supply / resistance zone and shows a possible bearish pullback (downward arrow marked).
🎯 Downside Target Levels
If price gets rejected from the current resistance:
1. First Target: 0.6500 – 0.6480
Nearest support zone
Previous consolidation area
2. Second Target: 0.6420 – 0.6400
Strong demand zone
Major support / deeper correction target
📌 Important Notes
Overall move was bullish, but price looks overextended
Sell is valid only after rejection confirmation
If price breaks and holds above resistance, these sell targets are invalid
If my want, I can also give:
Exact entry & stop loss
Buy targets if market continues bullish
Scalp or swing setup

CAD/JPY – H4 Analysis ...CAD/JPY – H4 Analysis (As per My chart)
Market Structure
Overall trend was bullish, price respected the ascending trendline + Ichimoku cloud.
Price has formed a clear Double Top near the highs.
Recent candles show breakdown below momentum, signaling a bearish correction.
---
📉 Sell Scenario
Sell Zone: 112.30 – 112.80
🎯 Targets
Target 1: 109.50
Target 2: 106.50
---
❌ Invalidation
A strong H4 close above 113.80 will invalidate the bearish setup.
---
📌 Summary
Pattern: Double Top
Bias: SELL
Expectation: Price to move down toward lower demand zones

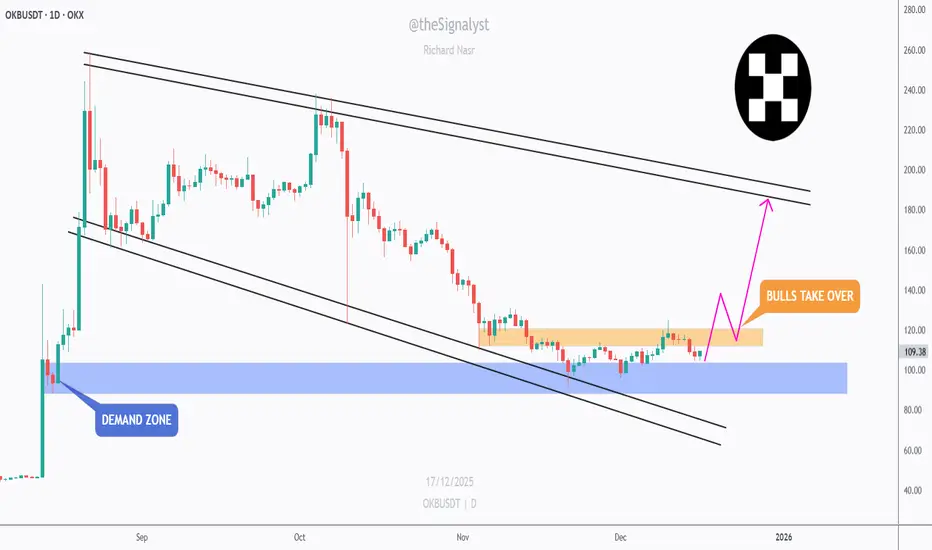
OKB - Are Bulls About to Flip the Script?📉After a prolonged corrective phase, OKB is starting to show early signs of structural stabilization. Price has respected the major demand zone, where selling pressure slowed down and downside momentum clearly weakened.
⚔️What stands out now is the tight consolidation above demand, combined with a gradual reclaim of higher levels. This type of behavior often signals a shift from distribution to accumulation, especially after a long bearish channel.
📍The key focus is the orange resistance band. A clean break and hold above this area would be a strong confirmation that bulls are taking control, opening the door for a larger recovery move toward the upper bounds of the broader structure.🏹
Until that breakout happens, patience is key. Let price prove strength before committing aggressively. But structurally, this is one of those zones where risk starts favoring the upside, not the downside.
Is this the quiet phase before expansion? 🤔
⚠️ Disclaimer: This is not financial advice. Always do your own research and manage risk properly.
📚 Stick to your trading plan regarding entries, risk, and management.
Good luck! 🍀
All Strategies Are Good; If Managed Properly!
~Richard Nasr
XAGUSD (Silver) 1H chart patterns...XAGUSD (Silver) – Target Levels (Based on my Chart)
From the image, price is moving inside an ascending (bullish) channel and is currently near the upper zone / high point of the market. The marked arrows show a possible correction.
🎯 Downside Target Levels
If price gets rejected from the upper channel:
1. First Target: 57.00 – 56.80
Mid / lower support zone of the channel
Likely first pullback area
2. Second Target: 51.50 – 51.00
Major demand & strong support
Channel bottom / deeper correction target
📌 Key Notes
Overall trend is bullish, but price looks overextended
Shorts are valid only after rejection / confirmation
If price breaks and holds above the upper channel, then correction targets are invalid
If my want, tell me:
Buy or Sell setup?
Scalping or Swing trade?
Timeframe (1H, 4H, Daily)?

GBP/JPY – H2 Analysis..GBP/JPY – H2 Analysis (According to My chart)
Market Structure
Price was in a strong uptrend, moving above the trendline and Ichimoku cloud.
Recently price broke below the ascending trendline and entered cloud resistance.
This shows a bearish correction / trend weakness.
---
📉 Sell Scenario (As per My markings)
Sell Zone: 207.50 – 208.20
🎯 Targets
Target 1: 205.50
Target 2: 203.50
---
❌ Invalidation
A strong H2 close above 208.80 will invalidate the sell setup.
---
📌 Summary
Previous Trend: Bullish
Current Bias: Bearish correction
Expectation: Price to drop toward lower demand zones

USD/JPY – H4 Analysis...USD/JPY – H4 Analysis (As per my chart)
Market Structure
Price has broken below the ascending trendline.
Trading below the Ichimoku cloud, showing bearish control.
Recent pullbacks are weak → continuation to the downside is likely.
---
📉 Sell Scenario
Sell Zone: 154.80 – 155.60
🎯 Targets
Target 1: 152.00
Target 2: 149.50
---
❌ Invalidation
A strong H4 close above 156.80 will invalidate this bearish setup.
---
📌 Summary
Trend Shift: Bullish → Bearish
Bias: SELL
Expectation: Continuation toward lower demand zones

XAU/USD (Gold) – H2 Analysis...XAU/USD (Gold) – H2 Analysis (According to my chart)
Market Structure
Overall trend is bullish, but price is currently facing strong resistance / supply zone at the top.
Price has shown rejection from the supply area and is moving back toward the Ichimoku cloud support.
This indicates a bearish correction within the larger uptrend.
---
📉 Sell Scenario (As marked on My chart)
Sell Zone: 4310 – 4340
🎯 Targets
Target 1: 4265 – 4270
Target 2: 4160 – 4180
---
❌ Invalidation
A strong close above 4360 will invalidate this sell setup.
---
📌 Summary
Trend: Bullish (higher timeframe)
Current Move: Bearish correction
Expectation: Price to drop toward marked demand zones before next continuation

HYPEUSDT - Probably Gone by the Time You Read This Alright traders, this is one of those setups.
Quick scalp…
or quick dump…
and honestly, it will probably be gone by the time I finish writing this analysis. 😅
But hey — let’s try it anyway.
Macro just came out mixed,
which usually means range mode activated.
And when the market ranges,
HYPE loves to do its little chaotic moves inside the box.
So yeah:
• fast idea
• fast execution
• zero attachment
I don’t even have much time to explain this one properly,
because it’s probably already moving as we speak. 😂
Quick analysis, quick decision, quick outcome.
Enjoy — and good luck traders! 🚀📉😄

EURUSD Short: Bears Defend Resistance - Next Stop 1.1700Hello, traders! EURUSD is trading within a broader bearish structure, with price action clearly respecting a descending trend line from the higher timeframe. Earlier, the pair reacted from a Pivot Point near the trend line and moved into a consolidation Range, showing indecision before the next directional move. During this phase, price attempted a breakout above the mid-range level, but this move turned into a Fake Breakout, confirming that buyers lacked strength at higher prices. Shortly after, EURUSD formed a clear Head and Shoulders pattern, with a well-defined left shoulder, head, and right shoulder, signaling a potential bearish reversal within the larger downtrend. Following the completion of the right shoulder, price pushed higher and briefly broke above the 1.1700 Demand Zone, but this breakout was quickly rejected. The market then reached the major Supply Zone around 1.1760, where sellers stepped in aggressively, causing a sharp rejection and confirming this area as a strong resistance.
Currently, EURUSD is pulling back from the Supply Zone and moving back toward the 1.1700 Demand Zone, which aligns with previous breakout levels and acts as a key decision area.
My scenario remains bearish as long as EURUSD stays below the descending trend line and the 1.1760 Supply Zone. I expect price to continue pulling back toward the 1.1700 Demand Zone, where the next reaction will define short-term direction. A clean breakdown and acceptance below the 1.1700 level would confirm bearish continuation and open the path toward lower support levels. If price temporarily reacts from demand, a short-term bounce is possible, but the overall bearish bias remains valid while price is capped below the Supply Zone and trend line. For now, sellers remain in control, with the main focus on a move back into the Demand Zone around 1.1700. Manage your risk!

ALCHUSDT – 4H trade ideaPrice is currently forming a bullish falling wedge, with liquidity resting at the 4H FVG below.
Based on the Total Market Cap context, I’m expecting a potential AMD scenario:
Possible wick down into the 4H FVG
Followed by a bullish breakout from the falling wedge
Price is consolidating above the Monthly VWAP, which supports the bullish bias.
If we see confirmation after the sweep, continuation towards higher levels becomes likely.
➡️ Check the weekly analysis for higher timeframe context.

XAUUSD: Rejection at Resistance - Support Zone at 4,270 in FocusHello everyone, here is my breakdown of the current XAUUSD setup.
Market Analysis
Gold (XAUUSD) is trading within a broader bullish structure, but the current price action suggests a short-term corrective move. After breaking above the descending Triangle Resistance Line, price entered a consolidation Range, where accumulation formed before a bullish Breakout. This breakout pushed XAUUSD higher toward the key 4,350 Resistance, which has acted as a strong reaction zone in the past.
Currently, at this resistance level, price showed clear hesitation and rejection, signaling that sellers are becoming active again. The market is now pulling back from the highs, moving toward the 4,270 Support Zone, which aligns with the previous breakout area and the rising Triangle Support Line. This zone is critical, as it represents the main demand area keeping the structure bullish.
My Scenario & Strategy
My scenario is short-term bearish as long as XAUUSD remains capped below the 4,350 Resistance. I expect a controlled pullback toward the 4,270 Support, where buyers may attempt to defend the trend.A clean breakdown below the support zone would confirm a deeper correction toward the Triangle Support Line.
However, if price holds above 4,270 and shows strong bullish reaction, the broader uptrend remains intact and another attempt toward the highs may follow. For now, the focus is on the pullback phase, with 4,270 as the key level to watch.
That's the setup I'm tracking. Thank you for your attention, and always manage your risk.

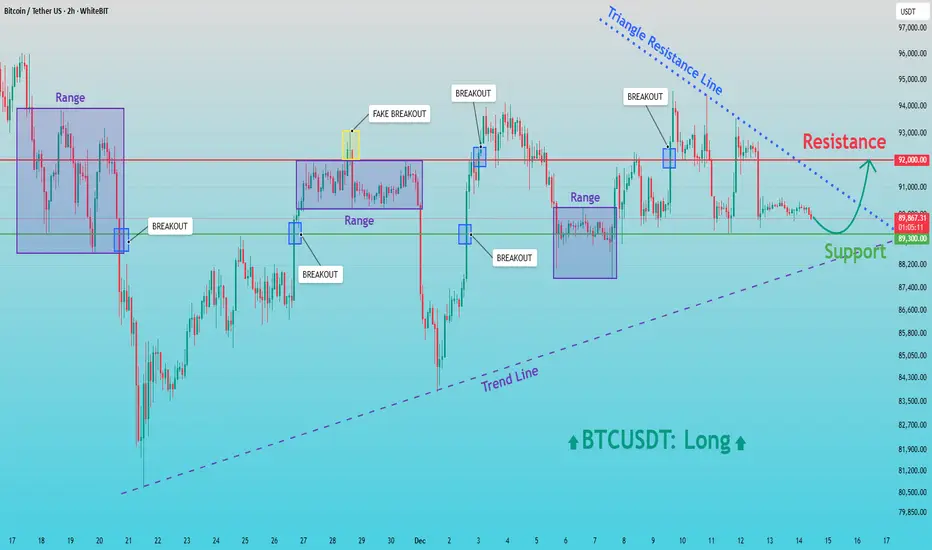
BTCUSD: Buyers in Control - Resistance Retest AheadHello everyone, here is my breakdown of the current BTCUSDT setup.
Market Analysis
BTCUSDT is currently trading within a broadly bullish structure, supported by a rising trend line that has been respected after the major sell-off and subsequent recovery. Following the strong decline, price formed a base near the lower levels and initiated a reversal, creating higher lows and shifting market control back to buyers. After the initial rebound, Bitcoin entered multiple Range phases, where price consolidated and built liquidity. Each range was followed by a breakout, confirming sustained buying interest. Some of these moves included fake breakouts, which briefly trapped participants before price continued to respect the broader bullish structure.
Currently, BTCUSDT is holding above the key Support Zone around 89,300, which has repeatedly acted as a demand area. Price is also compressing under a descending Triangle Resistance Line, while the rising trend line continues to support the market from below. This creates a tightening structure, suggesting that a decisive move is approaching. The 92,000 Resistance level remains the main barrier overhead, where sellers have previously stepped in and rejected higher prices.
My Scenario & Strategy
My scenario remains bullish as long as BTCUSDT holds above the 89,300 Support Zone and continues to respect the ascending trend line. I expect buyers to defend this area and gradually build pressure toward the upper resistance. A clean breakout above the 92,000 Resistance, especially with strong momentum, would confirm bullish continuation and open the path for a move toward higher levels, aligned with the broader trend.
However, if price fails to break the triangle resistance and loses the 89,300 Support, a deeper pullback toward the trend line could occur before buyers attempt another recovery. Until such a breakdown happens, the structure favors buyers. For now, the market remains constructive, with support holding and resistance at 92,000 as the key level to watch.
That’s the setup I’m tracking. Thank you for your attention, and always manage your risk.
Dash Is Sitting At The Strong Support Within The Wedge PatternDash made a strong rally, as anticipated earlier, but the recent sharp decline suggests that the five-wave bullish impulse has likely been completed. As a result, price action now appears to be in a higher-degree three-wave corrective phase. This pullback fits well with a broader ABC corrective structure following the impulsive advance.
On the 4-hour chart, Dash seems to be trading within wave C of this higher-degree correction. Moreover, price action suggests that the market may be in the final stages of wave (5) within a wedge pattern. This setup often signals trend exhaustion, especially when combined with strong historical support. In this case, the 40 area stands out as a key support zone where buyers could step back in and stabilize the price.
Given this technical structure, traders should be alert for a potential rebound and the early stages of a new rally, particularly if price manages to recover and hold above the 53.50 level. However, it’s important to remain cautious, as the first meaningful bullish evidence would only be seen on a breakout above the 71 area. A decisive move above 105 would then serve as full bullish confirmation, signaling that a larger upside continuation is back in play.
Until those levels are reclaimed, price action should be monitored closely, as volatility may remain elevated near the current support zone.

ETH Downtrend Accelerates, Rallies Favoured for Short SetupsOn the H4 chart, ETH has decisively broken below the 3,050–3,100 support zone and sold off aggressively under 2,950 with a long-bodied bearish candle, highlighting active selling pressure and an expanding downtrend. Following this drop, a fresh Fair Value Gap has formed around 2,980–3,020, extending a sequence of bearish FVGs — a typical signature of a market losing liquidity to the downside.
The key supply zone is now located between 3,080 and 3,150, where several technical elements align: the FVG, the lower boundary of the Ichimoku cloud, and a dense volume cluster. This confluence suggests a high probability of renewed selling interest should price stage a technical rebound into this area.
The preferred scenario is for ETH to retrace toward the 3,080–3,150 zone before resuming its decline, with an initial target at 2,880–2,900. If this level gives way, downside momentum could extend further toward 2,750–2,800. The bearish structure would only be invalidated by a clear H4 close above 3,200 accompanied by strong volume; until then, any rebound is viewed as a selling opportunity in line with the prevailing trend.

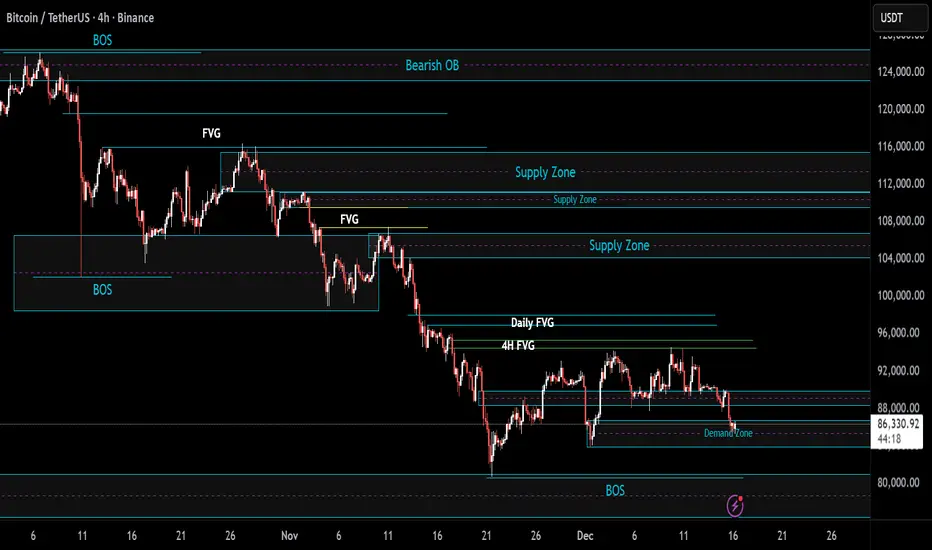
BTC/USDT | Bears in control? (READ THE CAPTION)Good day folks, hope you're doing okay.
As you can see and I previously mentioned, BTC dropped to the demand zone and now it's being traded at 86,560 level.
However, it is yet to break out of the demand zone, if it fails to do so, a drop to the low of the demand zone at 83,860 is possible. If it goes up, it'll be met by the FVG at 88,350.