BITCOIN hit $60k and is -50% from ATH. Did it crash too soon??Bitcoin (BTCUSD) almost hit the $60000 mark in early session today, which represents a more than -50% crash from its October 2025 $126000 All Time High (ATH).
** Is it happening too soon? **
Given that we haven't even completed 4 months since the ATH, the question that arises is this: Is this crash happening too soon??
Short answer: YES. And the reason is simple and has to do with the market's macro technicals. Today's $60k Low isn't just a -50% drop from the ATH but it is also taking place extremely close to its 1W MA200 (orange trend-line), while the 1W RSI turned oversold (below 30.00). All this just the second week after losing the 1W MA100 (green trend-line), which has been holding as the Support in almost the past 3 months of the 1W MA50 - 1W MA100 consolidation Rectangle.
** The 1W MA200 and oversold RSI **
That consolidation Rectangle has always served as the pattern that transitioned BTC from its early to the final stage of its Bear Cycle. However this is the soonest occasion historically that Bitcoin reaches its 1W MA200 from an ATH. On the 2014 Bear Cycle it took 59 weeks to do so, on the 2018 Bear Cycle 51 weeks (both were Cycle bottoms), on the 2022 Cycle almost half the time, 31 weeks not a Cycle bottom) and now we are 'just' 17 weeks (119 days) after. Needless to say, it is also the soonest it hit an oversold 1W RSI state, something that has historically coincided with a 1W MA200 test, so that's consistent.
** So what now? **
So what does this historically earliest crash mean for us today? Well most likely that we still have a long way to go. Given this aggressive drop, the market should continue to test at least the 1W MA350 (red trend-line), which is where the previous Bear Cycle bottomed in November 2022 (took almost as much time as the 1W MA50 - 1W MA100 consolidation Rectangle did from he moment the 1W MA200 broke) and we expect that to be around $48000 by May - June 2026.
However, based on the 4-year Cycle Theory, the Bear Cycle bottom should be around late September- October 2026. So practically the bottom could be even lower (potentially the 1W MA500 even as we presented on an analysis last month).
So what do you think? Is the fact that BTC crashed too soon to its 1W MA200 alarming? Feel free to let us know in the comments section below!
---
** Please LIKE 👍, FOLLOW ✅, SHARE 🙌 and COMMENT ✍ if you enjoy this idea! Also share your ideas and charts in the comments section below! This is best way to keep it relevant, support us, keep the content here free and allow the idea to reach as many people as possible. **
---
💸💸💸💸💸💸
👇 👇 👇 👇 👇 👇
Cryptocurrencies

TRXUSD 6-month Channel Down in total control targeting 0.2600.Tron (TRXUSD) has been trading within a 6-month Channel Down since its August 14 2025 High and is right now already halfway through its 3rd Bearish Leg.
Having lost both its 1D MA200 (orange trend-line) and 1D MA200 (orange trend-line), which should serve as the long-term Resistance from now on, we expect it to test the 1W MA100 (red trend-line) on the long-term.
On the short-term based on the previous Bearish Legs, we expect it to complete at least a -19.37% total decline form the Lower High, targeting 0.26000.
---
** Please LIKE 👍, FOLLOW ✅, SHARE 🙌 and COMMENT ✍ if you enjoy this idea! Also share your ideas and charts in the comments section below! This is best way to keep it relevant, support us, keep the content here free and allow the idea to reach as many people as possible. **
---
💸💸💸💸💸💸
👇 👇 👇 👇 👇 👇

Bitcoin - Pullback LevelsOn the larger timeframe, Wave 3 of the decline has been completed.
Locally, within this third wave, the fifth subwave has been completed.
We are currently in an upward corrective move. Let’s define the main targets.
Key targets:
75,000 - local correction
82,000
85,000
The potential move from the current level is 15-30% .
There is also an unfinished sub-division around 55,000 , but it appears unlikely.
---
Subscribe and leave a comment.
You’ll get new ideas faster than anyone else.
---

ETHEREUM Channel Down got oversold but this isn't the bottom!Ethereum (ETHUSD) is extending its losses as, following the January 14 rejection on its 1D MA100 (green trend-line), it made a Lower High on its 4-month Channel Down that kick-started the new Bearish Leg.
The 1D RSI turned oversold (below 30.00) for the first time since November 21 2025 but besides a (potential) short-term dead-cat-bounce towards the 0.382 Fibonacci retracement like on November 10 2025, it should bottom lower, at least at $1900 making a -44.80% decline (at least), similar to the previous Bearish Leg, before any meaningful longer term relief rally.
Technically, the strongest pressure zone (demand at this point) is the 1385 Support of the April 09 2025 Low.
---
** Please LIKE 👍, FOLLOW ✅, SHARE 🙌 and COMMENT ✍ if you enjoy this idea! Also share your ideas and charts in the comments section below! This is best way to keep it relevant, support us, keep the content here free and allow the idea to reach as many people as possible. **
---
💸💸💸💸💸💸
👇 👇 👇 👇 👇 👇

BITCOIN and the powerful Stoch RSI Cycle SignalThe Stoch RSI is a very rarely used indicator, in fact the last time we made use of it on Bitcoin (BTCUSD) was around the bottom of the 2022 Bear Cycle. We bring it forward to you once more as December closed with the 1M Stoch RSI below the 20.00 level. Historically, every time the market did that, BTC's new Bear Cycle had already started but it was still in its beginning.
You can see that during the majority of each Bear Cycle, the 1M Stoch RSI settled sideways below the 20.00 mark and when it broke back above it, the new Bull Cycle had already started. The time distance between those signals during the last two Cycles has been just over 1 year (13 months, 396 days). This suggests that by January 2027, BTC's new Bull Cycle will already have started most likely.
As to a potential bottom? The strongest candidate is the 3W MA100 (red trend-line), which has been hit during all previous three Cycles. That is currently around $53000 and rising, so we expect BTC to hit at least this level before a Bear Cycle bottom around October 2026. Additionally, the Mayer Multiple Bands (MMBs) green Zone, offers a Buy Zone, which priced the November 2022 bottom.
So what do you think? Is this Stoch RSI signal useful in your long-term positioning? Feel free to let us know in the comments section below!
---
** Please LIKE 👍, FOLLOW ✅, SHARE 🙌 and COMMENT ✍ if you enjoy this idea! Also share your ideas and charts in the comments section below! This is best way to keep it relevant, support us, keep the content here free and allow the idea to reach as many people as possible. **
---
💸💸💸💸💸💸
👇 👇 👇 👇 👇 👇

BITCOIN hit 10-month Low! Will it recover, at least a bit??Bitcoin (BTCUSD) almost hit today (so far) its 10-month Low of the April 07 2025 Low (Support 1). It did so after a very disappointing 2-week bearish streak where it initially had a crystal clear 1D MA100 (green trend-line) rejection, followed by two on the 1D MA50 (blue trend-line).
The pattern is technically quite similar to the January - March 2025 Channel Down correction that led to the April 07 bottom. With the 1D RSI turning massively oversold in the process, hitting the 23.50 Support, where both the November 21 2025 and February 26 2025 Lows were priced, it is possible to see a rebound to test the 1D MA50 at least, again.
Since however this is a Bear Cycle and not just a short-term correction within a Bull Cycle, we don't expect a sustainable rally like April - May 2025 but rather a prolonged sideways volatile price action, that could retest the 1D MA100 even before making a new Low and start Phase 2. For now, at least, a rebound to $87000 seems like a technical probability.
Do you think that's the case or BTC will drop even lower more aggressively? Feel free to let us know in the comments section below!
---
** Please LIKE 👍, FOLLOW ✅, SHARE 🙌 and COMMENT ✍ if you enjoy this idea! Also share your ideas and charts in the comments section below! This is best way to keep it relevant, support us, keep the content here free and allow the idea to reach as many people as possible. **
---
💸💸💸💸💸💸
👇 👇 👇 👇 👇 👇

Bitcoin(BTC/USD) Daily Chart Analysis For Week of Jan 30, 2026Technical Analysis and Outlook:
Bitcoin has undergone a significant decline during this week's trading session, resulting in the elimination of both the Mean Support levels at 85,300 and 82,000.
Current market analysis suggests a continued downward trajectory. Should Bitcoin breach the initial support level of Mean Support at 82.000, the immediate downside target will be our ultimate Outer Coin Dip at 78,500, followed by a subsequent target of the next Outer Coin Dip at 64,000.
On the upside, a rebound is anticipated upon reaching the Outer Coin Dip at 78,500. It is important to note that a gradual intermediate gyration may occur between the Mean Support at 82,000 and the Mean Resistance at 86,000 before the continuation of the downward trend.

BITCOIN This Bearish Cross is the final confirmation of collapseBitcoin (BTCUSD) is currently past a Relative Vigor Index (RVGI) Bearish Cross on the 3M (quarterly) time-frame. This is a huge development as it is basically the last indicator to confirm the new Bear Cycle beyond any technical doubt.
Every time this took place historically, BTC was on the first quarter of a Bear Cycle. The consistency between those Bearish Cross formations is remarkable: 15 or 16 quarters (1369 - 1461 days) between each occurrence.
What's even more interesting is that following each RVGI Bearish Cross, the Bear Cycle bottomed in exactly 4 quarters, i.e. 1 year. This technically confirm our long-term expectation from previous analyses that the current Cycle should bottom around October 2026.
In addition to the RVGI, take a look at the 3M RSI. The quarter before the RVGI Bearish Cross topped on the 7-year Lower Highs trend-line, consistent with all previous Highs.
So what do yo think? Is the RVGI right to confirm the new Bear Cycle and pinpoint its bottom around October 2026? Feel free to let us know in the comments section below!
---
** Please LIKE 👍, FOLLOW ✅, SHARE 🙌 and COMMENT ✍ if you enjoy this idea! Also share your ideas and charts in the comments section below! This is best way to keep it relevant, support us, keep the content here free and allow the idea to reach as many people as possible. **
---
💸💸💸💸💸💸
👇 👇 👇 👇 👇 👇

BTCUSDT 2H | $83k Hold vs $86-88k Rejection in Play?Previous short idea: Entry not triggered at $92k, but full collapse happened. TP @ $84,065 reached with wick to $83.38k low amid Microsoft (MSFT) earnings miss + AI overvaluation concerns and continued ETF outflows.
Now (current ~$84.3k–$84.5k): Minor bounce aligning with Nasdaq futures recovery on strong AAPL earnings (iPhone/services beat). Weekend thin liquidity ahead – chop or retest likely.
Focus:
- $83k–$83.4k must hold (psychological + low) → bulls defend = possible base
- Break → deeper to $81k or $78k zone
- Overhead: $86k–$88k heavy supply if bounce fails
Updated chart: TP hit marked + current bounce zone. Capitulation or more downside? ETF/news flow decides.
DISCLAIMER
Educational analysis only. Not financial advice. Crypto markets are volatile. Use proper risk management. Trade at your own risk!
If this helps your trading, likes, thoughtful comments, or follows are always appreciated!

SOLANA 2022 fractal shows crash to $30 is coming.Solana (SOLUSD) has been consolidating mostly within the last 2 months, with the 1W MA50 (blue trend-line) as its Resistance and the 1W MA200 (orange trend-line) as its Support. We have posted this chart more than two months ago, giving a timely sell signal to exit this market.
Based on the early 2022 price action, Stage 1 of that Bear Cycle was completed after a short-term rebound towards the 1D MA200 (red trend-line), which was rejected and initiated Stage 2. We expect that to be confirmed once the 1W MA200 breaks. Notice also the similarities between their 1W CCI fractals.
The minimum Target we have for the 2026 Bear Cycle is $30.00, which is both on the 0.618 Fibonacci retracement level from the previous Cycle bottom as well as the 2.78 Fib extension (blue) from the recent High and Low.
---
** Please LIKE 👍, FOLLOW ✅, SHARE 🙌 and COMMENT ✍ if you enjoy this idea! Also share your ideas and charts in the comments section below! This is best way to keep it relevant, support us, keep the content here free and allow the idea to reach as many people as possible. **
---
💸💸💸💸💸💸
👇 👇 👇 👇 👇 👇

BITCOIN isn't diverging from 2022 at all!Bitcoin (BTCUSD) continues to replicate the 2022 Bear Cycle almost in the exact same fashion. This is of course a concept we introduced back in October for the first time and so far it has fulfilled all conditions set in its way.
The most recent is the 1D MA100 (green trend-line) rejection, which in 2022 happened on March 02 and after another Support test, BTC rebounded for the final rejection on the 1D MA200 (orange trend-line). As mentioned before, that could be around $100k.
Assuming the 2026 Bear Cycle continues to repeat the 2022 price action, the next Support level should be around $70k, then $51-52k and finally around $45000.
So do you think it will unfold like 2022? Feel free to let us know in the comments section below!
---
** Please LIKE 👍, FOLLOW ✅, SHARE 🙌 and COMMENT ✍ if you enjoy this idea! Also share your ideas and charts in the comments section below! This is best way to keep it relevant, support us, keep the content here free and allow the idea to reach as many people as possible. **
---
💸💸💸💸💸💸
👇 👇 👇 👇 👇 👇

DOGE Can we really time the Cycle bottom??Dogecoin (DOGEUSD) is already deep into its new Bear Cycle and basically since the October 06 2025 flash crash that hit its 1W MA350 (red trend-line) and rebounded, has been trading within that level as Support and the 1W MA50 (blue trend-line) as Resistance.
The 1W MA350 in particular is of the utmost importance as it held as Support during both previous Bear Cycles. As a result, if it breaks now, there are high probabilities to initiate Phase 2 of the Bear Cycle. This either bottoms on the 0.786 Fibonacci retracement level of Doge's historic Fib Channel Up at around $0.0600 or extend to a full -93.00% decline (as much as the previous two corrected by) around $0.03500.
Whatever the price bottom might be, history has shown that it is much more efficient to just buy at the right time rather than at the right price. And that's because the use of the Sinewaves have helped at not only timing the Cycle Tops but also the Cycle Bottoms. And according to this, the next bottom should be around October 2026. So whatever price Doge is trading at around that time, we turn again into long-term buyers.
---
** Please LIKE 👍, FOLLOW ✅, SHARE 🙌 and COMMENT ✍ if you enjoy this idea! Also share your ideas and charts in the comments section below! This is best way to keep it relevant, support us, keep the content here free and allow the idea to reach as many people as possible. **
---
💸💸💸💸💸💸
👇 👇 👇 👇 👇 👇

BITCOIN is done if it closes below the 1M Bollinger Basis.Bitcoin (BTCUSD) is trading for the third straight month on the 1M Bollinger Bands Basis (black trend-line) and with only 5 days left to close the monthly candle, time is running out for a reversal.
That's because every time in the past 12 years that BTC closed a 1M candle below the BB Basis, it initiated Phase 2 of the Bear Cycle, and right now the price is sitting under it.
If it closes this way, Phase 2 should take it to at least the 1W MA200 (orange trend-line), which has always been hit historically during a Bear Cycle and is in fact where the January 2015 and December 2018 bottoms got priced. Based on the last Bear Cycle though, we should even test the 1W MA350 (yellow trend-line), which is where the November 2022 bottom was formed.
If that happens, the Bear Cycle should bottom around $50000, which falls exactly in the middle of the 0.382 - 0.5 Fibonacci retracement zone, again consistent with all previous Cycle bottoms. Notice that only when BTC reclaimed and closed above the 1W MA200 again (March 2023) was the new Bull Cycle confirmed.
So what do you think? Will a 1M candle closing below the Bollinger Basis be that bad for Bitcoin? Feel free to let us know in the comments section below!
---
** Please LIKE 👍, FOLLOW ✅, SHARE 🙌 and COMMENT ✍ if you enjoy this idea! Also share your ideas and charts in the comments section below! This is best way to keep it relevant, support us, keep the content here free and allow the idea to reach as many people as possible. **
---
💸💸💸💸💸💸
👇 👇 👇 👇 👇 👇

XRPUSD It can't even make a 1D MA200 test??XRP (XRPUSD) has been on a Bear Cycle since its July 18 2025 All Time High (ATH). Technically its whole Bear Cycle so far has been a Channel Down, which along with the majority of high caps, has been testing for the past 30 days the 1W MA100 (red trend-line) as Support.
Having already started its new Bearish Leg following the January 06 Lower High, it appears that the price is unable to even test the 1D MA200 (orange trend-line) for a technical rejection and continuation of the Bear Cycle. As long as it fails to do so, the current Bearish Leg eyes the 1W MA100 and if broken, may complete a -40.24% decline (similar to both previous Bearish Legs) at 1.4500.
---
** Please LIKE 👍, FOLLOW ✅, SHARE 🙌 and COMMENT ✍ if you enjoy this idea! Also share your ideas and charts in the comments section below! This is best way to keep it relevant, support us, keep the content here free and allow the idea to reach as many people as possible. **
---
💸💸💸💸💸💸
👇 👇 👇 👇 👇 👇

BITCOIN / GOLD ratio's mind-blowing revelation.Bitcoin (BTCUSD) remains under heavy pressure since its October 2025 All Time High (ATH) but the BTC/GOLD ratio reveals that the real selling pressure in terms of the precious yellow metal has been boiling up for some time before that date.
In fact the ratio's last High was in August 2025, which technically was a Lower High as the true Top for BTC/GOLD's Cycle was in December 2024. Mind-blowing revelation indeed and that undoubtedly draws similarities with the previous Cycle, which also had a Double Top in 2021.
The key indicator here is the 1M RSI of the ratio. It has a Lower Lows trend-line, which has priced all Cycle bottoms since 2015. More recently (since January 2019) there is a diverging Lower Lows trend-line (dashed) also. The tight zone within those two trend-lines may be holding the key for this Cycle's bottom.
This shows that the bottom may be closer than we may expect but the last Bear Cycle showed a slowing down behavior once it approached the RSI Lower Lows and turned sideways before it finally made contact with it 6 months later. For the real BTC/GOLD price action though, the downtrend didn't slow down as much, first breaking violently below the 1M MA50 (blue trend-line) and finding bottom 6 months later as mentioned just above the 1M MA100 (green trend-line).
If we have a decreasing rate on the MA bottoms, we can expect the current Cycle to bottom below the 1M MA100 this time, closer to the 1M MA150 (red trend-line).
So closer than it looks or not in terms of bottom, the Bear Cycle is entering its 2nd and final Phase.
So what do you think about the BTC/GOLD approach? Feel free to let us know in the comments section below!
---
** Please LIKE 👍, FOLLOW ✅, SHARE 🙌 and COMMENT ✍ if you enjoy this idea! Also share your ideas and charts in the comments section below! This is best way to keep it relevant, support us, keep the content here free and allow the idea to reach as many people as possible. **
---
💸💸💸💸💸💸
👇 👇 👇 👇 👇 👇

ETHEREUM Massive H&S forming before total collapse.Ethereum (ETHUSD) has been currently forming the Right Shoulder of a Head and Shoulders (H&S) pattern. A technically bearish formation, this Right Shoulder is contained below the 1D MA200 (orange trend-line), which may be the final test point before rejection and initiation of the 2nd Stage of the Bear Cycle.
In any case, a break below the Higher Lows trend-line, which is the pattern's Support, kick-starts the next selling phase regardless. H&S patterns typically target the 2.0 Fibonacci extension from the Shoulder's Low, which interestingly enough sits exactly on the 1385 Support of the April 09 2025 Low! Natural expectation as we will be getting closer to the end of the year, is $1400 at least.
---
** Please LIKE 👍, FOLLOW ✅, SHARE 🙌 and COMMENT ✍ if you enjoy this idea! Also share your ideas and charts in the comments section below! This is best way to keep it relevant, support us, keep the content here free and allow the idea to reach as many people as possible. **
---
💸💸💸💸💸💸
👇 👇 👇 👇 👇 👇

BITCOIN The ultimate RSI Fibonacci cheat-sheet you MUST know.Bitcoin (BTCUSD) continues to consolidate within its 1W MA50 (blue trend-line) and 1W MA100 (green trend-line), a zone whose importance we've covered on various previous analyses. This time we re-introduce a old concept, which was always an integral part of our long-term Cycle analyses, the 1W RSI Channel.
As you can see, the 1W RSI has bounced on its 0.786 Fibonacci level, a trend-line where it always hits and rebounds historically (blue circles) before completing Stage 1 of the Bear Cycle. In the previous two Bear Cycles, this has coincided with the 1W MA50-100 consolidation. After that, the RSI rebounded and tested the 0.618 Fib (orange circles), which again in the last two Cycles coincided with a 1W MA50 test, and got rejected (initiating Stage 2) towards the bottom of the Channel for the eventual Cycle bottom (green circles).
As a result, it is likely to see one last rally for that 1W MA50/ 0.618 Fib rejection (unless the 1W MA100 breaks/ closes first) before the eventual Cycle bottom on Fib 1.0 (Channel bottom). That is expected to be on the 1W MA350 (red trend-line) at least ($50000), which is where the previous Cycle bottomed in November 2022.
So do you think that's a useful RSI cheat-sheet? Feel free to let us know in the comments section below!
---
** Please LIKE 👍, FOLLOW ✅, SHARE 🙌 and COMMENT ✍ if you enjoy this idea! Also share your ideas and charts in the comments section below! This is best way to keep it relevant, support us, keep the content here free and allow the idea to reach as many people as possible. **
---
💸💸💸💸💸💸
👇 👇 👇 👇 👇 👇

BITCOIN 1W Ichimoku just turned red. Massive Bear Cycle signal.Bitcoin (BTCUSD) has turned its 1W Ichimoku Cloud red following an impressive run of more than 2 straight years of green. Historically, every time this development took place, the market was already on a Bear Cycle.
Technically this is the latest signal to confirm the 2026 Bear Cycle and the last times it took place, BTC bottomed at -68% (on all cases) from the following High rejection on the 1D MA200 (black trend-line). Based on the current position of the 1D MA200 a -68% decline would have the market test $35k.
Since however BTC bottomed on its 1W MA350 (red trend-line) during its last Bear Cycle, we should be expecting to hit it again. Based on its current trajectory, that should take place on $55000 at least. And given the fact that since 2018, every Bear Cycle bottom is a +150 MA lower on 1W (2018 bottom on 1W MA200, 2022 bottom on 1W MA350), we can assume that the 1W MA500 (grey trend-line) could get hit. That creates a potential fair bottom zone within $55000 - $40000, for use of optimistic - pessimistic scenarios.
So do you think the 1W Ichimoku Cloud turning red has confirmed the Bear Cycle? Feel free to let us know in the comments section below!
---
** Please LIKE 👍, FOLLOW ✅, SHARE 🙌 and COMMENT ✍ if you enjoy this idea! Also share your ideas and charts in the comments section below! This is best way to keep it relevant, support us, keep the content here free and allow the idea to reach as many people as possible. **
---
💸💸💸💸💸💸
👇 👇 👇 👇 👇 👇

Bitcoin(BTC/USD) Daily Chart Analysis For Week of Jan 16, 2026Technical Analysis and Outlook:
This week’s trading activity has concentrated on completing the Interim Inner Coin Rally, successfully reaching a target price of 98,000. Following this completion, the market experienced an immediate pivot.
The principal downside target is identified at Mean Support, positioned at 94,200, which has been partially attained. Given the prevailing dynamics in the Bitcoin market, traders need to monitor price movements diligently.
A prominent drawdown sentiment is currently exerting downward pressure, and should the initial support level be breached, a further decline to the Mean Support level of 90,500 will be the primary target.
On the upside, there is a conceivable intermediate rebound scenario from the previously mentioned support levels, with the primary objective being a retest of the completed Interim Inner Coin Rally at 98,000.

BITCOIN Ultimate Rainbow Cycle AnalysisBitcoin (BTCUSD) is headed towards a 1D MA200 rejection, which as mentioned is what historically kickstarts Phase 2 of the Bear Cycle.
This excellent indicator that illustrates not only the Halving events but also the most optimal Sell and Buy levels based on the Fibonacci Time extension levels shows that the next point of interest is the 4.618 Fibonacci Time extension on the final week of September 2026, where the Cycle is expected to bottom.
With the next Halving estimated in April 2028, we will still be far from the start of the Profit Taking Zone (green vertical layers), which historically starts taking place around 38 weeks (266 days) after the Halving, but the 4.618 Time Fib its technically ideal for long-term buying again. Based on this model the price should be at least at $60000 by that time.
We also see that the price didn't even reach the orange Rainbow Wave on this Bull Cycle, confirming the Law of Diminishing Returns. But the timing of the Fibonacci Time extensions, as we first did more than 7 years ago, worked again to perfection. And this is why on this market (and as a matter of fact on most of them), it is more important to plan buying and selling based on time rather than absolute prices.
So are you expecting this Bear Cycle to have ended by October 2026 and will it reach at least $60000? Feel free to let us know in the comments section below!
---
** Please LIKE 👍, FOLLOW ✅, SHARE 🙌 and COMMENT ✍ if you enjoy this idea! Also share your ideas and charts in the comments section below! This is best way to keep it relevant, support us, keep the content here free and allow the idea to reach as many people as possible. **
---
💸💸💸💸💸💸
👇 👇 👇 👇 👇 👇

BITCOIN Fear & Greed index goes ‘greed’ first time since OctoberBitcoin (BTCUSD) Crypto Fear & Greed index turned to greed for the first time in 3 months. Technically this was confirmed by BTC breaking (and closing) above its 94650 Resistance for the first time in 2 months.
With the 1D MA50 (blue trend-line) turning into a Support and getting confirmed by holding upon the January 08 test, we can see the emergence of a short-term Channel Up.
As we've explained for over a month now, this is potentially the typical market reaction that previous Bear Cycles have done historically, where after completing the first strong decline that gets most of investors off guard, it makes the first counter-trend rally (dead cat bounce) that technically tests the 1D MA200 (orange trend-line). This time, the rebound is being made after the 1W MA100 (red trend-line) got tested and held.
With the 1D RSI about to enter the Overbought Zone (70.00 and above), where the last two times (October 06 and July 14 2025) it got rejected, we may see the current Bullish Leg of the Channel Up extending to around +17.50% (where the previous one was rejected), make a Higher High, then pull-back to re-test the 1D MA50 and then finally go for the benchmark test of the 1D MA200.
We estimate a potential Bear Cycle rejection Zone within $102000 - 105000, before the Cycle starts Phase 2 with a new long-term sell-off.
Do you think that's a realistic scenario to repeat the historic pattern? Feel free to let us know in the comments section below!
---
** Please LIKE 👍, FOLLOW ✅, SHARE 🙌 and COMMENT ✍ if you enjoy this idea! Also share your ideas and charts in the comments section below! This is best way to keep it relevant, support us, keep the content here free and allow the idea to reach as many people as possible. **
---
💸💸💸💸💸💸
👇 👇 👇 👇 👇 👇

XMRUSD Bear Cycle starting. $215 possible Target.Last time we looked at Monero (XMRUSD) was exactly 3 months ago (October 14 2025, see chart below) giving a buy signal at the bottom of its long-term Channel Up, which quickly hit our Target:
This time we are turning bearish long-term as the price is not only approaching the top of its 2-year Channel Up (green) but also the Top Fib of its 8-year Channel Up. At the same time the 1M RSI is vastly overbought at 85.00, typical of the Cycle Top of the previous two Cycles.
With the last one bottoming on the 0.618 Fibonacci retracement level, just above the 1M MA100 (red trend-line), we estimate that the emerging Bear Cycle will hit at least $215 before bottoming.
---
** Please LIKE 👍, FOLLOW ✅, SHARE 🙌 and COMMENT ✍ if you enjoy this idea! Also share your ideas and charts in the comments section below! This is best way to keep it relevant, support us, keep the content here free and allow the idea to reach as many people as possible. **
---
💸💸💸💸💸💸
👇 👇 👇 👇 👇 👇

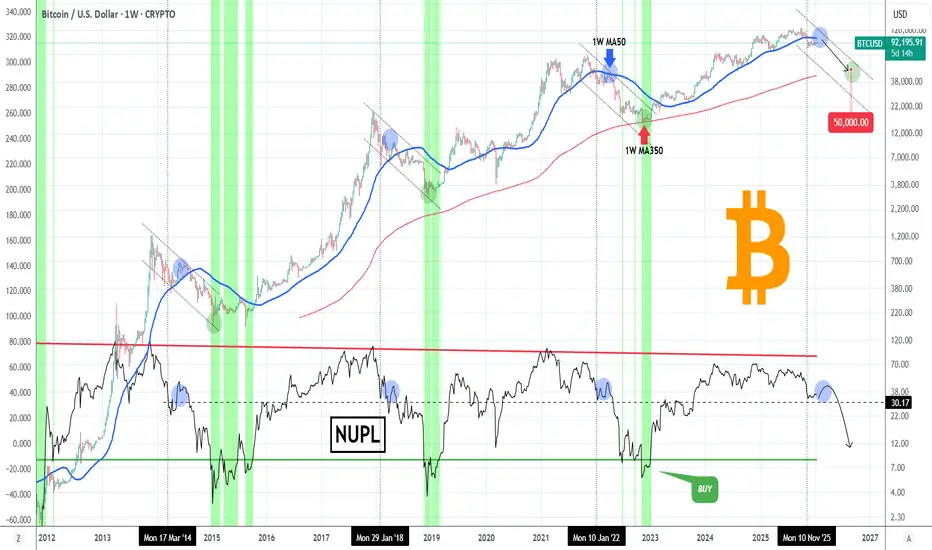
BITCOIN This is one of the best indicators for buying the bottomBitcoin (BTCUSD) continues to consolidate during these (almost) past 2 months as it is headed towards a 1W MA50 (blue trend-line) test, where it was rejected on the last Bear Cycle and started its Stage 2. This Stage is what typically leads to the Cycle bottom, which is essentially the most optimal level for a long-term investor to enter/ buy.
One of the best indicators to call out a Cycle bottom is the Net Unrealized Profit Loss (NUPL). As you can see (black trend-line), when this has historically hit its green line, BTC was on excellent buy opportunity levels (green vertical zones) as the Bear Cycle bottom was priced immediately after.
The last Cycle bottom also happened to be exactly on the 1W MA350 (red trend-line), which the March 2020 COVID flash crash also approached. As a result, it would be no surprise to see BTC hit that level on the next Cycle bottom as well, which according to its current trajectory, this test could be around $50000. But as mentioned, the strongest buy indication would be the NUPL touching its green trend-line regardless of BTC's price at the moment.
So what do you think? Will the NUPL be a indicator that you will look out for? Feel free to let us know in the comments section below!
---
** Please LIKE 👍, FOLLOW ✅, SHARE 🙌 and COMMENT ✍ if you enjoy this idea! Also share your ideas and charts in the comments section below! This is best way to keep it relevant, support us, keep the content here free and allow the idea to reach as many people as possible. **
---
💸💸💸💸💸💸
👇 👇 👇 👇 👇 👇