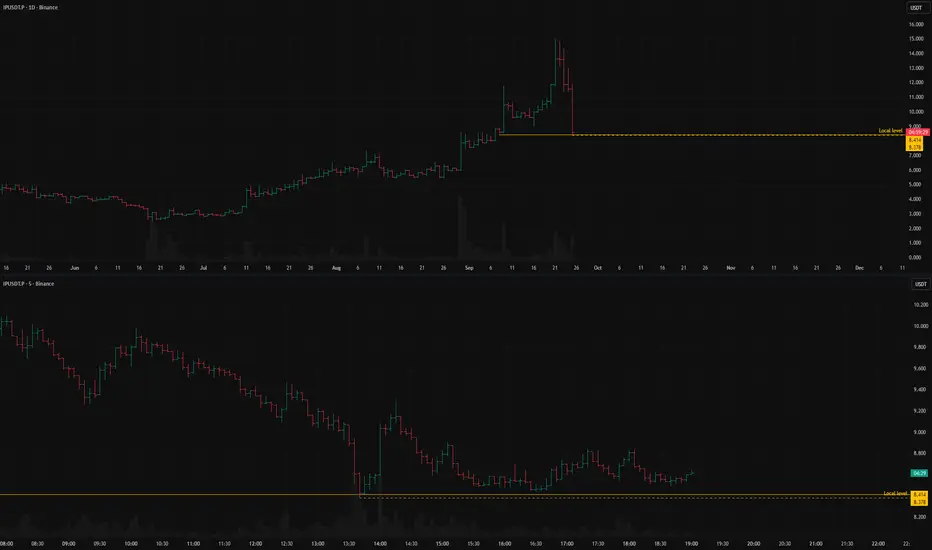
IPUSDT: short setup from daily support at 8.378A very sharp decline in the BINANCE:IPUSDT.P was stopped at the 8.414 level.
Usually, the natural reaction to such a drop is a correction, but we are not observing one here.
It is precisely this lack of a correction that is drawing my attention.
On the downside (for a short scenario), there is a consolidation zone that formed from Aug 30th to Sept 7th, which is a heavy area that could be difficult to break through.
Additionally, the asset has already covered a significant distance today, and there might simply not be enough energy left for a breakout.
Therefore, I will be watching very closely how exactly the price approaches this level.
Key factors for this scenario
Correlation with the market
Volatility contraction on approach
Momentum stall at the level
No reaction after a false break
Was this analysis helpful? Leave your thoughts in the comments and follow to see more.
Cryptocurrency
IMX/USDT THE BREAK IS NOT FAR 26/09/2025 update📊IMX/USDT Update
On the low time frame, IMX is rebounding from the 0.705 – 0.709 support zone and is now testing the main trend zone at 0.728.
Key levels:
0.728 → main trend resistance. A breakout and hold above this level would shift momentum bullish.
0.782 → breakout target zone. If 0.728 is cleared with volume, price could accelerate toward 0.78+ quickly.
0.705 → key support. As long as price holds above, structure stays intact.
Upside scenario:
If IMX breaks 0.728 with confirmation (strong candle + volume), expect bullish momentum into 0.782.
📌 Summary
Above 0.728 → breakout possibility target 0.782 - 0.88
And in whale+ breakout could enter up $1
Hold above 0.705 → trend support remains strong.
Risk zones
correction risk toward 0.63
Cycle hold target up $0,47

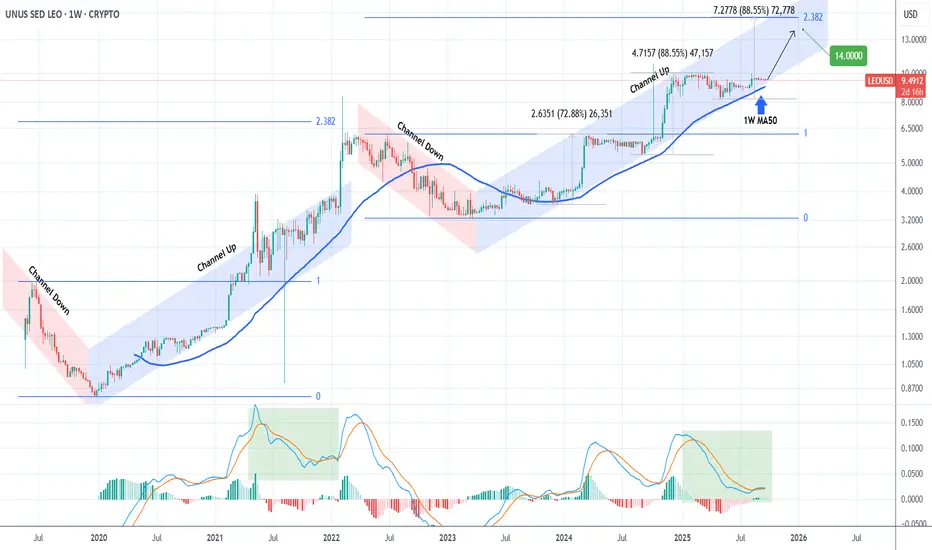
LEOUSD Ready for an explosive rally.Unus Sed Leo (LEOUSD) has been trading within a Channel Up for the entirety of its current Bull Cycle. Lately it has been trading sideways since the August 11 High, but still strongly supported by the 1W MA50 (blue trend-line).
This level has been the Cycle's major Support since September 2023 (2 years) after which it never closed a 1W candle below it. As long as it holds, we expect at least another +72.88% rise from the recent Low, similar to both previous Bullish Legs of the Channel Up, which gives a 14.000 long-term Target.
That is just below the 2.382 Fibonacci extension from the previous Cycle High, which is the level that Leo token reached during the previous Cycle. As you can see, it also consisted of a Channel Down (Bear Phase) and Channel Up (Bull Phase), but exploded in its final weeks more aggressively.
-------------------------------------------------------------------------------
** Please LIKE 👍, FOLLOW ✅, SHARE 🙌 and COMMENT ✍ if you enjoy this idea! Also share your ideas and charts in the comments section below! This is best way to keep it relevant, support us, keep the content here free and allow the idea to reach as many people as possible. **
-------------------------------------------------------------------------------
💸💸💸💸💸💸
👇 👇 👇 👇 👇 👇
BTC 1H: Selling pressure remains dominant.1. Trend Context
The short-term structure remains bearish, with the price trading below the EMA.
After breaking through the 111,200 – 112,000 zone, the market is forming a small correction.
2. Key Levels
Nearest Resistance: 110,700 – 111,800. Important zone to watch during this correction.
Main Support (Demand Zone): 108,000 – 108,500. Next target if the downtrend continues.
3. Scenario
Key Scenario : Currently, an uptrend line has been formed, indicating a slight recovery after the previous sharp decline. Wait for the EMA to move closer to the price and form a momentum accumulation zone, after which a first breakout through the uptrend line will appear.
Alternative scenario : If BTC sustains recovery to 110,700, sell-off at this level could be considered.
Please like and comment to support our traders. Your feedback motivates us to produce more analysis in the future 🙏✨

BTC 110K Low time frame can be the return for Bitcoin📊 Market update low time frame
If there is good news, then BTC should confirm in 4H max.
If btc is able to gain 110K on the low time frame, there is a good chance we can go with BTC to a new uptrend, which could also mean good news for most of the altcoins.
All eyes are on the 10K in the coming time frame for a confirmation.
BTC can make a downtrend move to get volume with a spike to a low time frame, as we know from BTC.
IF BTC moves lower, the low time frame can change to 109800
110K can be the reason for 113K, and a confirmed main trend means a positive BTC
We will follow it step by step.

Bitcoin: What's Next?My Philosophy & Approach
My foundation is the pure chart. I don't consider news or outside opinions, as I see them as secondary. All primary information is already in the price. Of course, no one can give a 100% forecast. The crypto market can fall sharply just as it can rise sharply. This uncertainty must be accepted as the norm. This is why I work from risk, not from expectations.
General Market Sentiment & BINANCE:BTCUSDT.P Analysis
In my opinion, a bearish sentiment prevails in the market. After its drop, Bitcoin isn't having a deep correction but is re-testing the level where the decline stopped, which is a sign of seller pressure. Currently, the price is grinding the 111,959.5 level, but I don't see a strong reaction from buyers even on false breakouts. This indicates their weakness. Although the trading zone of Sept 3-10 creates an obstacle, I am still leaning towards a further decline.
Asset Selection Criteria in Current Conditions
After high volatility comes a dangerous time, so I am especially careful in selecting assets based on two criteria:
Strength Against the Market: Assets that are rising despite the general fall. This indicates the presence of a large buyer.
A Clear Stop: Assets that, after a sharp decline, stopped precisely at a level where large capital absorbed all sales.

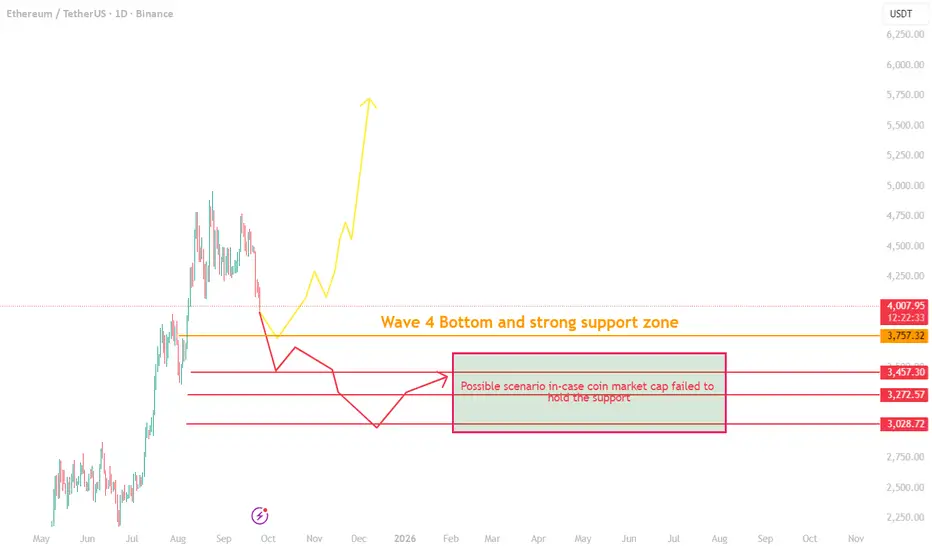
ETH Crash or Bounce? The Critical Level Everyone Is WatchingEthereum (ETH/USDT) – Critical Support Test Ahead
Ethereum is currently under pressure after breaking below the $4,000 support. The next significant level to watch is the $3,760 zone, which is not only a strong technical support but also aligns with the Elliott Wave 4 bottom as well as a key Fibonacci retracement area.
Key Scenarios
1. Bullish Recovery (Primary Expectation)
If ETH holds above the $3,760 support, we can expect consolidation in the range of $4,000 – $4,350.
This zone is likely to act as a base for Ethereum until broader market conditions stabilize.
Once momentum returns, ETH has the potential to resume its upward trend.
2. Bearish Breakdown
If ETH fails to defend $3,760, then deeper downside levels may come into play:
$3,450
$3,270
$3,000
This would represent a sharp and aggressive downturn. While possible, this remains weak scenario, given how violent the move would be.
Why the Answer Lies Outside ETH’s Chart
The real driver here isn’t just Ethereum—it’s the total "crypto market cap excluding BTC" as I have warned 2 days ago that's it's falling into a correction
The altcoin market cap is currently in correction as capital flows back into Bitcoin dominance, which has already broken its downtrend line and reached today 59%.
If the altcoin market cap holds its critical support and BTC dominance starts dropping, we can expect a broader bullish recovery across altcoins, with Ethereum following.
If that support breaks, then the weaker bearish scenario may unfold.
Conclusion
For now, the $3,760 support remains the critical line in the sand. Holding it keeps Ethereum within a bullish recovery path. Breaking it could open the door to deeper corrections.
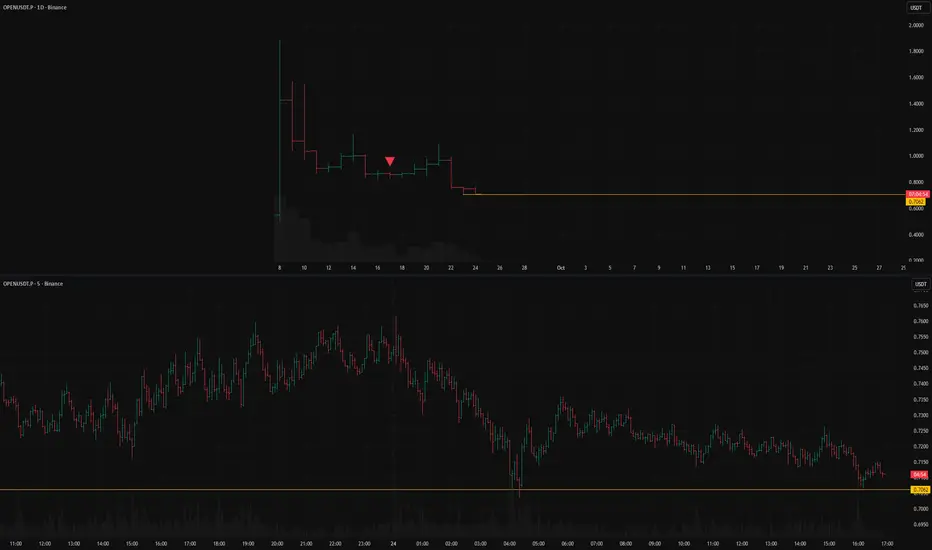
OPENUSDT: short setup from daily support at 0.7062BINANCE:OPENUSDT.P is holding above the 0.7062 level.
However, the more frequently this level is tested and the weaker the bounces from it become, the higher the probability of a short scenario.
An additional sign of weakness is that the asset is not reacting to Bitcoin's rally.
Key factors for this scenario
Global & local trend alignment
Price void / low liquidity zone beyond level
Asset decoupled from the market
Volatility contraction on approach
Immediate retest
Repeated precise tests of the level
Consolidation with price compression
BTCUSD on the 30m timeframe1. Trend Context
BTCUSD on the 30m timeframe remains in a clear downtrend, forming consistent Lower Highs and Lower Lows.
2. Key Zones
SZ (Supply Zone): 114,250 – 114,750. Origin of the strong selloff, major resistance if price retraces upward.
SR (Structure Reversal): 113,000 – 113,250. Previously marked a short-term structural shift, now likely to act as dynamic resistance.
DZ (Demand Zone): 111,200 – 111,750. Price is currently testing this zone, which serves as short-term support.
3. Trading Scenarios
If DZ holds, a short-term bounce toward SR is possible.
If price rejects at SR, it offers a favorable short setup in line with the prevailing downtrend.
If DZ breaks, the downtrend may extend with a target around 110,000 or lower.
Please like and comment below to support our traders. Your reactions will motivate us to do more analysis in the future 🙏✨

HYPERLIQUID This is its last chance to rebound.Hyperliquid (HYPEUSD) has been trading within a 4-month Channel Up and today made contact with its 1W MA20 for the first time since May 06. With the 1D MA100 (green trend-line) broken also yesterday, this is the token's last chance to find Support as it sits at the bottom of the pattern.
If it holds and doesn't close a 1W candle below the 1W MA20, this would technically be the new Higher Low that initiated the next Bullish Leg. All previous sequences reached at least the 1.236 Fibonacci extension, which is at 64.500.
If the candle fails on the 1W MA20 however, we expect more aggressive selling towards Support 1 where contact can be possibly made with the 1D MA200 (orange trend-line). In that case, our Target will be 36.000.
It is also worth mentioning that the 1D RSI is just above its 6-month Support Zone, enhancing the probabilities for a rebound.
-------------------------------------------------------------------------------
** Please LIKE 👍, FOLLOW ✅, SHARE 🙌 and COMMENT ✍ if you enjoy this idea! Also share your ideas and charts in the comments section below! This is best way to keep it relevant, support us, keep the content here free and allow the idea to reach as many people as possible. **
-------------------------------------------------------------------------------
💸💸💸💸💸💸
👇 👇 👇 👇 👇 👇

BTC H&S COULD FAIL. THINK ABOUT STOP "SELL" $110.3K ORDERMorning folks,
We're keep watching over big reverse H&S pattern here. Last time we warned about USD liquidity issues, this is actually why BTC collapsed down to 111K support.
And idea was to not buy just at the level, but watch for confirmation in a way of some bullish patterns. Now I do not see any. Widening triangle makes me think that downside action could have even more chances than reversal.
That's why, we think about using of Stop "Sell" entry order around 110.3-110.5K area for position taking if downside breakout will happen. This is comfortable, because if still upside action starts - this order remains unfilled.
As we do not see yet any signs of reversal, we do not consider long entry. Let's see, maybe something will change on Monday. But today I keep "bearish" mark for this idea.

BTC/USDT Outlook – Volatility Rises After Sharp DeclineBTC/USDT Market Report
Bitcoin recently faced heavy selling pressure, pushing the market into a sharp decline. This drop reflects a shift in sentiment where earlier stability has been replaced by increased volatility and downside momentum.
Price action shows signs of exhaustion after the fall, suggesting the possibility of a short-term rebound attempt. However, broader behavior still reflects uncertainty, with buyers needing stronger participation to shift momentum back in their favor.
If downward pressure continues, deeper corrections could emerge before any meaningful recovery. In the near term, traders should expect sharp swings as the market tries to stabilize.

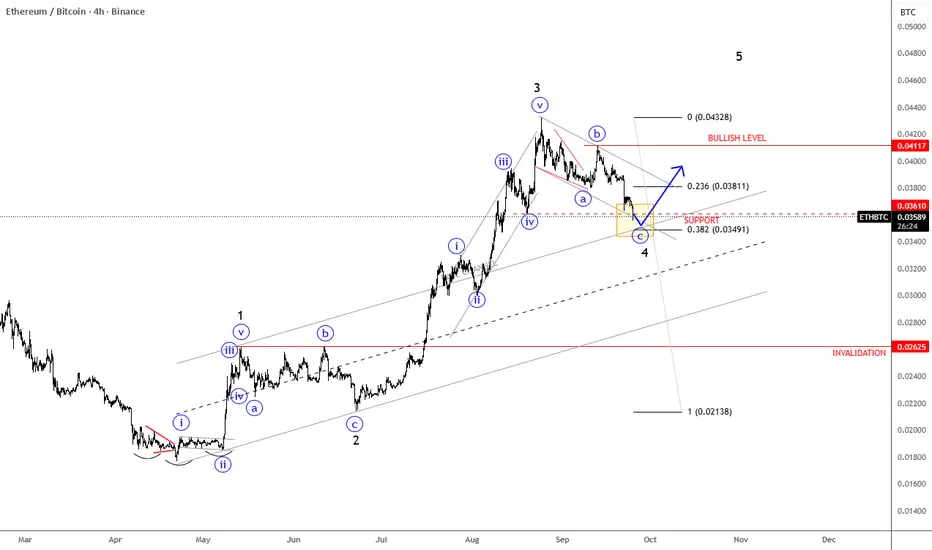
ETHBTC Has A TextBook Bullish PatternETHBTC Has A TextBook Bullish Pattern, as we see an ongoing five-wave bullish impulse by Elliott Wave model
ETHBTC pair is slowed down after a massive extension higher into wave 3, and it's right now testing important 0.035 - 0.034 support zone within an abc correction for wave 4. It's also trading at an important 38,2% Fibonacci retracement and base channel upper line, which can act as a strong support. So soon watch out for a bullish continuation within wave 5, especially if we see a rebound and recovery back above channel resistance line near 0.038 level. Bullish confirmation is above 0.041 level, while the invalidation level is at 0.026.
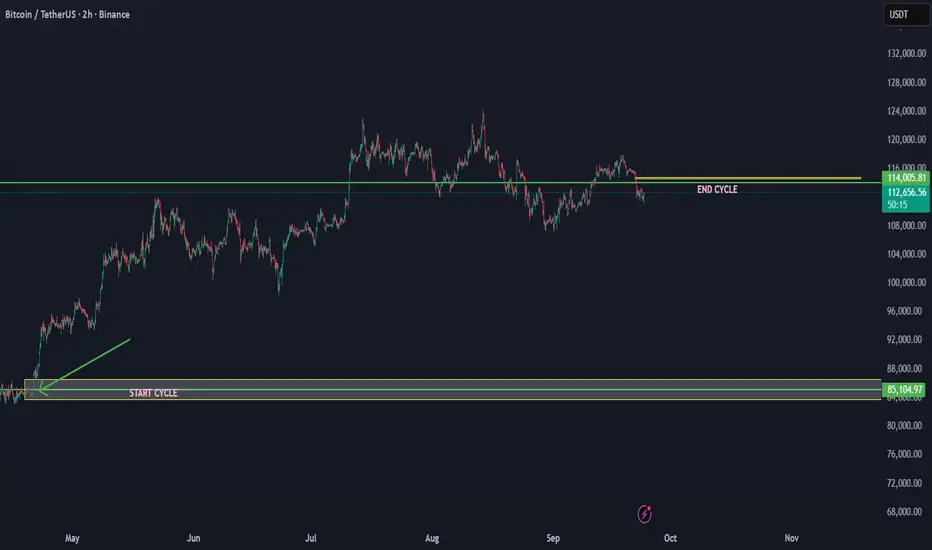
AFTER END OF CYCLE BTC CAN RETURN BELOW 110K - 90K📊 BTC/USDT Market Update
Current Price: ~$113,509
Cycle Recap: From the $84,000 low to the $114,000 high, BTC has completed what looks like an end of cycle phase (as marked on chart).
We did explain here the end of the cycle
There is a high chance in the coming time that BTC will break down below 110K and enter the correction zone.

XRP deadcat bounce?Today Bulls had their fun on XRP. The fall was only the beginning. This was a test of supply. In my opinion I believe demand for next month is $1.30 in that range. We shall see. We are still in a Wyckoff distribution pattern and haven't broke any eyes if we break higher than my green box we remain bullish.

BITCOIN Can this pattern hold one last time?Bitcoin (BTCUSD) is holding (so far) its 1W MA20 (red trend-line) as mentioned on our previous analysis, which is critical for the continuation of the bullish trend.
Today however, we bring you a pattern that may have gone unnoticed and as long as it holds, the market should be expecting a new High.
That is the transition of a former Resistance level (formed from a previous High) that turns into Support (new Low), which generates a rally that so far has measured a minimum +45.73% (from the High).
However every such Low was priced at or very close to the 1W MA50 (blue trend-line). This time the 1W MA50 is at 100k and a way for this pattern to be fulfilled, BTC should at least trade sideways until it comes close to the 1W MA50.
In any case, as long as the Support level holds, a +45.73% rise, would take us to $157000.
Do you think we have chances for that? Feel free to let us know in the comments section below!
-------------------------------------------------------------------------------
** Please LIKE 👍, FOLLOW ✅, SHARE 🙌 and COMMENT ✍ if you enjoy this idea! Also share your ideas and charts in the comments section below! This is best way to keep it relevant, support us, keep the content here free and allow the idea to reach as many people as possible. **
-------------------------------------------------------------------------------
💸💸💸💸💸💸
👇 👇 👇 👇 👇 👇

The BTC cycle that started at 84K is projected end at 114K This is a cycle update for BTC/USDT. Based on the cycle data, the cycle that started at 84K has ended at 114K. This indicates that we are now entering a new major trend breakdown in the cycle. It can take time, but when there is a new uptrend cycle, we will add.
This time frame and action made the end of the cycle that started from 84K
This could mean that btc can enter below 110K in the coming time. We have seen more times in the history of BTC that by the cycle end, the trend breaks down in steps.
AVAXUSD Channel Up $28 pull-back or break-out to $47??Avalanche (AVAXUSD) has been trading within a 3-month Channel Up and last Friday hit its top (Higher Highs trend-line).
It is no surprise that the price got rejected and turned sideways there as it also completed a +75% rise from the last Higher Low, which is exactly what the previous Bullish Leg did. That structure eventually pulled back to its 1D MA50 (blue trend-line) and the 0.5 Fibonacci retracement level before pricing the Higher Low.
As a result, we expect a decline towards the 1D MA50, targeting $28.00, as long as the Channel Up doesn't break upwards.
If it does however, we expect an aggressive rally towards the 0.9 Fibonacci level from the previous Top, targeting $47.00.
-------------------------------------------------------------------------------
** Please LIKE 👍, FOLLOW ✅, SHARE 🙌 and COMMENT ✍ if you enjoy this idea! Also share your ideas and charts in the comments section below! This is best way to keep it relevant, support us, keep the content here free and allow the idea to reach as many people as possible. **
-------------------------------------------------------------------------------
💸💸💸💸💸💸
👇 👇 👇 👇 👇 👇

BTCUSD: Downtrend remains dominant after EMA rejection(1h chart)Yesterday, the price followed the bearish scenario as it was rejected at the EMA and resistance zone.
Trend: The short-term downtrend remains intact, with the EMA sloping downward.
Nearest support: 111,800 – 112,000. A break below could extend the move toward 110,000 – 109,000.
Nearest resistance: 113,500 – 113,800. A breakout here would invalidate the bearish outlook
.
📌 Outlook for today : Bearish continuation is the primary scenario. Wait for a candle close below support for confirmation. Alternatively, if price breaks strongly above the EMA Ribbon, a short-term corrective rally may develop.
Please like and comment below to support our traders. Your reactions will motivate us to do more analysis in the future 🙏✨

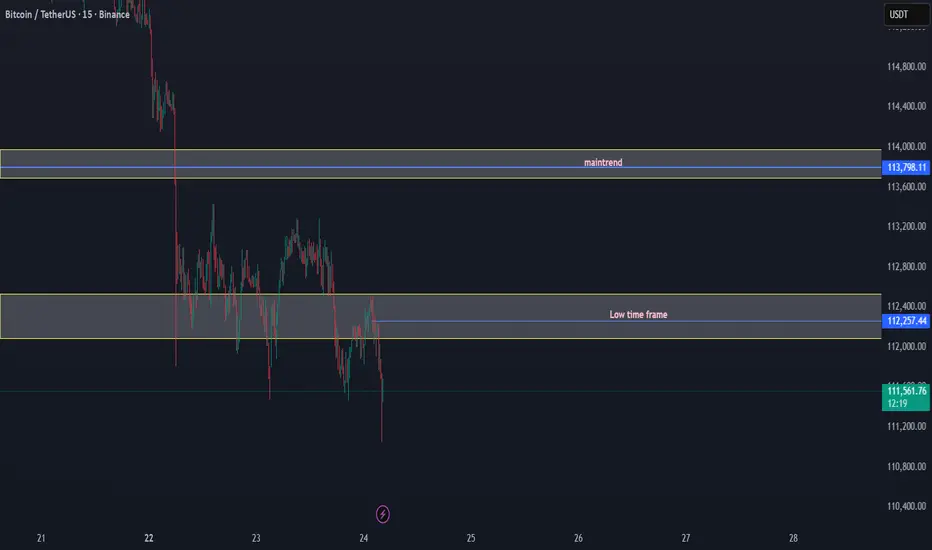
BTC/USDT Breakdown: Loss of Key Levels Confirms Bearish Structur📉 BTC/USDT Market Update
Bitcoin has broken down key structural levels, confirming a bearish outlook in the short to mid-term.
✅ Low Time Frame Support Lost: The $112,083 – $112,531 demand zone has failed to hold, indicating that buyers are losing control on lower time frames.
✅ Main Trend Zone Rejected: The $113,798 – $114,000 supply area acted as strong resistance, and BTC was unable to reclaim this key trend level.
✅ Momentum: Current price action shows continuation to the downside, with sellers stepping in aggressively after repeated failed attempts to sustain higher levels.
Bias: Bearish
As long as BTC trades below $113,800, the market structure favors sellers. Further downside pressure may target the $111,000 – $110,800 range in the near term.
⚠️ Key Levels to Watch:
Resistance: $113,800 – $114,000 (Main trend rejection zone)
Support: $111,000 – $110,800 (Next liquidity pool)
THE UNEXPECTED BREAK OF PROM TO $15Prom is one of the coins that did show before a signal of fall, but unexpectedly, a whale trend did save it, with now the possibility that it can break to $15 in the coming time.

Signal #1 BUY AAVE 15mFree Signal #1
TF: 15m
in #AAVE
BUY SIGNAL
Entry: 276.94
SL: 267.60
TP1: 289.32 (75%)
TP2: 300.18
TP3, TP4 soon in comments after touch TP2
Risk: 1-5% of your Balance
S.Reza Mehrjuyan / CEO FNS
Analyst, Manager

BITCOIN The hidden pivot of the Bollinger Bands (140k or 100k?).Bitcoin (BTCUSD) is testing again the basis (black trend-line) of the 1W Bollinger Bands (BB), just 3 weeks after it held and initiated a rebound.
On this chart you can see that since July 2023, every time BTC closed a 1W candle below the BB basis level, the price pulled-back to its 1W MA50 (blue trend-line) and then rebounded. That is its ultimate long-term Support so far.
As a result, all eyes should be on this week's closing. Below the BB basis, we should most likely seek the 1W MA50 a little above the $100000 mark. Ideally, it should coincide with a 1W RSI Support Zone test (holding since September 2023).
If the BB basis holds though, we should extend the BB top within the $130-140k Zone.
What do you think will come first? Feel free to let us know in the comments section below!
-------------------------------------------------------------------------------
** Please LIKE 👍, FOLLOW ✅, SHARE 🙌 and COMMENT ✍ if you enjoy this idea! Also share your ideas and charts in the comments section below! This is best way to keep it relevant, support us, keep the content here free and allow the idea to reach as many people as possible. **
-------------------------------------------------------------------------------
💸💸💸💸💸💸
👇 👇 👇 👇 👇 👇
