NCN (Neurochain AI) Main Trend 18 07 2025Logarithm. 3 days. Crypto project (imitation of utility) was made in autumn 2024 for local AI hype. Twitter 102 thousand subscribers. This is not enough... Reduction from the maximum pumping by -99%. It is rational to work according to the pump/dump strategy, in spot.
If a local alt season is launched, then I would recommend locally - medium urgently working with the % range (maximum) specified in the idea itself. This crypto imitation of usefulness is unlikely to survive until the big AI hype....
Currently, there are trades on 2 exchanges:
1) Gate
2) MEXC
For this group of assets as a whole. Collect assets where AI is at least somehow actually used (there are none of those), or are simply mentioned for hype (imitation of usefulness). Some assets will "die", most, if you hold them, will show a greater profit than assets of other groups.
Cryptocurrrency

OFFICIAL TRUMP Main trend. 16 05 2025Logarithm. Time frame 3 days. After a super pump and a drive of "stupid money", a descending channel was formed on a natural dump. The price came out of it. Now a triangle is forming. The price is clamped. The reversal zones and percentages to the key support/resistance levels are shown extremely accurately according to TA.
If there is no aggressive exit in the medium term, then there will be consolidation and, as a consequence, the formation of a horizontal channel "sholtai / chattai", its key zones are shown.
Now, this "cryptocurrency" is now on 16 05 2025 in 41st place by capitalization.
Reductions from the price highs are about -90%.
From the liquid zone about -84%.
These are not the minimum values of the decline of such hype cryptocurrencies. Just take this into account in your money management. For clarity, the level zones and the % of potential decline if the trend breaks again are shown on the chart (pull the chart down).
Even with such a decline, the price is now at a huge profit. I am not speaking for the creators of the cryptocurrency, but for the first speculators and "investors" who may not have sold everything on the hype.
For the creators of the cryptocurrency, perhaps these are manipulators close to the Trump family, for them, any sale is super profit. But in order to sell, you need to maintain liquidity, and from time to time make interest in speculation and asset retention by investors, that is, do pumps and hype. Use this, and do not be greedy...
Levels and zones, pump/dump, which the price will "feel" are shown in advance. Click "play" on the chart and move the chart up. With a high degree of probability, the hype and pumping of the price of this cryptocurrency will be repeated, given the hype and the long term of the political figure whose name this cryptocurrency bears. Now it is a Trump dump, in the future it will become a Trump pump for some time.
Do not forget to sell on the next hype. If you understand that you are very greedy, and the news background affects you, then sell in parts, or use stop losses to protect profits.
There is no need to guess the minimums and maximums. It is important to know these zones, and have an acceptable average price, from the position of the trend, and its potential. It is regulated by the distributed entry volume (in advance) at potential reversal zones.

Bearish reversal off Fibonacci confluence?The Bitcoin (BTC/USD) is rising towards the pivot and could reverse to the 1st support which is a pullback support.
Pivot: 121,983.11
1st Support: 112,086.50
1st Resistance: 128,114.70
Risk Warning:
Trading Forex and CFDs carries a high level of risk to your capital and you should only trade with money you can afford to lose. Trading Forex and CFDs may not be suitable for all investors, so please ensure that you fully understand the risks involved and seek independent advice if necessary.
Disclaimer:
The above opinions given constitute general market commentary, and do not constitute the opinion or advice of IC Markets or any form of personal or investment advice.
Any opinions, news, research, analyses, prices, other information, or links to third-party sites contained on this website are provided on an "as-is" basis, are intended only to be informative, is not an advice nor a recommendation, nor research, or a record of our trading prices, or an offer of, or solicitation for a transaction in any financial instrument and thus should not be treated as such. The information provided does not involve any specific investment objectives, financial situation and needs of any specific person who may receive it. Please be aware, that past performance is not a reliable indicator of future performance and/or results. Past Performance or Forward-looking scenarios based upon the reasonable beliefs of the third-party provider are not a guarantee of future performance. Actual results may differ materially from those anticipated in forward-looking or past performance statements. IC Markets makes no representation or warranty and assumes no liability as to the accuracy or completeness of the information provided, nor any loss arising from any investment based on a recommendation, forecast or any information supplied by any third-party.

FIL Secondary trend. Channel zone. 31 03 2025Logarithm. Time frame 3 days (less is not needed).
Main trend. Time frame 1 week.
Published more than 2 years ago 22 01 2023
FIL/USD Main trend. From the maximum of $237 -99%
In the specified range, a horizontal channel with a large % step (exactly 370%) was formed earlier (2.590 - 7.157/10.7). There have already been 3 pumping waves in this channel. From the pumping highs in the main trend, the price fell by -98.98%
Secondary trend . This horizontal channel with a step of 370% and work with trend reversal formations.
Local trend , zone of formation of a descending wedge, zone of capitulation and trend reversal.
FIL/USDT Local trend. Wedge. Price clamping . 30 06 2024
Working now with the forming descending wedge and trend reversal in case of its breakthrough.

Just HODL it!I won't give an additional explanation, because the chart is self-explanatory. it is just the beginning. There is a long way to go. HODL it my friends ...

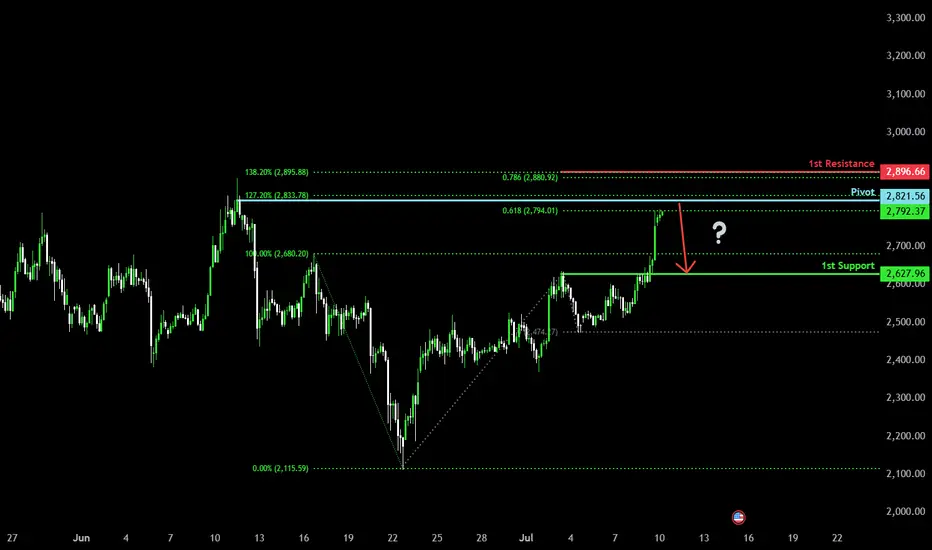
Heading into pullback resistance?Ethereum (ETH/USD) is rising towards the pivot, which has been identified as a pullback resistance and could reverse to the 1st support which acts as a pullback support.
Pivot: 2,821.56
1st Support: 2,627.96
1st Resistance: 2,896.66
Risk Warning:
Trading Forex and CFDs carries a high level of risk to your capital and you should only trade with money you can afford to lose. Trading Forex and CFDs may not be suitable for all investors, so please ensure that you fully understand the risks involved and seek independent advice if necessary.
Disclaimer:
The above opinions given constitute general market commentary, and do not constitute the opinion or advice of IC Markets or any form of personal or investment advice.
Any opinions, news, research, analyses, prices, other information, or links to third-party sites contained on this website are provided on an "as-is" basis, are intended only to be informative, is not an advice nor a recommendation, nor research, or a record of our trading prices, or an offer of, or solicitation for a transaction in any financial instrument and thus should not be treated as such. The information provided does not involve any specific investment objectives, financial situation and needs of any specific person who may receive it. Please be aware, that past performance is not a reliable indicator of future performance and/or results. Past Performance or Forward-looking scenarios based upon the reasonable beliefs of the third-party provider are not a guarantee of future performance. Actual results may differ materially from those anticipated in forward-looking or past performance statements. IC Markets makes no representation or warranty and assumes no liability as to the accuracy or completeness of the information provided, nor any loss arising from any investment based on a recommendation, forecast or any information supplied by any third-party.
JUP Main trend. Channel. Wedge. Double bottom. 06 07 2025Logarithm. Time frame 3 days. Decline from the maximum -84% (this is not enough), but given the capitalization of 59th place, if the market is positive in the near future, then it is quite possible to reverse this cryptocurrency through a double bottom.
All long-term consolidation above with high volatility is the distribution of ladies and gentlemen. Also study the vesting of this cryptocurrency. There are less than half of the tokens on the market, and there are also pauses for 1 year, which is good.
Jupiter (JUP) is a key player in the decentralized finance (DeFi) space, especially in the Solana blockchain.
Main trend is downward. Descending channel.
Secondary trend is downward. Descending wedge.
Local trend is sideways. Potential double bottom in case of a breakout.
The price will move in the corridors of this descending channel from the dynamic lines of its support/resistance. Remember this and use it in your trading strategy, observing money management.
Local breakout zone
Understand where the zones are cheap, and where, on the contrary, the zones are expensive. If you work (tear out movements, there should be short-term or conditionally medium-term transactions, with very mundane goals) conditionally in expensive zones, then limit losses. Do not let yourself be fooled by news noise and the opinions of the majority.

MEW Main Trend. Memcoin. 2025 07 02Logarithm. Time frame 3 days.
Cat in a dogs world (MEW)
X -133 thousand subscribers (this is not enough).
Reduction from the maximum -87%. For such assets, this is not enough.
I imposed a descending channel on the chart (current descending trend of the main trend), and a horizontal one, if by some miracle this local Ross hook is broken upwards (not forming a local head and shoulders), not only to the resistance of the secondary trend (red line), but to break through it. Percentages to key zones of support/resistance levels are shown for clarity.
After the downward trend is broken, such "psychological-fundamental" assets are usually pumped up by +800-1000% from the minimums or more. Low liquidity, and the contingent of people who subscribe to these projects, allows this to be done easily at the right time: "the hamster is not scared". After pumping — a slow death, with pumps an order of magnitude smaller. Therefore, do not forget to sell in the alt season.
When working with such cryptocurrencies by liquidity, observe money management, use partial entry or on a breakout. Do not use margin leverage, as there may be snot in any direction for a large percentage, which will lead to liquidation "out of the blue".

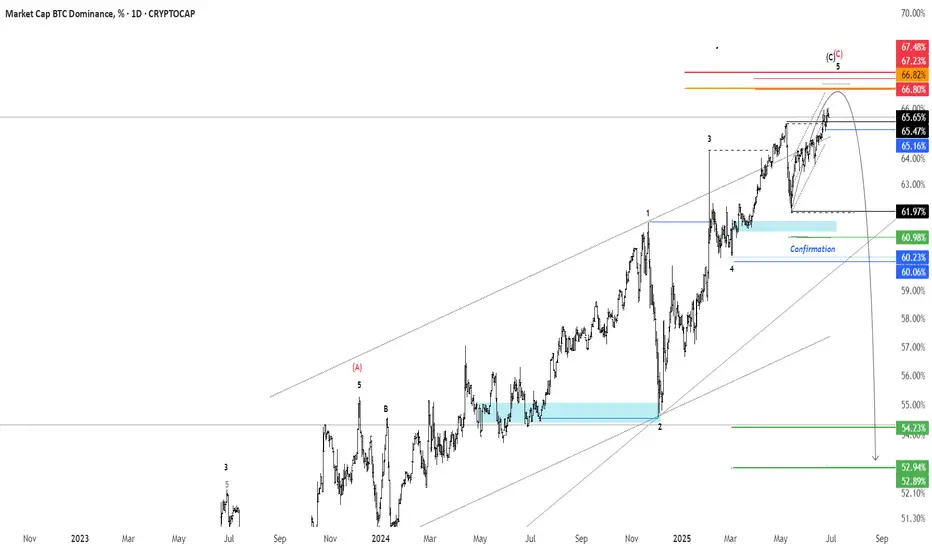
BTC.D - 1D Timeframereversal zone 66.8 : 67.2%
Confirmation : 60.23%
Targets : 52.94% / 31.03
invalid : 67.48%
XRP M30 Chart Analysis "XRP Short.
Target: 123.01B. Stop: 127.09B.
Let's see if this plays out. 👀
#XRP #CryptoTrading"

Bullish bounce?The Bitcoin (BTC/USD) is falling towards the pivot and could bounce to the 1st resistance.
Pivot: 101,082.81
1st Support: 94,030.59
1st Resistance: 110,969.18
Risk Warning:
Trading Forex and CFDs carries a high level of risk to your capital and you should only trade with money you can afford to lose. Trading Forex and CFDs may not be suitable for all investors, so please ensure that you fully understand the risks involved and seek independent advice if necessary.
Disclaimer:
The above opinions given constitute general market commentary, and do not constitute the opinion or advice of IC Markets or any form of personal or investment advice.
Any opinions, news, research, analyses, prices, other information, or links to third-party sites contained on this website are provided on an "as-is" basis, are intended only to be informative, is not an advice nor a recommendation, nor research, or a record of our trading prices, or an offer of, or solicitation for a transaction in any financial instrument and thus should not be treated as such. The information provided does not involve any specific investment objectives, financial situation and needs of any specific person who may receive it. Please be aware, that past performance is not a reliable indicator of future performance and/or results. Past Performance or Forward-looking scenarios based upon the reasonable beliefs of the third-party provider are not a guarantee of future performance. Actual results may differ materially from those anticipated in forward-looking or past performance statements. IC Markets makes no representation or warranty and assumes no liability as to the accuracy or completeness of the information provided, nor any loss arising from any investment based on a recommendation, forecast or any information supplied by any third-party.

LUNC/USDT is in Reversal LUNC/USDT is showing good trend line reversal with the divergence on the 4hr time frame looks good for buy at current price or it can be go for some small retracement on 1hr time frame

Bullish bounce?Bitcoin (BTC/USD) has bounced off the pivot and oculd rise to the 1st resistance.
Pivot: 108,446.67
1st Support: 106,491.59
1st Resistance: 111,566.95
Risk Warning:
Trading Forex and CFDs carries a high level of risk to your capital and you should only trade with money you can afford to lose. Trading Forex and CFDs may not be suitable for all investors, so please ensure that you fully understand the risks involved and seek independent advice if necessary.
Disclaimer:
The above opinions given constitute general market commentary, and do not constitute the opinion or advice of IC Markets or any form of personal or investment advice.
Any opinions, news, research, analyses, prices, other information, or links to third-party sites contained on this website are provided on an "as-is" basis, are intended only to be informative, is not an advice nor a recommendation, nor research, or a record of our trading prices, or an offer of, or solicitation for a transaction in any financial instrument and thus should not be treated as such. The information provided does not involve any specific investment objectives, financial situation and needs of any specific person who may receive it. Please be aware, that past performance is not a reliable indicator of future performance and/or results. Past Performance or Forward-looking scenarios based upon the reasonable beliefs of the third-party provider are not a guarantee of future performance. Actual results may differ materially from those anticipated in forward-looking or past performance statements. IC Markets makes no representation or warranty and assumes no liability as to the accuracy or completeness of the information provided, nor any loss arising from any investment based on a recommendation, forecast or any information supplied by any third-party.

NOT / USD. Local trend. Reversal zones 08 06 2025Local work ("market noise") is not a breakout of the inverted head and shoulders resistance zone (yellow reversal level). A rollback back to the horizontal channel formation zone with a 100% step. Everything is as before, nothing new can happen, for clarity, I showed the % to the key local support/resistance levels.
NOT Main trend. Channel. 16 03 2025

DOG Main Trend. Reversal Zones 05/29/2025Logarithm. Time frame 3 days. The chart shows key reversal zones in the horizontal channel, and when exiting it. For clarity, percentages are shown from the skin reversal zone. This is convenient for understanding the risk and potential profit in long and short work. You can also work in spot from long, from key zones (more relevant, as margin trading on assets of such liquidity, is extremely destructive, due to price slippage under the market, but already on such assets by a huge percentage, for your liquidation (accumulation of liquidity-benefit of gambling addicts in general).
Now the price has hit the resistance of the internal channel, that is, the zone of the “main liquid” price movement. From the reversal, local profit is significant, therefore, when working, observe risk management and wait for a breakthrough of this resistance level (you can place a trigger order), or wait for a rollback (if there is one), for example, to the median of the channel.
The horizontal channel itself is reformatted into a potential “microphone” (what was half a year ago on bitcoin, with resistance to the 72 thousand zone, and liquidity collection 53-58).

XRP vs XVG 8 Year Triangle Fractal Comparison 05 2025Logarithm. Time frame 1 month. Linear chart for clarity. Two cryptocurrencies of the super hype of altcoins in 2017 (the final alt season of the cycle before last). XRP is ahead of XVG. The structures are similar, but if XVG breaks through the triangle upwards like on XRP, then work with the first target, observing risk management. You can leave 5-10% of the position for the second target, but this is not necessary. As for XRP, everything is as before... local update in the XRP idea.
XVG Secondary trend (part) Resolution of the triangle 8 years 05 2025
XRP/USD Main trend 28 07 2022

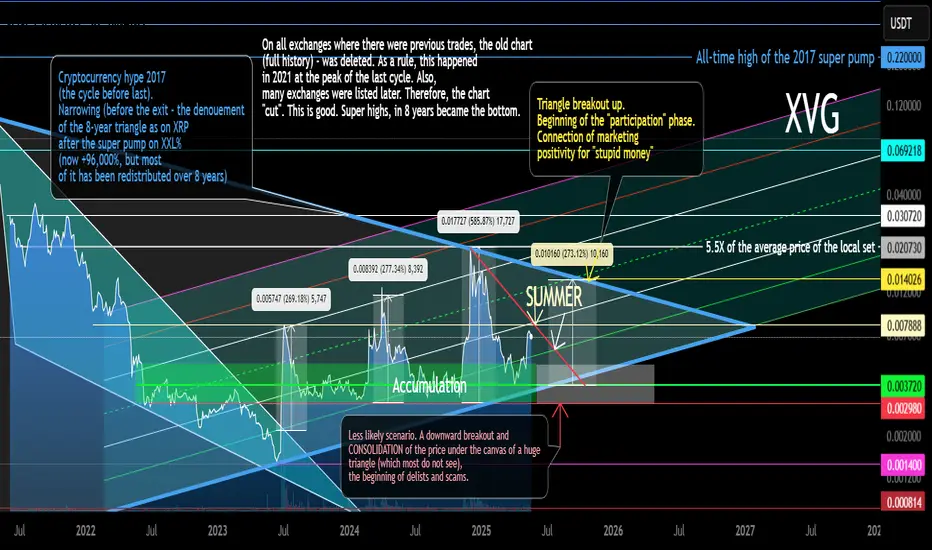
XVG Secondary Trend (Part) Triangle Resolution 8 years 05 2025Logarithm. Time frame 3 days. Linear instead of candlestick specifically for clarity. This is the longest chart history on tradingview that could be found. It does not display everything as is. Where this cryptocurrency was previously traded, the exchanges deleted the entire trading history. Listing on new exchanges does not display the whole picture. I described and showed everything on the chart. More in the channel, screenshots and comparison with XRP, here the site does not provide an opportunity to make such a comparison, as there are simply no charts of such history.
Verge (XVG) like XRP identical chart of the main trend, and the same 8-year triangle after the pumping of 2017. The only difference is that XRP came out of its triangle half a year ago, in alt season #2 of this cycle, and this cryptocurrency is still in the canvas of its triangle. But the price is gradually being driven into a corner. In alt season #3, most likely, the denouement of this story lasting 8 years will occur. More up than down (at the beginning).
Verge (XVG), like XRP, is an asset of the super pump of 2017 and the price retention is -96-98% from the super pump by hundreds of thousands of percent (I am not mistaken exactly so), which forms a huge triangle on XXX (8 years). This is all inherent in the assets of the hype of 2017: XVG XRP NEM XLM ZEC XMR DASH LTC and so on ... Some of them, over the past 2 years, have become on the path of hype (XRP XLM), and some on the path of scam (I do not want to make anti-advertisement).
Most likely, everything will repeat on XVG, as on XRP, but only at the right time, in the final alt season of this cycle. "XVG captains" do not have as much money and a powerful state behind them as XRP, to go against the market and the general trend, therefore, they need the market hype to distribute "a little higher". And so with most of these altcoins. Do not forget to get rid of them on the pump. Remember, the more down-to-earth goals, the more likely you are to earn over the long term. Observe risk and money management.
Remember, there is a big alt season ahead, provided that you are an adequate person and your goals are appropriate.
Falling towards 50% Fibonacci support?Ethereum (ETH/USD) is falling towards the pivot and could bounce to the 1st resistance.
Pivot: 2,102.09
1st Support: 1,669.20
1st Resistance: 2,806.23
Risk Warning:
Trading Forex and CFDs carries a high level of risk to your capital and you should only trade with money you can afford to lose. Trading Forex and CFDs may not be suitable for all investors, so please ensure that you fully understand the risks involved and seek independent advice if necessary.
Disclaimer:
The above opinions given constitute general market commentary, and do not constitute the opinion or advice of IC Markets or any form of personal or investment advice.
Any opinions, news, research, analyses, prices, other information, or links to third-party sites contained on this website are provided on an "as-is" basis, are intended only to be informative, is not an advice nor a recommendation, nor research, or a record of our trading prices, or an offer of, or solicitation for a transaction in any financial instrument and thus should not be treated as such. The information provided does not involve any specific investment objectives, financial situation and needs of any specific person who may receive it. Please be aware, that past performance is not a reliable indicator of future performance and/or results. Past Performance or Forward-looking scenarios based upon the reasonable beliefs of the third-party provider are not a guarantee of future performance. Actual results may differ materially from those anticipated in forward-looking or past performance statements. IC Markets makes no representation or warranty and assumes no liability as to the accuracy or completeness of the information provided, nor any loss arising from any investment based on a recommendation, forecast or any information supplied by any third-party.

Heading into pullback resistance?Bitcoin (BTC/USD) is rising towards the pivot which has been identified as a pullback resistance and could reverse to the 1st support which. is also a pullback support.
Pivot: 108,391.05
1st Support: 98,383.98
1st Resistance: 119,108.79
Risk Warning:
Trading Forex and CFDs carries a high level of risk to your capital and you should only trade with money you can afford to lose. Trading Forex and CFDs may not be suitable for all investors, so please ensure that you fully understand the risks involved and seek independent advice if necessary.
Disclaimer:
The above opinions given constitute general market commentary, and do not constitute the opinion or advice of IC Markets or any form of personal or investment advice.
Any opinions, news, research, analyses, prices, other information, or links to third-party sites contained on this website are provided on an "as-is" basis, are intended only to be informative, is not an advice nor a recommendation, nor research, or a record of our trading prices, or an offer of, or solicitation for a transaction in any financial instrument and thus should not be treated as such. The information provided does not involve any specific investment objectives, financial situation and needs of any specific person who may receive it. Please be aware, that past performance is not a reliable indicator of future performance and/or results. Past Performance or Forward-looking scenarios based upon the reasonable beliefs of the third-party provider are not a guarantee of future performance. Actual results may differ materially from those anticipated in forward-looking or past performance statements. IC Markets makes no representation or warranty and assumes no liability as to the accuracy or completeness of the information provided, nor any loss arising from any investment based on a recommendation, forecast or any information supplied by any third-party.

ZRO (LayerZero) Fresh coin. 19 05 2025Logarithm. Time frame 3 days. The creators of the cryptocurrency "threw" a huge number of their flock, and distributed an airdrop of "pennies", thereby reducing the price burden on themselves in the bearish trend of altcoins. Therefore, this cryptocurrency, unlike others, has a stronger chart, and the decline was only -80%. This is quite small, considering that the capitalization is in 170th place at the moment.
I specifically superimposed 2 channels on top of each other, ascending and descending. There were a lot of lines, but these dynamic support / resistance will be felt by the price in the future.
🟣 Now a triangle is being formed locally , it rested against the downward local trend, from its breakthrough / non-breakthrough, and depends on which global channel the market will be pulled on an average urgent basis. Sorry, the price of this cryptocurrency.
🟢 Local targets of the triangle , which can become an ascending pennant are shown on the chart.
🔴 Also, a descending target is shown, if the trend is not broken and the triangle works down.
Fundamental (not a legend). LayerZero supports any blockchain that can run smart contracts, such as Ethereum, BNB Chain, Avalanche, Polygon, Arbitrum, Optimism, Fantom and other chains. LayerZero also supports non-EVM chains, such as Aptos. These so-called omnichain applications should become a key layer of the multi-chain future, where different blockchains interact simultaneously.
It is worth noting that the fundamental does not really matter, and cryptocurrencies move (rationality of creators and market maker + real supply/demand) in accordance with the market as a whole, with very rare exceptions, which, as a rule, have a manipulative nature and a very short time.
Also, it is worth noting that when the altseason begins, this cryptocurrency can be greatly pumped up, given the emission of cryptocurrencies in one hand, and the real demand in the future for this protocol for different blockchains.

IRON Main trend. Channel. 18 05 2025Logarithm. Time frame 1 week. Down from the listing price -98%. Dying asset. Suitable for pump/dump strategy work, without reference to the ticker name in the spot, with down-to-earth goals, but understanding the high volatility of these assets due to low liquidity (“dying assets”). Work without stops (they are destructive for such assets with such volatility), from the average price of the set/dump. It is advisable to work on a breakthrough of key zones (understanding the liquidity of the asset, and the amount of the entry amount).
Asset as an example, crypto wrappers of such liquidity and work on them now. There are thousands of similar ones on the crypto market. Therefore, there is no point in considering them separately. One similar one, projection - if not thousands of dying scams (created under the hype of the distribution of the last cycle), then hundreds.
🟢A “Dragon” pattern may form if the downward secondary trend is broken. More precisely, it will be broken if a short alt season starts now for alts. The target is in the previous consolidation zone, and to cross the dynamic resistance of the inner zone of the descending channel (zone of decreasing highs). It is rational to work for a breakthrough, understanding the liquidity of the dying asset.
🔴If the market is negative, then the rollback from this descending line will continue to the dynamic support of the channel in the designated zone. If below, then it is a scam and delists from other exchanges where it is traded.

BTC Primary trend. Secondary - expanding triangle.Logarithm. Time frame 1 week. Linear for clarity. Now the price is in consolidation in the key resistance zone of the "psychology 100" zone. Everything is as before, nothing new.
The price moves from dynamic zones of support and resistance of the large channel, and with the observance of the proportions of decreasing % from the previous maximums and minimums, adhering to a conditional 4-year cyclicality. Which is also initially embedded in the Bitcoin halvings, and the understanding of increasing demand, with a decrease in supply through halvings (but, here is a nuance with ETF, that is, conditionally with "fake bitcoins", which significantly increases the supply).
With a huge degree of probability, in the next cycle (possibly the final one), Bitcoin will be driven above or around $ 1 million, depending on the maximum that will be set in this cycle. Perhaps it will be much higher (parabolic growth as at the end of 2017) than the average distribution price. Mass digitalization is underway... and there are more and more dollars, they need to be somehow utilized in the future.
I specifically refreshed the old ideas of the main trend (2 and 3 years ago published) of this scale, and made it on a linear chart, for greater visualization of the trend direction and patterns that are formed on a smaller scale.
BTC/USD Secondary trend cycles and halvings. 1 07 2022
BTC/USD Halving 518 When will the minimum and maximum price be cycles. 27 09 2023

Stellar (XLM/USDT) – Daily Chart Technical Analysis
The chart illustrates a potential bullish setup forming on the daily timeframe of the Stellar/USDT perpetual contract on Binance.
After a prolonged downtrend, the price action has formed a clear double bottom pattern (W-shape), signaling a potential reversal. The neckline of the pattern has been broken and successfully retested, confirming the validity of the formation. Following this retest, XLM has continued to respect the ascending trendline, indicating sustained bullish momentum.
Currently, the price is consolidating just above the trendline, providing a potential long entry opportunity. The designated support area around $0.29725 acts as the key invalidation level. Should the price break and close below the $0.25211 zone, the bullish structure would likely be compromised, potentially leading to a trend reversal.
The target for this setup lies within the resistance zone between $0.38 and $0.40, an area that historically acted as strong supply. This zone is marked as both resistance and a take-profit area. Given the significance of this level, a partial profit-taking strategy is advised once price approaches this zone.
Volume analysis shows moderate participation during the recent leg up, which could suggest the need for higher volume confirmation on any breakout attempts.
The RSI indicator remains in neutral-bullish territory (around 56–58), suggesting that there is still room for upward movement before entering overbought conditions.
Conclusion:
As long as the ascending trendline holds, the structure remains bullish. A break above recent highs with increased volume could pave the way for further upside toward the $0.38–$0.40 region. However, a breakdown below the support zone would invalidate the long thesis and may warrant reassessment or potential short setups.
Risk management and dynamic stop-loss tracking are essential in this volatile range.
