THE / USDT : Testing trendline resistanceTHE/USDT Price is once again testing trendline resistance. A confirmed breakout from this level could trigger a rally towards $0.60.
Always wait for confirmation before entering and manage risk properly.
Cryptomarket

BTC DATA UPDATEBTC/USDT Update
On the low time frame, BTC is still in a breakdown structure. Price is consolidating under pressure around the 115.7K zone.
Key levels to watch:
116K → first level where momentum could shift.
116.5K → confirmation level. A strong break and hold above 116.5K would confirm a new uptrend and open the way to higher levels.
Failure to confirm above 116.5K means risk remains for further downside continuation.
Critical support: 112.8K is an important cycle level BTC must hold to stay inside the green cycle.
If 112.8K breaks, probability increases for a deeper correction toward lower zones (110K–108K).
Until BTC closes and confirms above 116.5K, bias remains cautiously bearish/sideways.
📌 Summary
Below 116K → breakdown structure remains active.
Break & confirmation above 116.5K → bullish scenario opens.
112.8K → must-hold cycle support for the green cycle.

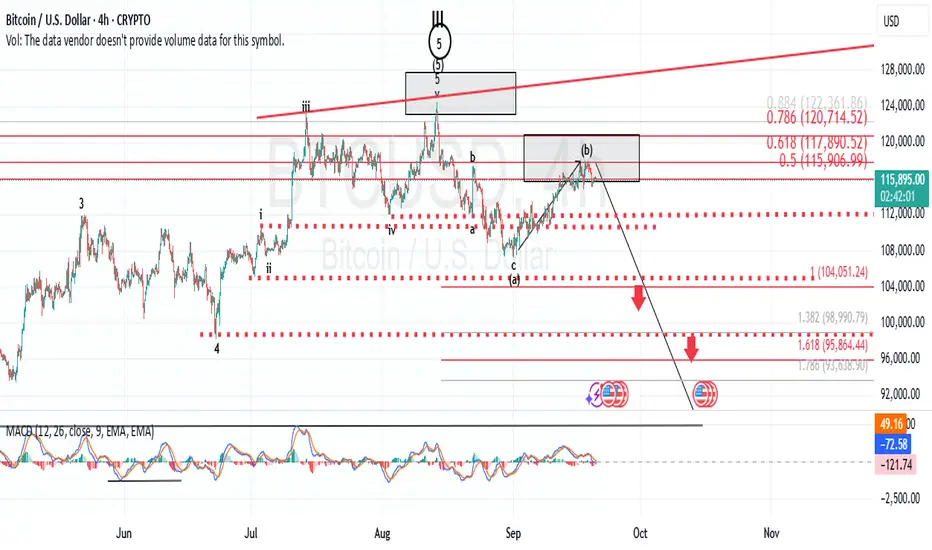
Bitcoin has appeared to have struck a meaningful topHaving retraced right into the 61.8% Fib retracement level, I am expecting BTC to exit the target box to the downside in the days to come, with a high possibility to retracing to the $84,000 level in the weeks and months to come.
PEPE; FREE SIGNAL!!!Hello friends
Given the buyers' support for the price and the downtrend breakdown, if the two specified supports are maintained, the price can move to the specified targets.
*Trade safely with us*

Designated buying and selling points...Hello friends
Well, you see that we had a downward trend and once the price reached the specified resistance, but it was not valid and the price fell further to the point where we specified the support with Fibonacci for you and from there the price was supported and the resistance was broken, causing the price to grow.
Now that the price has grown well and was able to break the specified resistance, a good opportunity has been provided for us to buy in stages and with capital and risk management.
And we move with it to the resistance areas marked with Fibonacci.
*Trade safely with us*

LINEA - Crime Pump ?Linea continues to trade inside a well-defined range, with the red zone overhead acting as a heavy supply block.
> Range Structure:
Price action remains trapped between 0.0223 – 0.0310, with no clean breakout on either side. Until we clear resistance, expect continued chop.
> Critical Resistance:
The red area (0.0310–0.0327) is the gatekeeper. A decisive breakout above this zone is the first real confirmation for a bullish trend shift and potential strong upside momentum.
> Support Levels to Watch:
0.0249
0.02239 (range bottom / last line of defense)
TL;DR
No breakout, no trend. Until Linea takes out the red supply zone, we’re stuck in a range and price will likely keep chopping sideways. Break above = bulls step in. Fail = extended range play.

TRUMP ; Should we buy Trump currency ?Hello friends
Well, as you know, you are taking a high risk to buy this currency, but as you can see, the price has been compressed for some time and there is a resistance that does not allow the price to grow, and after each time the price hits it, we have witnessed a price correction.
Now, if the resistance breaks, the price can see the specified targets.
*Trade safely with us*

PENGU (FREE SIGNAL)Hello friends
Given the price decline, it can now be said that sellers are gradually weakening and weakness is occurring in the trend. Given the failure to confirm the rise of 3 support areas, we have determined that the price can be well supported in these areas and if supported, it can move to the specified targets.
*Trade safely with us*

ES Futures: Breakout or Fakeout? Trade Plan Inside
---
🔥 **ES Futures Setup (2025-09-20)** 🔥
📊 **Market View:**
Leaning **BULLISH** (short/medium-term) ✅
– MA stacking + MACD support longs
– BUT: low volume + RSI \~70 + Stoch \~78 = risk of fake breakout ⚠️
🎯 **Trade Plan (Market Open):**
* Direction: **LONG**
* Entry: **6658.77**
* Stop: **6574.64** (-84 pts / \$4,207 risk)
* Targets:
• T1: 6742.91 (+84 pts / \$4,207)
• T2: 6784.98 (+126 pts / \$6,310)
• T3: 6826.99 (+168 pts / \$8,413)
📏 **Size:** 1 contract (risk \~4.2% on \$100k acct — scale responsibly)
💪 **Confidence:** 60%
⏰ **Timing:** Market Open
⚠️ **Risks:**
– Low volume (\~0.31x norm)
– Overbought oscillators
– Tech weakness could drag index
✅ **Rationale:**
Trend + MA stack favors longs. Use 1.5 ATR stop. Lock gains at T1/T2, let runners push to 2R.
---
🚀 **ES LONG 6658.77 → TP 6826.99 | Stop 6574.64 | 60% Confidence** 🚀

Explaining the Lower Timeframe Function and Its Role in Trading Introduction
Candlesticks on higher timeframes summarize long periods of trading activity, but they hide the internal balance of buying and selling. A daily candle, for instance, may show only a strong close, while in reality buyers and sellers may have fought much more evenly. To uncover this hidden structure, Pine Script offers the requestUpAndDownVolume() function, which retrieves up-volume, down-volume, and delta from a chosen lower timeframe (LTF).
Function in Practice
By applying this function, traders can measure how much of a move was supported by genuine buying pressure and how much came from selling pressure. The function works across timeframes: when analyzing a daily chart, one can select a one-minute or one-second LTF to see how the volume was distributed within each daily bar . This approach reveals details that are invisible on the higher timeframe alone.
Helper for Data Coverage
Lower-timeframe data comes with strict limitations. A one-second chart may only cover a few hours of history, while a one-minute chart can stretch much further back. To make this limitation transparent, a helper was implemented in our code: it shows explicitly how far the available LTF data extends . Instead of assuming full coverage, the trader knows the exact portion of the higher bar that is represented.
//══════════════
// Volume — Lower TF Up/Down
//══════════════
int global_volume_period = input.int(20, minval=1, title="Global Volume Period", tooltip="Shared lookback for ALL volume calculations (e.g., averages/sums).", group=grpVolume)
bool use_custom_tf_input = input.bool(true, "Use custom lower timeframe", tooltip="Override the automatically chosen lower timeframe for volume calculations.", group=grpVolume)
string custom_tf_input = input.timeframe("1", "Lower timeframe", tooltip="Lower timeframe used for up/down volume calculations.", group=grpVolume)
import TradingView/ta/10 as tvta
resolve_lower_tf(bool useCustom, string customTF) =>
useCustom ? customTF :
timeframe.isseconds ? "1S" :
timeframe.isintraday ? "1" :
timeframe.isdaily ? "5" : "60"
get_up_down_volume(string lowerTf) =>
= tvta.requestUpAndDownVolume(lowerTf)
var float upVolume = na
var float downVolume = na
var float deltaVolume = na
string lower_tf = resolve_lower_tf(use_custom_tf_input, custom_tf_input)
= get_up_down_volume(lower_tf)
upVolume := u_tmp
downVolume := d_tmp
deltaVolume := dl_tmp
//──── LTF coverage counter — counts chart bars with valid Up/Down (non-na) 〔Hazel-lite〕
var int ltf_total_bars = 0
var int last_valid_bar_index = na // new: remember the bar_index of the last valid LTF bar
if not na(deltaVolume)
ltf_total_bars += 1
last_valid_bar_index := bar_index
int ltf_safe_window = ltf_total_bars
var label ltf_cov_label = na // label handle for the “coverage” marker
Use in Strategy Development
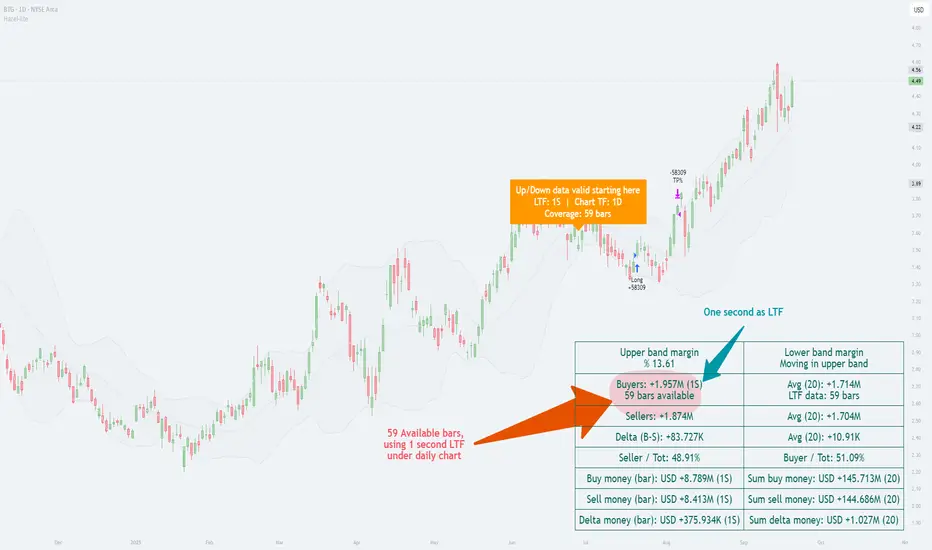
Because both the main function and the helper for data coverage have been implemented in our work, we use the Hazel-nut BB Volume strategy here as a practical example to illustrate the subject. This strategy serves only as a framework to show how lower-timeframe volume analysis affects higher-timeframe charts. In the following sections, several charts will be presented and briefly explained to demonstrate these effects in practice.
In this example, the daily chart is used as the main timeframe, while a one-second lower timeframe (LTF) has been applied to examine the internal volume distribution. The helper clearly indicates that only 59 one-second bars are available for this daily candle. This is critical, because it shows the analysis is based on a partial window of intraday data rather than a full day.
The up/down volume split reveals that buyers accounted for about 1.957 million units versus sellers with 1.874 million, producing a positive delta of roughly +83,727. In percentage terms, buyers held a slight edge (≈51%), while sellers were close behind (≈49%). This near balance demonstrates how the daily candle’s bullish appearance was built on only a modest dominance by buyers.
By presenting both the margin values (e.g., upper band margin 13.61%) and the absolute money flow, the chart connects higher-timeframe Bollinger Band context with the micro-timeframe order flow. The annotation “Up/Down data valid starting here” reinforces the importance of the helper: it alerts the user that valid LTF volume coverage begins from a specific point, preventing misinterpretation of missing data.
In short, this chart illustrates how choosing a very fine LTF (1 second) can reveal subtle buyer–seller dynamics, while at the same time highlighting the limitation of short data availability. It is a practical case of the principle described earlier—lower-timeframe insight enriches higher-timeframe context, but only within the boundary of available bars.
Analysis with One-Minute LTF
In this chart, the daily timeframe remains the base, but the lower timeframe (LTF) has been shifted to one minute. The helper indicates that data coverage extends across 353 daily bars, a much deeper historical window than in the one-second example. This means we can evaluate buyer/seller balance over nearly a full year of daily candles rather than just a short slice of history.
The up/down split shows buyers at ≈2.019M and sellers at ≈1.812M, producing a positive delta of +206,223. Here, buyers hold about 52.7%, compared to sellers at 47.3%. This stronger bias toward buyers contrasts with the previous chart, where the one-second LTF produced only a slim delta of +83,727 and ratios closer to 51%/49%.
Comparison with the One-Second LTF Chart
Data coverage: 1s gave 59 daily bars of usable history; 1m extends that to 353 bars.
Delta magnitude: 1s produced a modest delta (+83k), reflecting very fine-grained noise; 1m smooths those micro-fluctuations into a larger, clearer delta (+206k).
Interpretation: The 1s chart highlighted short-term balance, almost evenly split. The 1m chart, backed by longer history, paints a more decisive picture of buyer strength.
Key Takeaway
This comparison underscores the trade-off: the lower the LTF, the higher the detail but the shorter the history; the higher the LTF, the broader the historical coverage but at the cost of microscopic precision. The helper function bridges this gap by making the coverage explicit, ensuring traders know exactly what their analysis is built on.
Impact of TradingView Plan Levels
Another factor shaping the use of this function is the user’s access to data. TradingView accounts differ in how much intraday history they provide and which intervals are unlocked.
◉ On the free plan, the smallest available interval is one minute, with a few months of intraday history.
◉ Paid plans unlock second-based charts, but even then, history is measured in hours or days, not months.
◉ Higher tiers extend the number of bars that can be loaded per chart, which becomes relevant when pulling large volumes of lower-timeframe data into higher-timeframe studies
Conclusion
With requestUpAndDownVolume(), it becomes possible to see how each symbol behaves internally across different timeframes. The helper function makes clear where the data stops, preventing misinterpretation. By applying this setup within strategies like Hazel-nut BB Volume, one can demonstrate how changing the lower timeframe directly alters the picture seen on higher charts. In this way, the function is not just a technical option but a bridge between detail and context.
BTC/USDT | BTC Correction Done? Next Pump Loading…By analyzing the Bitcoin chart on the 4-hour timeframe, we can see that the price moved higher as expected, reaching around $118,000. After that, Bitcoin corrected down to the $115,000 demand zone. Once it touched this level, demand stepped in again and the price bounced back.
Currently, Bitcoin is trading around $116,000. If the price holds above the $114,400–$115,000 support zone, we can expect the start of another bullish wave.
Please support me with your likes and comments to motivate me to share more analysis with you and share your opinion about the possible trend of this chart with me !
Best Regards , Arman Shaban

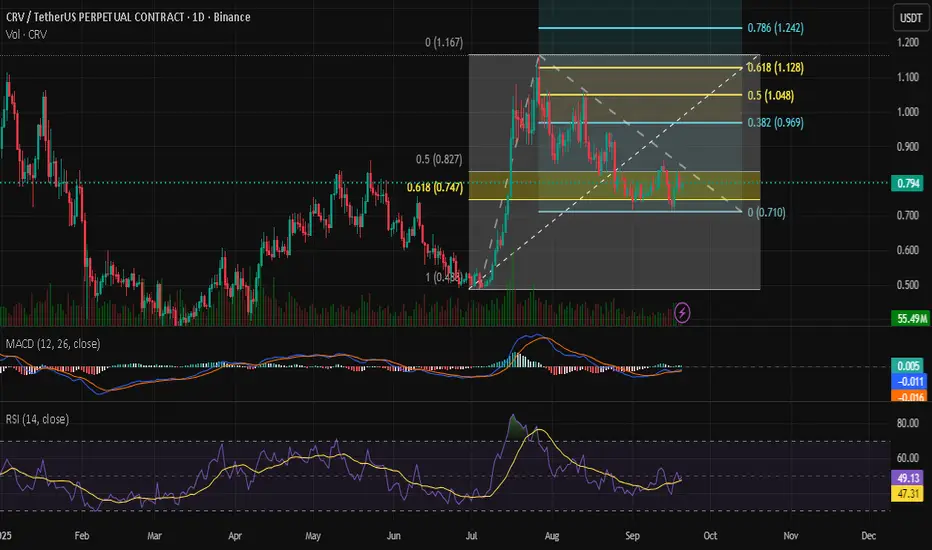
My Opinion on CRV cryptocurrenciesWith Fibonacci Extension, I found potential that the price have high possibility to go higher to price 1usdt. But this is just my opinion, this is not financial advice, PLEASE DO YOUR OWN RESEARCH
DOT / USDT : Momentum building for a strong rallyDOT/USDT is showing strong momentum and looks ready for a rally. If momentum continues to build, the next upside targets are $5 – $6.
Always manage risk and wait for confirmation before entering.

DOGEUSDT Market Report – From Correction to ExpansionDOGEUSDT has completed an impulsive upward cycle, followed by a controlled corrective structure. The earlier surge reflected aggressive positioning from buyers, while the subsequent retracement highlights the market’s need to neutralize inefficiencies and rebalance liquidity.
Price action now reflects a shift from short-term exhaustion into consolidation, where both sides of the market are being tested. The recent structural breaks and measured pullbacks are evidence of liquidity engineering — a common precursor to directional continuation.
The broader market context indicates that this phase is not a reversal but part of a higher-timeframe accumulation process. With order flow stabilizing and volatility compressing, DOGEUSDT is preparing for its next expansionary leg. If momentum sustains, the setup favors a bullish continuation cycle in the coming sessions.

Ethereum Elliott Wave Buy Setup: Targets 4550 and 4600Ethereum Daily Update (Elliott Wave Setup)
Based on my daily monitoring of Ethereum and according to the Elliott Wave count (which I’ll share shortly with the full analysis), I see a long opportunity forming.
Here’s my personal trade plan:
✅ Entry 1: Buy from current price 4450 / 4445
✅ Entry 2: If price dips, add another buy at 4400
🎯 Target 1: 4550
🎯 Target 2: 4600
Stop-loss: For both entries, a daily close below 4350
Please note:
This is not financial advice – I’m only sharing my personal trades.
Always do your own research before taking action.
👍 Don’t forget to like if you found this useful, and feel free to follow me for more analysis of this kind.
Best of luck 🌹

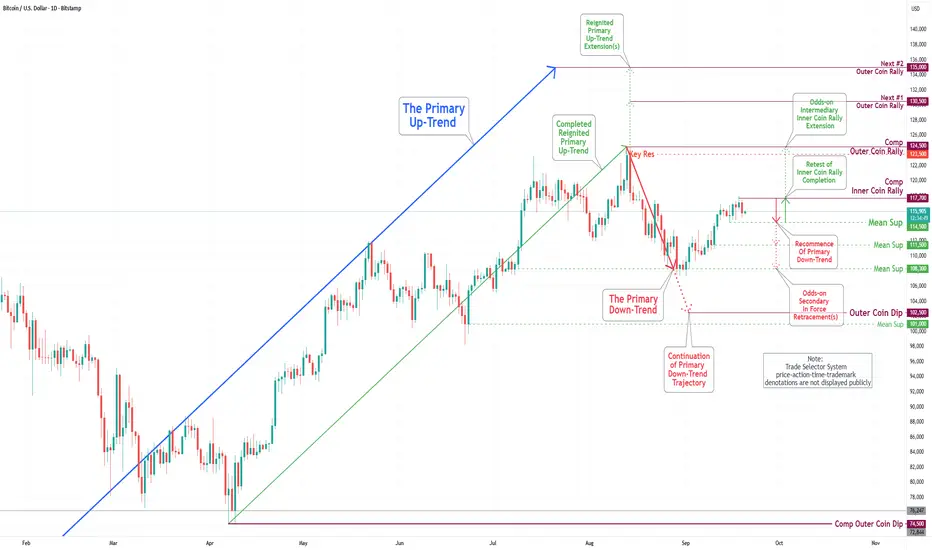
Bitcoin(BTC/USD) Daily Chart Analysis For Week of Sep 19, 2025Technical Analysis and Outlook:
In the previous trading session, the Bitcoin market exhibited a modest increase and completed Inner Coin Rally 117700. Consequently, the cryptocurrency is currently experiencing a resumption of the intermediate Primary Down-Trend rebound, with the primary target identified as Mean Support at 114500. Additional support levels are defined at 111500 and 108300, respectively.
Current analysis suggests a slight probability that the Intermediate Primary Rebound could facilitate a retest of the Outer Coin Rally at 124500, via the Key Resistance established at 123500.
However, it is critical to acknowledge that the prevailing Bitcoin market sentiment reflects a continuing downtrend. Whereas upon the conclusion of the Primary Down-Trend, the Outer Coin Dip at 102500, it is anticipated that Bitcoin will resume its upward trend.
USDT Dominance (USDT.D) Analysis📊 Currently, USDT dominance has reacted negatively after testing the 4.33% – 4.35% resistance zone along with the descending trendline. This area is acting as a supply zone, strengthening the probability of further downside.
🔻 If the resistance holds, we expect USDT.D to enter a bearish leg, first targeting the 4.25% level, and then potentially extending toward the key support zone at 4.20% – 4.21%.
⚡ Alternative Scenario: If a strong candle closes above 4.35%, further upside toward the 4.45% region could be seen. However, as long as price remains below resistance, the bearish outlook remains more likely.
📌 Summary:
• Key Resistance: 4.33% – 4.35%
• Main Supports: 4.25% and 4.20%
• Primary Scenario: Continuation to the downside toward 4.20% if resistance holds

BTC: $115K Support Zone Under PressureBitcoin is currently testing the $115K support zone, and it's showing signs of breaking through. If this level doesn't hold, we could see a drop toward the next support around $110K-$112K. On the flip side, if CRYPTOCAP:BTC bounces back, it might target the $120K resistance zone.
Set a market alert for a break below $115K to track any major moves.
DYOR, NFA

BTC Trade Idea: Short from 117,850 at previous resistance level
Bitcoin is currently at a previous resistance level 117,500 where the price has bounced down before.
Personally, I will enter a short trade from the current price with a tight stop-loss.
✅ My Personal Strategy:
Entry: Sell from current price 117,850
🎯 Target 1: 116,000
🎯 Target 2: 115,500
Stop Lose : Daily close above the resistance level 117,500
Please note:
This is not financial advice – I’m only sharing my personal trades.
Always do your own research before taking action.
👍 Don’t forget to like if you found this useful, and feel free to follow me for more analysis of this kind.
Best of luck 🌹

FTT BUY!!!Hello friends
According to the market cycle that has been drawn for you, from here according to the cycle we expect a return to the ceiling.
*Trade safely with us*

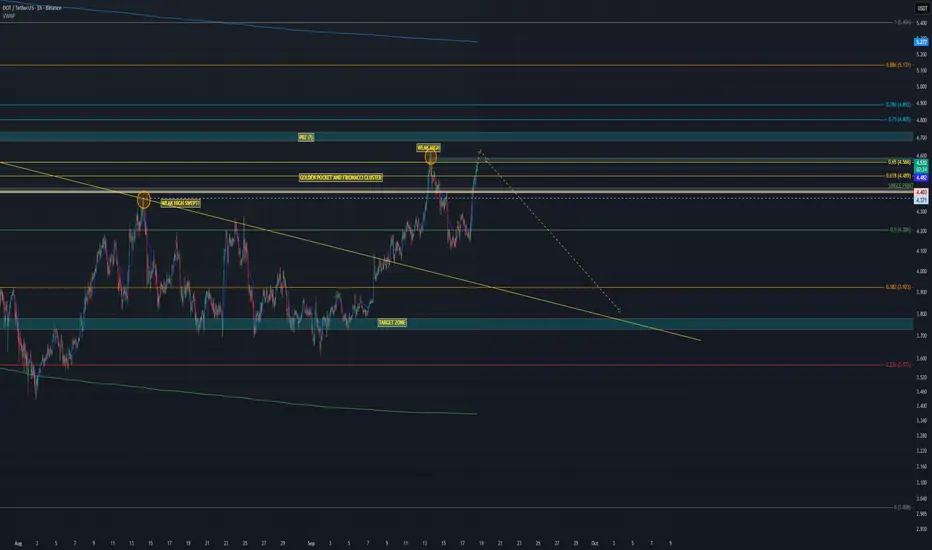
WHAT GOES UP, MUST COME DOWN – $DOT DUMP TIME?In my last analysis we nailed the move: CRYPTOCAP:DOT pumped to sweep the weak 14 Aug high exactly as projected. ✅ That mission is complete – now it’s time for the other side of the trade.
Analysis
14 Aug high swept → equilibrium reached.
Price in HTF Golden Pocket + strong Fib cluster.
Bearish harmonic + hidden bear div on CVD.
Orderflow: longs piling in, OI ↑ but price stuck → squeeze risk.
Likely SFP around $4.65 (take out Sept 13 high) → then dump.
First target: $3.75.
ETH SERIES | Final Episode – BTC.D (4H)
For the last 40 days, BTC.D has been dropping steadily.
This is the chart that shows Bitcoin’s weakness vs. altcoin strength.
The key question: does this downtrend continue, or do we get a reversal?
It’s not a one-time answer, we need to check this chart daily to stay ahead.
But for today, the message is crystal clear:🔥 We are in altcoin season!
Always take profits and manage risk.
Interaction is welcome.

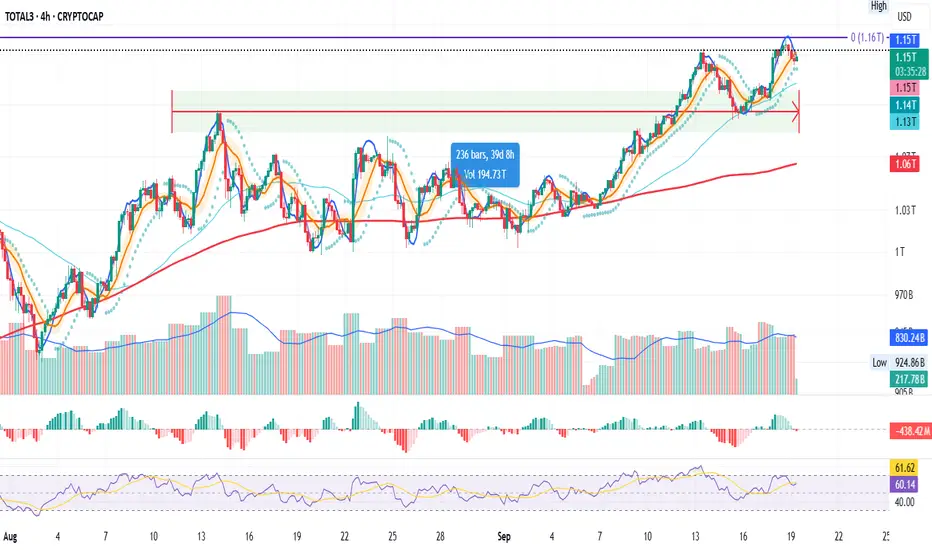
ETH SERIES | Part 6 – TOTAL3 (4H)
Last 40 days:
TOTAL3 is the strongest chart in this series.
Just printed a new ATH at 1.16T yesterday.
Structure is clean: higher highs + higher lows.
All previous episodes now point to the same conclusion → altcoins are setting up for a powerful push.
Final stop → BTC.D to see if Bitcoin dominance agrees with this scenario.
Always take profits and manage risk.
Interaction is welcome.