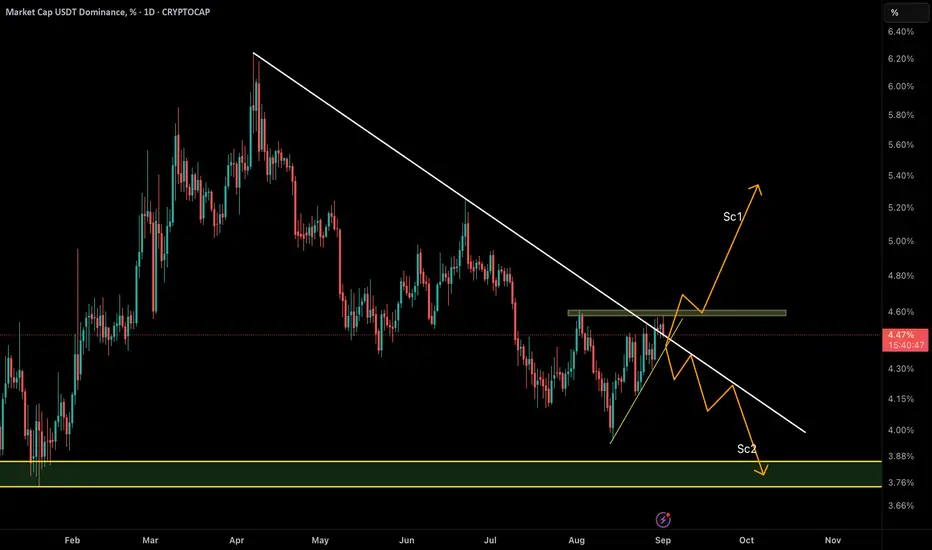
USDT Dominance at a Key Decision Point ,Crash or Fly?USDT Dominance has managed to break above the descending trendline (white line) with volume, but so far it has failed to clear the order block resistance at 4.61% (green zone).
At this stage, price action is stuck between two critical levels, and the next move could define the market’s mid-term direction:
🔸 Scenario 1 (Bullish for USDT.D / Bearish for Crypto):
A clean break and acceptance above the 4.61% order block would confirm demand for stablecoins, signaling capital rotation out of crypto assets. This could trigger a market-wide selloff in Bitcoin and altcoins.
🔸 Scenario 2 (Bearish for USDT.D / Bullish for Crypto):
Failure to hold above the broken trendline and a rejection from 4.61% could drive USDT.D back below the descending line, opening the path toward the 3.8% demand zone. This would suggest capital flowing back into crypto, fueling a potential bullish rally.
⚠️ Market participants should keep a close eye on this area — the reaction around 4.61% will set the tone for the weeks ahead.
Cryptopilot
Crypto Market at a Major Crossroad, USDT Dominance Will TellUSDT Dominance has reached the critical descending trendline resistance – a major decision point for the entire crypto market.
🔹 If USDT.D breaks above this trendline and holds, it signals rising demand for stablecoins. This usually means capital is leaving crypto assets, potentially starting a long-term bearish phase for the market.
🔹 On the other hand, if USDT.D fails to break this resistance and gets rejected, it could trigger a decline in dominance. That would suggest money is flowing back into Bitcoin and altcoins, opening the door for a possible new rally.
⚠️ The next few days are crucial. This zone is a macro decision point that may define the medium-to-long-term direction of the crypto market.

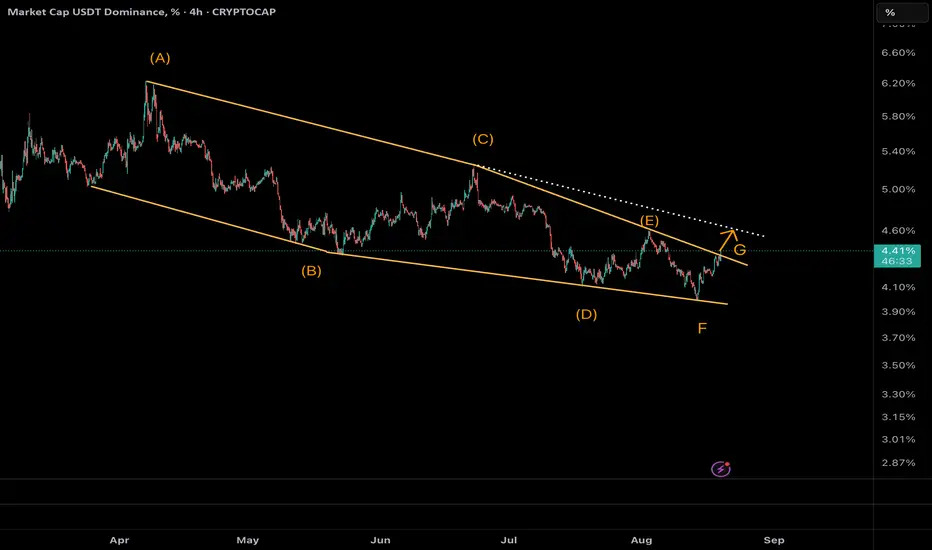
Stagnant Dominance Screams No Inflows – Crypto Crash Looming?Overview:
Over the past 43 days (July 12 to August 24, 2025), USDT Dominance has hovered around 4% with slight increases (from ~4% to 4.24%), indicating zero fresh capital inflows into crypto.
Growth in alts like Ethereum stems solely from money rotating out of Bitcoin (BTC.D decline), not new money— a classic redistribution trap. This setup warns of high crash risk, as the market lacks real liquidity support. As of August 24, 2025, USDT.D at 4.24% is priming for a surge, potentially triggering altcoin carnage.
NeoWave Technical Analysis:
The chart shows a completed Diametric correction (7 waves A-B-C-D-E-F-G) in the descending yellow channel, with Wave G accelerating downward. Wave A from ~6.4% to 4.9%, B rebound to 5.7%, C drop to 4.5%, D rise to 5.4%, E decline to 4.3%, F short rally to 4.5%, and G plunging to 4.24%.
Monowave count (~55-70 subwaves) and symmetry (A/C/E/G large, B/D/F small) validate the pattern. The trendline break confirms reversal, targeting the next line at ~4.6% (1.618 Fib extension from F low).
Stagnant dominance over 43 days underlines no inflows—crypto's "growth" is internal shuffling, vulnerable to sudden outflows.
Why Crash Risk is High:
No new cash means the market is floating on borrowed time. Ethereum's pumps owe to BTC rotations, not organic demand—per Statista, USDT dominance rose in May 2025 but stabilized, signaling caution. If USDT.D breaks 4.6%, alts could dump 20-30% as funds park in stables.
Trade Idea (Bullish USDT.D / Bearish Alts):
Entry: Long USDT.D above 4.24% on BOS confirmation; short ETH/alts below $4,800.
Targets: TP1 at 4.6%, TP2 at 5% (channel midline). For ETH: $3,800-$3,500.
Stop Loss: Below 4.1% (R:R ~1:3).
Sizing: 1-2% capital; trail on midline breaks. Watch volume—low inflows mean flash crashes ahead.
Crypto's house of cards—time to hedge! #USDTDominance #NeoWave #CryptoCrash #NoInflows

Bitcoin Dominance Elliott Wave Update: Wave ⑤ Near CompletionBTC Dominance has been unfolding in a clear 5-wave impulsive decline. Right now, price action is moving within the last leg — wave ⑤ — and has reached the 57.9% zone, which aligns with multiple confluences:
• ✅ 0.618 Fibonacci extension of wave (3)
• ✅ Bottom of the descending channel
• ✅ Strong psychological & structural support zone
This confluence suggests that wave ⑤ could be approaching its final stage of completion.
📌 Implication for Altcoins:
A local bottom in BTC dominance often translates into increased selling pressure on altcoins, as money flows back toward Bitcoin.
🎯 Key Levels to Watch:
• 57.9% → potential termination zone for wave ⑤
• 56.6% → full 1.0 extension of wave (3), deeper bearish scenario
⚠️ Invalidation:
If dominance breaks convincingly below 56.6%, the bearish extension continues, giving altcoins more room to breathe.
👉 For now, caution is advised on altcoins as BTC dominance nears completion of wave ⑤. Expect volatility and potential liquidity grabs.

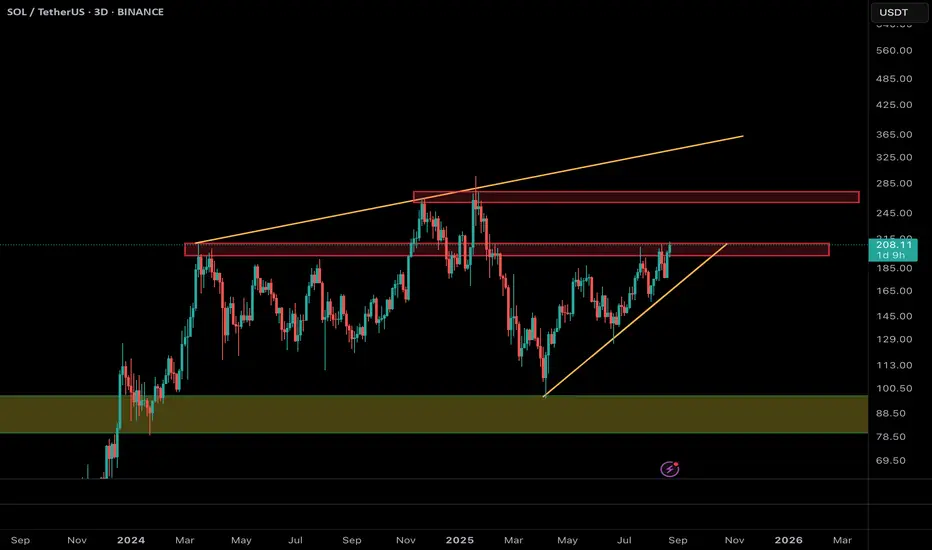
Solana at Make-or-Break: Can $213 Unlock the Rally to $270?Solana (SOL/USDT) has been recovering strongly since bouncing from the $110 area and is now testing the critical resistance zone around $205–213. This level has acted as a major barrier multiple times in the past, making it a true “make-or-break” point.
📌 Bullish Scenario (more likely if $213 holds):
• A confirmed breakout and daily/3D close above $213 could trigger a rally toward the next major resistance at $270.
• A successful move beyond $270 may even open the path toward the long-term resistance trendline near $320–340.
📌 Bearish / Alternative Scenario:
• If Solana fails to hold above $213, a pullback toward $180–175 is possible.
• Stronger support lies around $100, which remains the key level to defend for bulls.
⚡ Conclusion:
As long as SOL stays above $200, the structure remains bullish. A breakout above $213 would confirm momentum and unlock a potential move toward $270, while rejection could mean another corrective dip before the next attempt.
Bitcoin Trendline Breakdown: The Pullback Trap Before Further DoBitcoin has officially broken its ascending trendline on the daily chart — a strong technical signal that the bullish momentum is weakening. Yesterday’s sharp pump was nothing more than a classic pullback to retest the broken trendline, and price is now showing signs of rejecting it.
From a price action perspective, this setup often acts as a trap for late buyers, with the market typically retracing the entire pullback move.
🔑 Key Points:
• Daily ascending trendline has been broken.
• Yesterday’s rally = pullback retest of the broken structure.
• Market likely to erase yesterday’s gains and resume downward momentum.
📊 Key Levels to Watch:
• Support 1: $112,000
• Support 2: $108,000
• Invalidation: A daily close back above yesterday’s high (~$117,000).
🎯 Trading Strategy:
• Wait for confirmation on lower timeframes (1H/4H) such as a CHoCH (Change of Character) or BOS (Break of Structure).
• Short entries become favorable if price fails to reclaim $117k.
• Initial targets: $112k → $108k.
• Keep stops above the recent swing high to control risk.
⚡ Summary:
The break + retest of the ascending trendline is a bearish sign. As long as BTC trades below the retest zone, the path of least resistance is down. Traders should stay patient, wait for proper entry signals, and avoid being trapped by the pullback.
⸻

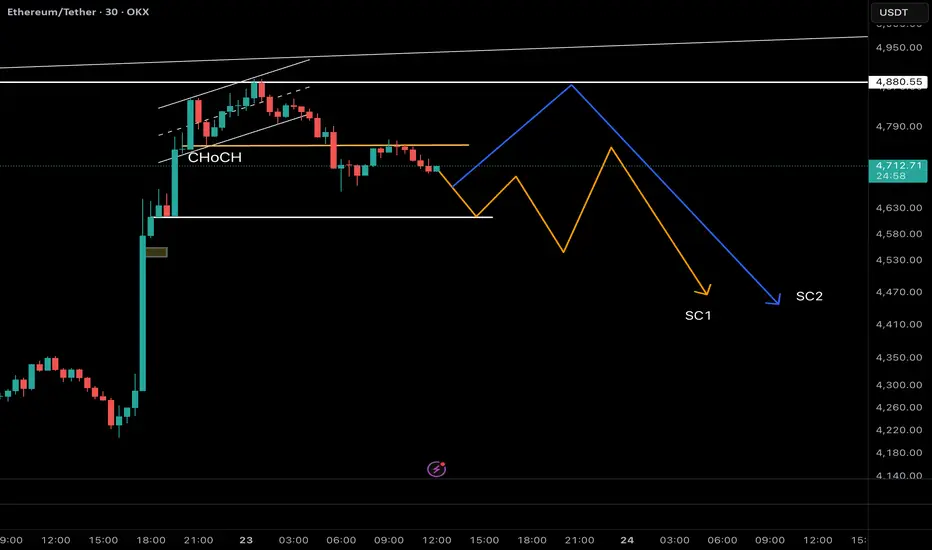
Ethereum Update: CHoCH Confirmed – Waiting for BOS & Wave C! As mentioned in my previous Ethereum analysis, ETH has completed its 5-wave impulsive rally and is currently inside wave B of a corrective ABC structure. Wave B often breaks above the wave ⑤ top to trap liquidity before a sharp wave C sell-off.
📊 Latest Price Action (30m TF):
• ETH has already shown a CHoCH by breaking the first key support at $4,753 and retesting it.
• The next crucial support lies at $4,613. If this level also breaks, it would confirm a BOS (Break of Structure) and strengthen the bearish case.
🔀 Two Possible Scenarios from Here:
1. Price retests the broken $4,753 level as resistance → then resumes the downtrend.
2. A deeper pullback toward $4,845 (acting as a left shoulder liquidity zone) → before the real wave C decline begins.
🎯 Trading Strategy:
• Wait for confirmation of BOS at $4,613.
• Once confirmed, look for bearish entry triggers (CHoCH / MSB) on lower timeframes.
• First targets: $4,100 → $3,800.
• Stop-loss invalidation above the swing high at $4,845 to maintain strict risk control.
⚠️ Remember: patience is key. Don’t get trapped in wave B’s fake breakouts — let the structure confirm wave C.
👉 Like & Follow to stay updated as we track ETH’s potential wave C move step by step!
Ethereum Elliott Wave Analysis: The Bull Trap Before Wave C!As mentioned in my previous two analyses, Ethereum rejected the $4,740 high and dropped to the $4,050 support zone, where it bounced exactly as projected.
From an Elliott Wave perspective, ETH has already completed a 5-wave impulsive structure and is now inside a corrective ABC phase. At the moment, price action is developing within wave B. Historically, wave B has the tendency to break above the top of wave ⑤, creating a bull trap and sweeping liquidity before the real wave C sell-off begins.
📉 What does this mean for traders?
Wave C is usually sharp, aggressive, and offers great risk-to-reward opportunities on the short side. But instead of rushing into shorts, the smart play is to wait for confirmation.
🎯 Trading Strategy:
1. Allow wave B to complete – watch for a liquidity grab above the $4,840–$4,800 zone.
2. Look for a CHoCH (Change of Character) / market structure break on lower timeframes (4H / 1H) as your entry trigger.
3. Enter short after confirmation, targeting the $4,100 → $3,800 zones first, with potential extension lower depending on momentum of wave C.
4. Place invalidation above the recent swing high to keep risk controlled.
⚡ This is a high-probability short setup forming, but patience and timing are crucial — don’t get trapped in wave B’s fake breakout.
👉 Follow for updates as we track the confirmation of wave C and refine the short targets!

Bitcoin (BTCUSDT) – Smart Money Update🔔 Following our previous analysis predicting BTC drop to ~112k, we now update the market scenario using Smart Money & Price Action concepts.
📉 As expected, BTC entered a bearish phase after a Break of Structure (BOS) and distribution phase, currently approaching the key liquidity zone 108k–110k. This zone is a strong area for liquidity grab and institutional buy orders.
📌 Probable Scenario:
• BTC may touch 108k and then perform a corrective move to 113k–114k.
• A breakout above this range (e.g., towards 120k) is not guaranteed and requires reassessment of Price Action at that time.
🔑 Key Points (Smart Money Concepts):
• Liquidity below recent lows is still unfilled.
• The 108k–110k range acts as a higher timeframe Order Block.
• Pullback to 113k–114k could simply be a retracement to the Supply Zone.
📍 Summary:
Short-term: higher probability of BTC drop to 108k, followed by a limited recovery to 113k–114k. Further upside continuation or breakout needs reevaluation at that time.

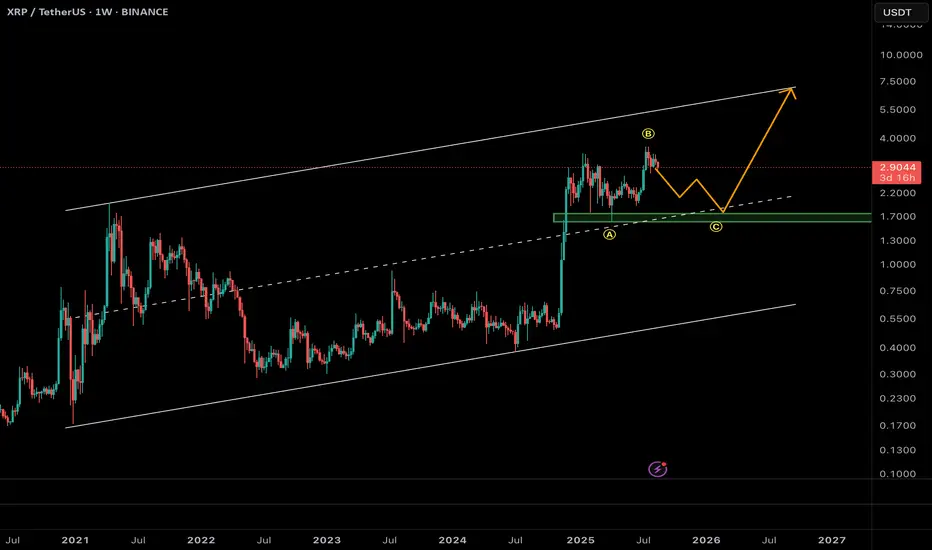
XRP – Corrective Move Before the Next Rally?XRP is currently showing signs of completing a corrective structure after its strong bullish rally earlier this year.
🔹 Technical Outlook:
• Price is trading inside a long-term ascending channel.
• After marking the swing high near $4.0, price seems to be unfolding a ABC corrective wave.
• Currently in wave C, with potential downside extension toward the midline of the channel (~$1.9 – $2.0).
• This zone also aligns with strong historical support and the 0.618 Fibonacci retracement of the last impulse (confluence area).
🔹 Possible Scenario:
1. Completion of wave C around $1.9 support.
2. Start of a major impulsive leg targeting the upper boundary of the channel around $6.5 – $7.0.
📊 Market Implication:
Short-term caution is needed as corrective pressure might continue, but long-term structure still supports a bullish outlook.
✅ Conclusion:
As long as XRP holds above $1.7 – $1.9 support zone, the bullish scenario remains valid. Mid/long-term traders may watch this level as a potential re-accumulation zone before the next impulsive rally.
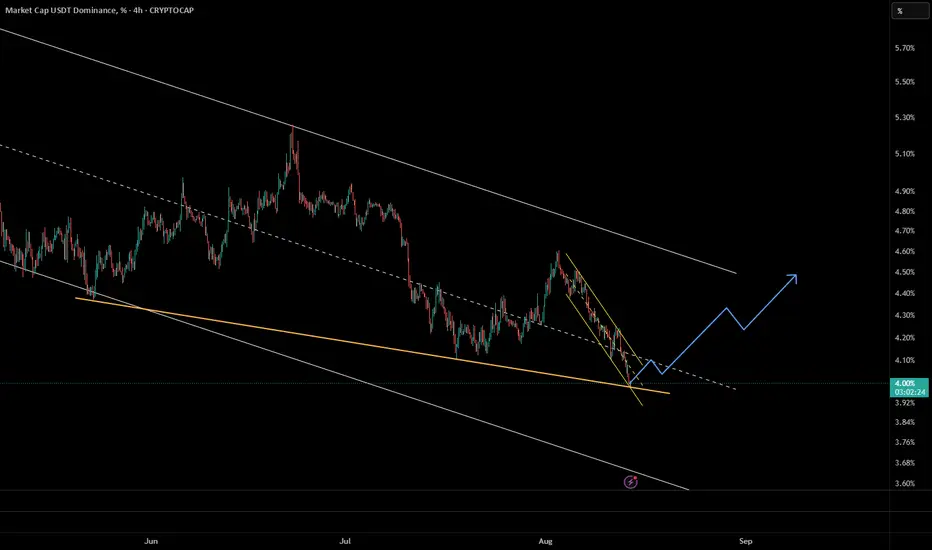
USDT Dominance – Breakout, Retest & Ready for Next MoveUSDT Dominance has just broken above its descending trendline and successfully retested it as support. After this pullback, the chart suggests a continuation to the upside within the ascending channel.
🔹 Technical Highlights:
• Breakout from the falling trendline confirmed.
• Retest completed around 4.35% → holding as support.
• Price action remains within a short-term ascending channel.
• Next upside target: 4.55% – 4.60% (marked as point G).
📊 Market Implication:
Rising USDT Dominance usually means liquidity flows out of riskier assets (altcoins) into stablecoins. If this uptrend continues, altcoins could face further downward pressure while traders seek safety.
✅ Conclusion:
As long as dominance holds above 4.30–4.35%, the bullish scenario remains intact. A push toward 4.55% is likely the next move.

Chainlink (LINK/USDT) – Two Key Scenarios AheadChainlink is currently trading at $24.9, right below a major resistance zone around $27.3. The price has been moving within a long-term ascending channel since mid-2022, and right now it’s at a decisive point.
🔹 Scenario 1 (More Probable – Bearish Rejection)
If LINK fails to break $27.3, we could see a rejection that triggers a correction towards the lower boundary of the ascending channel, around $15–17 (SC1). This aligns with the overextended move and prior rejection patterns.
🔹 Scenario 2 (Bullish Breakout)
A successful breakout above $27.3 with strong volume could fuel a rally toward the channel top, targeting the $45–52 zone (SC2).
📊 Technical Notes:
• Current resistance: $27.3 (critical decision point).
• Support levels: $18–19, then $15–17 (channel support).
• Next resistance above $27.3: $34, then $45–52.
• Structure: Ascending channel since mid-2022.
✅ Conclusion
While both scenarios are valid, the bearish rejection (Scenario 1) seems more likely unless LINK breaks $27.3 with conviction. Traders should watch for rejection signals at current levels before committing.

USDT.D Daily | Explosive Surge from 4% –Altcoins Bloodbath Ahead🔹 Overview
USDT Dominance (USDT.D) has completed a 7-wave Diametric correction inside the descending yellow channel. Now, Wave G is accelerating with strong momentum.
, dominance is at 4.33%, breaking the channel trendline. This confirms the end of the correction phase and signals the start of a dominance rally.
Our prior forecast from the 4% floor is playing out exactly—capital is flooding into stables as risk-off sentiment crushes Altcoins.
⸻
🔹 Wave Structure (NeoWave)
• Diametric unfolded as A-B-C-D-E-F-G.
• Symmetry holds: large A/C/E/G vs. small B/D/F.
• Trendline break = pattern completion.
Monowave count (~55–70) confirms the structure’s legitimacy.
⸻
🔹 Technical Setup
• Current support: 4.28% (brown line).
• Target 1: 4.6% (Fib 1.618 extension + trendline).
• Target 2: 5% (channel midline).
• RSI bullish divergence + rising volume confirm strength.
⸻
🔹 Market Implications
This breakout means:
⚠️ Altcoin Bloodbath incoming.
USDT dominance rally = liquidity moving away from alts. BTC/ETH may stabilize, but alts risk heavy drawdowns.
⸻
🔹 Trade Idea (Bullish USDT.D)
• Entry: Long USDT.D (or short alts) above 4.33% on BOS confirmation (daily).
• Targets: TP1 = 4.6%, TP2 = 5%.
• Stop Loss: Below 4.28%.
• Risk: 1–2% per trade. Trail stops if midline breaks.
⸻
🔥 Get ready for a stablecoin takeover & brutal altcoin flush.
ADA/USDT : Heavy Pullback Expected Before Major Price Surge📊 Pattern Overview
Cardano is shaping a classic contracting triangle on the daily timeframe, with all legs unfolding as 3-wave zigzags, fully compliant with NeoWave rules.
• Wave A: $1.33 → $0.51 (zigzag decline)
• Wave B: $0.51 → $1.18 (zigzag rally, ~82% retrace of A)
• Wave C: $1.18 → $0.52 (zigzag decline, ~99% retrace of B)
• Wave D: $0.52 → $0.92 (zigzag rally, ~61% retrace of C, currently in progress)
• Wave E: Expected $0.92 → $0.51 (projected zigzag, targeting channel support)
This setup aligns with a contracting triangle, with converging trendlines projecting an apex around November 2025.
⸻
📉 Near-Term Expectation
• Wave E is anticipated to pull ADA back toward $0.51 (long-term channel support).
• This would complete the triangle and set the stage for a powerful bullish thrust.
⸻
🚀 Post-Triangle Outlook
• A bullish breakout from the triangle could target:
• $1.5 (TP1)
• $1.8 (TP2)
• This aligns with NeoWave projections of a 75–125% thrust of the channel width.
• Break of $0.92 (BOS) will be the confirmation trigger for the rally.
⸻
🎯 Trading Plan
• Entry: Wait for pullback to ~$0.51 (Wave E completion) and BOS confirmation.
• Targets: $1.5 – $1.8
• Stop Loss: Below $0.45
• Risk Management: 1–2% capital per trade, trail stops above $1.0 once thrust begins.
⸻
⚠️ Key Levels
• Support: $0.51 (channel bottom)
• Resistance: $1.0, then $1.5–$1.8
• Invalidation: Break below $0.45
⸻
✅ Summary: Patience is key. A final pullback toward $0.51 could be the last shakeout before a major bullish breakout.

ETH.D : 5-Wave Bull Run Over –Bitcoin to Outshine EthereumeEthereum Dominance (ETH.D) has completed a textbook 5-wave impulsive rally on the weekly timeframe, signaling the end of its upward cycle and entry into a deep corrective phase. As of August , ETH.D at 13.37% is rejecting the key order block at ~14%, hinting at weakening momentum. This shift favors Bitcoin's outperformance, as capital rotates from ETH to BTC, potentially boosting BTC/ETH ratio and Bitcoin returns during the downturn.
NeoWave Wave Count (Daily Chart):
The rally from ~10.5% lows unfolded in 5 waves: Wave 1 to ~11.41%, Wave 2 correction to ~10.11%, Wave 3 extended to ~13.97% (161.8% of Wave 1), Wave 4 shallow to ~13.32%, and Wave 5 topping at 13.97% with the 1.618 Fib extension (1.141%).
Monowave count (~55-70 subwaves) validates the impulse, with alternation (Wave 2 deep/time-extended, Wave 4 shallow/short). The ascending channel (yellow) has been touched multiple times, and the recent rejection confirms exhaustion.
Weekly Chart Insight:
On the weekly TF, ETH.D has hit a major order block at ~14% (1.425%), not the channel top, coinciding with the 1.618 Fib extension from 2023 lows and historical resistance from 2018 highs (~52%). This multi-year descending channel holds firm, with price failing to break the OB—suggesting reversal to midline ~12.5% or lower (38.2%-50% Fib retrace of rally).
Why Bitcoin Outperforms From Here:
As ETH.D corrects (likely a Zigzag or Flat, targeting 11%-12%), Bitcoin gains dominance, driving better returns for BTC holders. Expect BTC/ETH ratio to climb (current ~12.5, target 14-15), with Bitcoin yielding 10-20% superior performance in risk-off environments. If ETH.D drops below 12.5%, correction accelerates to 10% (78.6% Fib), amplifying BTC's edge.
Trade Idea (Bearish ETH.D / Bullish BTC):
Entry: Short ETH.D (or long BTC/ETH pair) below 13.32% on BOS confirmation in weekly.
Targets: TP1 at 12.5% (channel midline), TP2 at 11% (50% Fib).
Stop Loss: Above 14.25% (OB high, R:R ~1:3).
Sizing: 1-2% capital; trail stops on midline breaks. Watch dominance flips—crypto rotations can spark quick BTC pumps.
ETH bulls, pivot to BTC now! #ETHDominance #NeoWave #BitcoinOutperformance #CryptoAnalysis

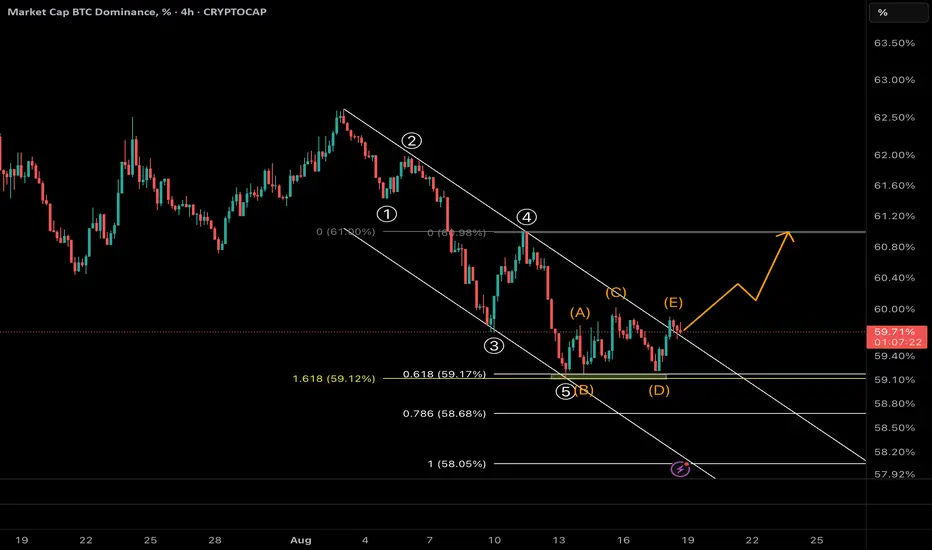
Bitcoin Dominance Breaks Out: Altcoins in Danger?🔎 BTC Dominance (BTC.D) – 4H Analysis
• The 5-wave decline has completed right at the 1.618 Fibonacci extension (59.1%), confirming a potential bottom.
• A contracting triangle (A–B–C–D–E) has formed and just broke to the upside, coinciding with the breakout of the descending channel.
⸻
📈 Main Scenario
• With this breakout, BTC dominance is entering a new bullish phase.
• Next targets:
• 60.8% – 61.0% (key Fibonacci resistance + channel top)
• If broken, possible extension to 61.4% – 62.0%
⸻
⚠️ Implications for Altcoins
• Rising BTC dominance usually means capital is rotating into Bitcoin → leading to heavy sell-offs in altcoins.
• Alt traders should be cautious: this move can trigger a broad correction across the altcoin market.
⸻
📉 Alternative Scenario
• If BTC.D falls back below 59.3%, the breakout may turn into a fakeout, and a retest of lower levels could follow.
⸻
✅ Conclusion:
The breakout above the descending channel is a strong signal of trend reversal. As long as BTC.D stays above 59.3%, the path toward 61%+ is favored. This could mark the beginning of a tough phase for altcoins.
Tether Dominance: Wave B Bounce Before the Next Drop?This 1H chart of USDT Dominance shows the completion of a clear 5-wave impulsive advance, followed by a corrective decline that we can label as Wave A.
Now, signs suggest that Wave A is completed, and the market is preparing for a Wave B bounce.
🔹 Key observations:
• Wave A corrective structure has likely bottomed.
• Wave B is expected to retrace upward, targeting the descending trendline resistance.
• Once Wave B is complete, a Wave C decline is anticipated, continuing the corrective phase.
⚠️ Invalidation: A decisive breakout above the trendline would negate the corrective count and signal a potential bullish extension.
⸻
📌 Summary
Near-term outlook suggests a relief rally (Wave B) toward resistance, followed by a Wave C correction lower, as long as price respects the descending trendline.

Another Storm Brewing for Altcoins – Others.D Hits Critical ResOn the 4H chart, Altcoin Dominance (Others.D) has surged back toward 7.8%, testing the upper resistance zone once again. This move mirrors previous peaks, where sellers stepped in aggressively, triggering sharp pullbacks.
📌 Technical Snapshot:
• Price rejected near 7.85%-7.90%, aligned with a descending resistance line (white) and long-term horizontal resistance (yellow dashed).
• The recent rally from 7.45% lows was steep and fast, suggesting exhaustion as momentum indicators flash early divergence.
• Structure resembles a corrective rally inside a broader downtrend channel (white boundaries).
📉 Bearish Outlook for Alts:
• Failure to break above 7.90% could spark another sell-off, pushing dominance back toward 7.50%-7.45%.
• A deeper flush may extend toward 7.30%, coinciding with the channel bottom.
• Meanwhile, if BTC.D continues to strengthen, alts may face another storm of capital rotation back to Bitcoin and stables.
📊 Scenario Path (Red Flag for Alts):
• Consolidation at 7.8% → rejection from trendline
• Breakdown toward 7.6% → 7.5% → possibly 7.3%
• Only a decisive breakout above 7.90%-8.00% invalidates the bearish case and opens the door for a sustained altseason.
⸻
🎯 Trade Idea (Risk-Off Bias):
• Watch for rejection at 7.8%-7.9% zone
• Short bias on alts / hedge exposure if dominance rolls over
• Target zones: 7.5% → 7.3%
• Stop above 8.0% to protect against breakout

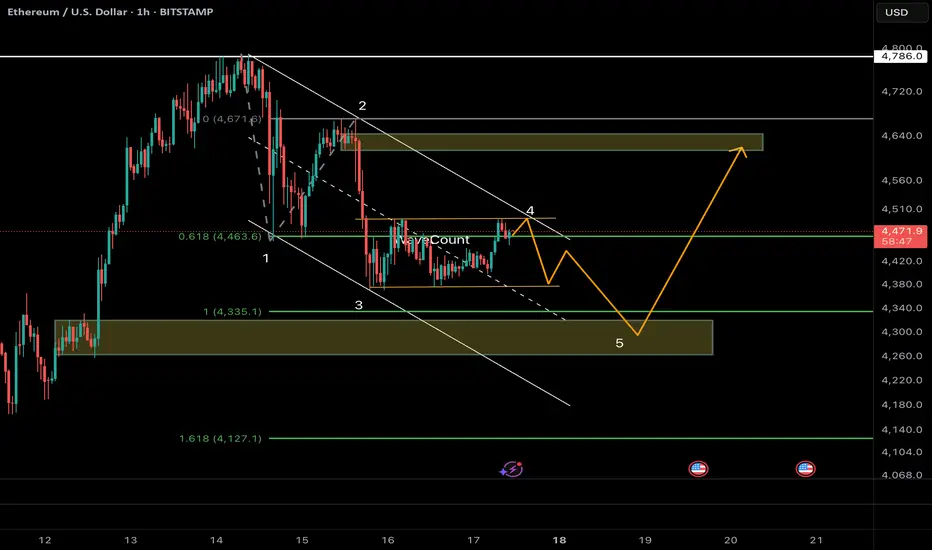
ETH/USDT :Wave 5 Drop to 4300–Rebound Rally to 4600 Before Crashthereum has likely completed a 5-wave impulsive rally from 1380 → 4780, with the channel break confirming a larger correction in progress.
Currently, price is unfolding Wave A of an ABC NeoWave structure, subdividing into 5 smaller waves.
⸻
🔹 Wave Count Breakdown
• Wave 1: Sharp drop to ~4335
• Wave 2: 61.8% rebound to 4463
• Wave 3: Extended selloff (161.8% of W1) → 4335
• Wave 4: Shallow retrace (~38.2% W3) → 4463
• Wave 5 (in progress): Targeting 4300–4270 (1.618 Fib + channel floor)
👉 Monowave count (~45–55) sits perfectly inside NeoWave’s 34–89 range → confirming impulsive character of this Wave A.
⸻
🔹 Next Path Scenarios
1. Wave A completion → Short-term bottom around 4300 (confluence of Fib + channel).
2. Wave B rebound → Relief rally toward 4460–4600 (38.2–50% retrace of A). Likely a sharp ABC bounce that traps late shorts.
3. Wave C decline → Resumption of downtrend toward 3800–4000, with risk of an extended drop to 3500 if momentum accelerates.
⸻
🔹 Technical Clues
• Fib structure: Textbook alternation (W2 deep / W4 shallow).
• RSI divergence at lows → exhaustion signals.
• Dominance context: USDT.D rebounding + BTC.D >60% → capital rotation suggests ETH downside risk remains elevated.
⸻
🔹 Trade Setup (Bias: Short with rebound play)
• Entry (short): Below 4400 on BOS confirmation (break of 4335).
• Targets: TP1 = 4300 (end of A), TP2 = 3800 (post-B wave).
• Rebound long: Consider 4300 → 4600 scalp if Wave A completes.
• Stops: Above 4463 (W4 high) for shorts / below 4300 for longs.
• Risk mgmt: 1–2% position size; trail stops along channel midline.
⸻
⚠️ Volatility remains extreme. Manage risk strictly—crypto psychology flips fast.
Tether Dominance at Double Support – Is the Bull Run in Danger?The market is currently at a critical juncture – any correction from here could signal the end of the strong bullish wave we’ve been riding.
As seen in the Tether Dominance chart, price has reached two key support levels. From this zone, we anticipate a potential strong reversal in the market.
Bitcoin Dominance Hits Channel Floor – Altcoin Storm Incoming?Bitcoin dominance has been sliding within a well-structured descending channel since early August. Now, it’s touching the channel’s lower boundary — a level that has previously sparked strong reversals.
A bounce from here could ignite a short-term uptrend in BTC dominance, targeting the channel’s midline and possibly its upper boundary.
If this happens, capital is likely to rotate back into Bitcoin, applying pressure on altcoins and triggering a corrective phase in the broader altcoin market.
Key Takeaway: Watch for bullish price action at the channel’s floor. A confirmed breakout in dominance could mark the start of an “altcoin cooldown” phase.

BNB at the top of Bullish Channel
As it shown, BNB is around top line of Channel ad get ready to drop

BTC.D , Bitcoin Dominance Ready to RiseAfter a descending wedge pattern, Bitcoin Dominance has shown the first signs of an upward move. A CHoCH (Change of Character) has formed on the 4-hour timeframe, signaling a potential trend reversal.
We are now awaiting a retest of the broken resistance level before continuation of the bullish trend. However, the price might skip the retest and proceed directly higher.
Stay tuned for confirmation and manage your positions accordingly.
