“BTC/USD: Structure Shift From Accumulation to Expansion”Market Structure
Overall structure:
After a sharp sell-off from the prior highs (left side), Bitcoin has transitioned into a range / accumulation phase, then recently broke upward from consolidation.
The series of higher lows marked by the black arrows suggests bullish structure building since late December.
2. Key Zones
🔴 Resistance Zone (≈ 100k – 104k)
This is a major supply zone where price was aggressively rejected before.
Strong selling pressure previously entered here → expect:
First test = rejection likely
Multiple tests = higher chance of breakout
The dotted mid-line inside the zone is a reaction level, not a clean breakout area.
🟡 Support Zone (≈ 88k – 90k)
Former resistance → now acting as support (role reversal).
Price recently:
Broke above it
Pulled back
Held → bullish confirmation
This zone is critical for maintaining the bullish bias.
3. Current Price Action
Price pushed impulsively to ~96–97k (strong bullish momentum).
The purple path suggests a healthy pullback:
This would likely be a bullish retracement, not weakness.
As long as price holds above the support zone, the trend remains intact.
4. Likely Scenarios
✅ Bullish Continuation (Higher Probability)
Pullback into 90k–92k
Buyers step in (bullish candle / volume)
Push toward 100k+
Possible:
First rejection
Then consolidation
Break into resistance zone
📈 Target: 100k – 104k
⚠️ Bearish / Invalid Scenario
Clean 4H close below ~88k
Would indicate:
Failed breakout
Return to range
That could open downside toward 85k–82k
5. Momentum & Volatility Insight
The smooth blue curves indicate volatility compression → expansion.
Expansion happened upward → bias remains bullish until structure breaks.
Sharp moves followed by shallow pullbacks = trend strength, not exhaustion (yet).
6. Trading Takeaway (Not Financial Advice)
Bias: Bullish while above support
Best risk area: Support retest (90k zone)
Worst place to enter: Mid-range (95k–97k)
Key decision point: Reaction at 100k resistance
Cryptos

BTC weekly Naked VWAP hit btc we have just printed a new high, now btc is retracing, we hit the Nacked Weekly vwap, there is a heavy volume around 90k, I think price is likley going to gravitate down there.

INTRADAY BTC LONGThis is an intraday trade. BTC is making a Inverted HnS in 15 min time frame. As you can see on the charts the neckline has been broken hence entry can be made here or dips with SL of right shoulder low.
SL- 92000
Target- 93000, 93300.
Disclaimer- This is just for educational purpose.
JAI SHREE RAM

Bitcoin Holds Firm, Bulls Stay in ControlBTCUSDT is currently trading around 93,300–93,400 USDT, holding onto its upward momentum after the strong breakout seen in early January. The market still looks buyer-driven, with recent pullbacks appearing more like healthy technical corrections rather than a shift in sentiment.
From a broader perspective, crypto market sentiment continues to improve as capital flows back into risk assets and expectations grow that global liquidity conditions may ease in the coming period. This backdrop allows Bitcoin to maintain its role as a market leader, especially since there has been no negative news strong enough to trigger a reversal.
The preferred scenario remains a continuation of the short-term uptrend. As long as BTC holds above the rising trendline, a clean break above 94,000–94,500 could open the door toward the 96,000 USDT area in the near term. On the downside, any pullbacks into current support zones are still viewed as constructive pauses within an intact bullish structure, rather than signs of trend exhaustion.

Measured move targets for HBARIf this indeed breaks out in 2026, there are three measured move targets I'm watching for:
Target #1 - $2+
Target #2 - $6+
Target #3 - $20-to-$30

Potential PullBack to $110K on BTCUSDFollowing the previous analysis, this phase marks the critical inflection point that will determine our long-term directional bias. Price is now positioned to pull back into intra-weekly premium, and the reaction from that zone will reveal whether bullish momentum is ready to re-assert dominance.
While one element of my full confirmation model is still missing, the structure is tightening and the market is preparing for a decisive move.
High-Probability Setup (3× Potential)
Direction: Long
Entry: $87,700
Stop Loss: $81,000
Targets:
* $100,000
* $110,000
* $117,000
This structure provides a powerful asymmetric opportunity. Manage your size with discipline, risk should always remain proportional and controlled.
Welcome to Chaos.

1 hour view (xrp) short-term SHORTHello 🙋♀️🙋♂️👽👻🐮🌍
just a quick idea and possible short available here. price could go much lower because we are in a descending triangle on daily time frame view.
⏬⏬
For now I have my eyes on 💲1.8 as a possible short term target.
This is just an idea, please trade at your own risk
🐶This is a Short term short Idea. The cryptocurrency market is extremely volatile💣
This is not financial advice
🐶
Always have a stop loss ✋🛑💲 set🆗
Any thoughts 💭💡, questions 🙋♀️🙋♂️❓, good 👍, bad👎, happy 😄 or sad 😥, in the comments always welcome.😄
Jazerbay ☯️

WATCH FOR MSTR HIGH PROBABILITY LONG SETUP SOON!!!🚨 MSTR HIGH PROBABILITY BUY SETUP 🚨
* Here We Can See Clearly The Next Potential Moves For MSTR Coming Hours/Days.
* Keep Your Eyes Close On Your Trading Positions.
* Happy PIP Hunting Traders.
FXKILLA.

BITCOIN HIGH PROBABILITY BUY SETUPSOON!!!🚨BTC HIGH PROBABILITY BUY SETUP 🚨
* Here We Can See Clearly The Next Potential Moves For BTCUSD Coming Hours.
* Keep Your Eyes Close On Your Trading Positions.
* Happy PIP Hunting Traders.
FXKILLA.

SUIUSD; Heikin Ashi Trade Idea📈 Hey Traders!
Here’s a fresh outlook from my trading desk. If you’ve been following me for a while, you already know my approach:
🧩 I trade Supply & Demand zones using Heikin Ashi chart on the 4H timeframe.
🧠 I keep it mechanical and clean — no messy charts, no guessing games.
❌ No trendlines, no fixed sessions, no patterns, no indicator overload.
❌ No overanalyzing market structure or imbalances.
❌ No scalping, and no need to be glued to the screen.
✅ I trade exclusively with limit orders, so it’s more of a set-and-forget style.
✅ This means more freedom, less screen time, and a focus on quality setups.
✅ Just a simplified, structured plan and a calm mindset.
💬 Let’s Talk:
💡Do you trade supply & demand too ?
💡What’s your go-to timeframe ?
💡Ever tried Heikin Ashi ?
📩 Got questions about my strategy or setup? Drop them below — ask me anything, I’m here to share.
Let’s grow together and keep it simple. 👊

ETHUSD; Trade Idea📈 Hey Traders!
Here’s a fresh outlook from my trading desk. If you’ve been following me for a while, you already know my approach:
🧩 I trade Supply & Demand zones using Heikin Ashi chart on the 4H timeframe.
🧠 I keep it mechanical and clean — no messy charts, no guessing games.
❌ No trendlines, no fixed sessions, no patterns, no indicator overload.
❌ No overanalyzing the market; use only two time frames.
❌ No scalping, and no need to be glued to the screen.
✅ I trade exclusively with limit orders, so it’s more of a set-and-forget style.
✅ This means more freedom, less screen time, and a focus on quality setups.
✅ Just a simplified, structured plan and a calm mindset.
💬 Let’s Talk:
💡Do you trade supply & demand too ?
💡What’s your go-to timeframe ?
💡Ever tried Heikin Ashi ?
📩 Got questions about my strategy or setup? Drop them below — ask me anything, I’m here to share.
Let’s grow together and keep it simple. 👊

XRPUSD; Heikin Ashi Trade Idea📈 Hey Traders!
Here’s a fresh outlook from my trading desk. If you’ve been following me for a while, you already know my approach:
🧩 I trade Supply & Demand zones using Heikin Ashi chart on the 4H timeframe.
🧠 I keep it mechanical and clean — no messy charts, no guessing games.
❌ No trendlines, no fixed sessions, no patterns, no indicator overload.
❌ No overanalyzing the market; use only two time frames.
❌ No scalping, and no need to be glued to the screen.
✅ I trade exclusively with limit orders, so it’s more of a set-and-forget style.
✅ This means more freedom, less screen time, and a focus on quality setups.
✅ Just a simplified, structured plan and a calm mindset.
💬 Let’s Talk:
💡Do you trade supply & demand too ?
💡What’s your go-to timeframe ?
💡Ever tried Heikin Ashi ?
📩 Got questions about my strategy or setup? Drop them below — ask me anything, I’m here to share.
Let’s grow together and keep it simple. 👊

BTCUSDT – Downtrend - The Market Enters a Critical TestBitcoin is losing bullish momentum and gradually shifting into a phase dominated by selling pressure. After multiple failed recovery attempts, BTCUSDT is showing clear signs of buyer fatigue as short-term capital pulls back and risk-off sentiment spreads across the market.
From a market context perspective, caution is prevailing as investors wait for key U.S. economic data. The U.S. dollar is showing signs of recovery, while Treasury yields stabilize, reducing the appeal of risk assets like Bitcoin in the short term. As a result, speculative flows have become more defensive.
On the price chart, the short-term bullish structure has been broken. Bitcoin continues to form lower highs, signaling that sellers are taking control of price action. Recent rebounds are weak and purely technical, quickly met with selling pressure—typical behavior during the early stages of a developing downtrend.
Notably, key support zones below are being gradually eroded. A clear break of these levels could trigger stop-loss cascades, accelerating the downside move. In this environment, attempting to catch the bottom carries significant risk.
From a trader’s perspective, selling on pullbacks remains the preferred strategy. Trading in alignment with the prevailing trend, maintaining strict risk management.

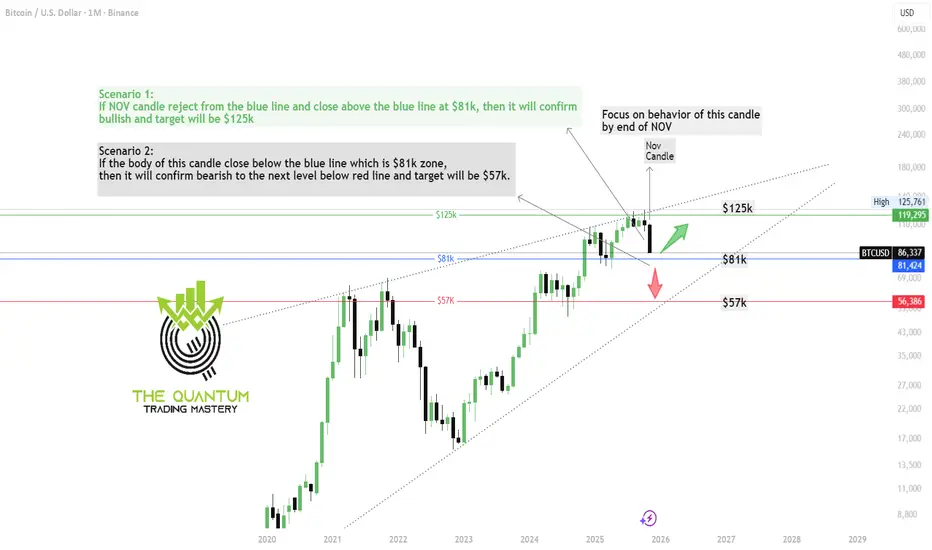
BTC Monthly Chart Technical AnaylsisDear Traders,
As expected from our previous weekly chart analysis, BTC has reached the $80K zone and has now successfully tapped $86K.
At this stage, the monthly candle is extremely important. I’ve shared the November candle—watch the closing carefully, because a major opportunity could be forming.
Trade smart, stay cautious, and if you find this update valuable, please show your support by boosting the post and dropping a comment.
The Quantum Trading Mastery
CATCH ON ETHERUM HIGH PROBABILITY LONG SETUP SOON!!!🚨ETHER HIGH PROBABILITY BUY SETUP 🚨
* Here We Can See Clearly The Next Potential Moves For ETCUSD Coming Hours/Days.
* Keep Your Eyes Close On Your Trading Positions.
* Happy PIP Hunting Traders.
FXKILLA.

GET READY FOR BITCOIN HIGH PROBABILITY LONG SETUP SOON!!!🚨BTC HIGH PROBABILITY BUY SETUP 🚨
* Here We Can See Clearly The Next Potential Moves For BTCUSD Coming Hours/Days.
* Keep Your Eyes Close On Your Trading Positions.
* Happy PIP Hunting Traders.
FXKILLA.

BTC Pullback: Buying 50-78.6% Discount LevelsAfter the aggressive internal liquidity grab on December 1st, which subsequently manifested as a Daily Bullish Order Block , Bitcoin continued its local bullish structure from the global 78.6% level, which I analyzed in my global overview: Bitcoin: The ATH Was a Trap. Here's the Real Roadmap.
Currently, the asset is correcting on the 4H structure and has reached the top of the Order Block. However, to obtain a better Risk/Reward (RR) in the trade and for general entry feasibility, I always wait for a more favorable price in the Discount Zone , which is located below the 50% Fib level.
No one can know exactly how deep Smart Money needs to return the asset into the manipulation zone to close losing positions used to execute this aggressive liquidity grab. Therefore, I will consider a reversal reaction from each level: 50%, 61.8%, and 78.6% .
✅ Entry Conditions:
The condition for entry will be reaching one of these levels, price finding acceptance above it, and the initiation of bullish order flow on a lower timeframe (1m-5m).
❌ Invalidation:
The invalidation of the long scenario will be a break of the local 78.6% level . In that case, the Bitcoin reversal from the global 78.6% level in continuation of the global uptrend will be in question, though still possible, as this is a level from the highest timeframe, and the second monthly candle could also close with its body above this level.
🎯 Target:
The minimum target in case of a long setup formation from the Discount Zone will be the SUPPLY zone . To confirm that the bull cycle is not over and the asset can potentially form a new ATH, it will first have to overcome this resistance zone.
~~~~~~~~~~~~~~~~~~~~~~~~~~~~~~~~~~~~~~~~~~~~~~~~~~~~~~~~~~~~~~~~~
The principles and conditions for forming the manipulation zones I show in this trade idea are detailed in my educational publication, which was chosen by TradingView for the "Editor's Picks" category and received a huge amount of positive feedback from this insightful trading community. To better understand the logic I've used here and the general principles of price movement in most markets from the perspective of institutional capital, I highly recommend checking out this guide if you haven't already. 👇
P.S. This is not a prediction of the exact price direction. It is a description of high-probability setups that become valid only if specific conditions are met when the price reaches the marked POI. If the conditions are not met, the setups are invalid. No setup has a 100% success rate, so if you decide to use this trade idea, always apply a stop-loss and proper risk management. Trade smart.
~~~~~~~~~~~~~~~~~~~~~~~~~~~~~~~~~~~~~~~~~~~~~~~~~~~~~~~~~~~~~~~~~
If you found this analysis helpful, support it with a Boost! 🚀
Have a question or your own view on this idea? Share it in the comments. 💬
► Follow me on TradingView for timely updates on THIS idea (entry, targets & live trade management) and not to miss my next detailed breakdown.
~~~~~~~~~~~~~~~~~~~~~~~~~~~~~~~~~~~~~~~~~~~~~~~~~~~~~~~~~~~~~~~~~

BitcoinBTCUSD
- Bearish Channel as an corrective pattern in Long Time Frame
- Fair Value Gap
- Completed " 123 " Impulsive Waves
- Fibonacci Level - 38.20% / 50.00%
- Bullish Channel in Short Time Frame

Bitcoin at a Crossroads!Downtrend overall
The general trajectory has been lower — lower highs and lower lows over the past several weeks.
🔹 Possible consolidation / base forming
Price has leveled out a bit instead of accelerating down; that can sometimes mean sellers are losing momentum and the market is consolidating.
🔹 Uncertain direction short-term
Because it’s range-bound right now, there isn’t a clear breakout direction yet. Bulls vs bears are in a tug-of-war around this level.
Key Levels to Watch
📌 Support zone: ~~$84,000–$87,000
📌 Resistance zone: ~~$92,000–$96,000
Break above or below those could signal the next big move.

BTCUSD; Heikin Ashi Trade IdeaLast time we had big divergence on MACD and weekly TF, we had big correction...

TESLA TO BTC & TOTALThis analysis compares NASDAQ:TSLA performance relative to BINANCE:BTCUSDT .
As you can see, Tesla’s stock is showing a bullish stance against Bitcoin and appears to be at the beginning of its Elliott Wave 3.
This chart delivers Four key messages:
1.Bitcoin is expected to decline while Tesla moves higher
2.Bitcoin is expected to drop while Tesla moves into a range
3.Both are expected to decline, but Tesla is likely to fall less than Bitcoin
4.Both rise, but Tesla gains more.
I’d be happy if you shared your thoughts.
NASDAQ:TSLA
BINANCE:BTCUSDT
CRYPTOCAP:TOTAL
BINANCE:BTCUSD

Binance Coin - $800 Demand Zone Holds, Watch Weekly The CloseBNB Weekly Reversal Setup: $800 Demand Zone Confirmed, Sunday Close Above $875 Opens Path to $1138
Binance Coin has successfully held a critical demand zone at $800 and is now approaching a pivotal weekly candle close. A Sunday close above $875 would flip the weekly structure bullish and open a clear path to $1138 as the first major target, with potential continuation to previous cycle highs. This analysis breaks down why the $875 weekly close matters and how to approach this setup with spot allocation.
🎯 Setup Overview:
Current Status: $800 demand zone held successfully
Critical Trigger: Sunday weekly close above $875
First Target: $1138 (major resistance zone)
Extended Target: Previous cycle highs
Strategy: Tier 1 spot buy on confirmed weekly close
Position Type: Spot only NO leverage recommended
📊 What's Happening Right Now:
The $800 Demand Zone:
BNB tested and held a massive demand zone at $800 an area where significant buying activity has historically occurred. This level represents:
Previous consolidation support
High-volume accumulation zone
Psychological round number
Multiple prior tests that held as support
The fact that price bounced from $800 rather than breaking through signals strong hands are defending this level.
The Weekly Candle Setup:
BNB is currently forming a weekly candle that could close above $875 on Sunday. This isn't just any level it represents the pivot point between continuation of consolidation versus breakout to higher targets.
Why Sunday's Close Matters:
Weekly closes carry far more weight than daily closes in crypto. They represent sustained positioning across an entire week of trading, filtering out intraday manipulation and noise. A close above $875 would confirm:
Demand zone at $800 was the low
Buyers have control on the weekly timeframe
Structure is shifting from consolidation to expansion
📈 Why $875 Is The Critical Level:
Technical Significance:
$875 sits at the intersection of multiple technical factors:
Weekly resistance that capped prior attempts
50% retracement of recent decline
Breakout level from current consolidation range
Momentum shift threshold on weekly indicators
Structural Flip:
Below $875: Price remains in consolidation, neutral structure
Above $875 (weekly close): Bullish structure confirmed, targets open
Historical Behavior:
BNB has shown respect for weekly closes throughout its history. When it breaks key levels on the weekly timeframe and holds them through the Sunday close, sustained moves typically follow.
🎯 The Target Structure:
First Target: $1138
Represents next major resistance zone
~30% upside from $875 trigger level
Previous consolidation area that will attract profit-taking
Logical zone for first position reduction
Extended Target: Previous Cycle Highs
If $1138 breaks cleanly, path opens to prior all-time high zones
~50-60% additional upside potential from $1138
Requires sustained bullish momentum and favorable crypto market conditions
Final target for remaining position
Why These Levels:
Based on:
Historical support/resistance zones
Volume profile analysis showing concentration at these prices
Fibonacci extension projections
Previous cycle behavior patterns
🛡️ The Tier 1 Spot Buy Strategy:
What Is a "Tier 1" Buy:
This represents a high-conviction allocation one of your primary positions rather than a small speculative bet. Tier 1 positions get larger capital allocation because they meet multiple criteria:
Strong technical structure (demand zone held)
Clear trigger (weekly close above $875)
Defined risk (invalidation below $800)
Favorable reward (30%+ to first target)
The Sunday Close Rule:
Entry trigger: Sunday weekly candle close above $875
If BNB closes at $876+ on Sunday: Execute spot buy
If BNB closes at $874 on Sunday: No entry, wait for next opportunity
This removes emotion—the market either triggers the setup or it doesn't
Why This Discipline Matters:
Entering before the weekly close risks buying a level that fails. Entering after confirmation means you might pay $5-10 more, but you have objective validation that the structure has flipped. This is the difference between gambling and strategic positioning.
⚠️ Why SPOT ONLY - NO LEVERAGE:
Crypto Volatility Is Extreme:
BNB can drop 15-20% in a single day even during bull markets. Leverage amplifies this into account-ending losses. Spot positions can weather volatility; leveraged positions cannot.
Weekly Timeframe = Long Hold:
From $875 to $1138 could take weeks or months. Leverage costs accumulate, and funding rates can erode position value even if directionally correct.
Sleep-at-Night Capital:
Spot allocation allows you to hold through inevitable pullbacks without liquidation risk. If BNB dips to $850 after entry at $880, spot holders are fine—leveraged traders are liquidated.
Preservation Over Greed:
The target offers 30-50%+ gains on spot. That's excellent risk-adjusted return without needing leverage multiplication. Protecting capital always supersedes maximizing gains.
📊 Technical Confluence:
Demand Zone at $800:
High-volume accumulation zone that has held multiple tests. This level represents where institutional and whale accumulation likely occurred.
Weekly Structure:
Higher lows forming on the weekly chart. A close above $875 would establish a higher high, confirming uptrend structure.
Momentum Indicators:
Weekly momentum oscillators (RSI, MACD) are turning bullish. A close above $875 would confirm the momentum shift.
Volume Behavior:
The bounce from $800 occurred with increasing volume, suggesting accumulation rather than dead-cat bounce behavior.
🧠 Trader Psychology: Why Most Will Miss This:
Waiting for "Better" Prices:
Many will wait for a pullback to $850 after the $875 break. By then, momentum has shifted and risk/reward has compressed. The best entry is at the trigger, not after confirmation proves correct.
Fear of Being Early:
What if Sunday closes at $873? Then you don't enter—simple. But fear of "what if it fails" prevents traders from having a plan for "what if it works."
Wanting Certainty:
No setup is guaranteed. But a weekly close above $875 after holding $800 demand offers high-probability structure. Waiting for 100% certainty means waiting forever.
Leverage Temptation:
"If I use 3x leverage, I can make 90% instead of 30%!" This thinking blows up accounts. The patient spot holder survives to compound gains over time.
📈 Why BNB for Spot Portfolio:
Utility and Ecosystem:
Native token of Binance, the world's largest crypto exchange
Used for trading fee discounts (real utility, not speculation)
Powers Binance Smart Chain (BSC) ecosystem
Regular token burns reduce supply over time
Market Position:
BNB consistently ranks in top 5 cryptocurrencies by market cap. Established network effects and institutional recognition provide relative stability compared to smaller-cap alts.
Exchange Token Premium:
During bull markets, exchange tokens often outperform as trading activity increases. More volume = more BNB usage for fees = increased demand.
Risk Factors:
Centralization concerns (Binance-controlled)
Regulatory scrutiny of Binance exchange
Price correlates heavily with Binance's business success
Broader crypto market conditions affect all assets
📅 Timeframe and Expectations:
Entry Timing:
Decision point: Sunday's weekly candle close. No entry before confirmation, regardless of how price behaves during the week.
Target Timeline:
$1138 could take 4-8 weeks if momentum sustains
Previous highs could take 3-6 months if bullish cycle continues
This is a position trade, not a swing trade
Volatility Tolerance:
Expect 10-15% pullbacks even if the setup works. Spot positions can hold through these; it's why leverage is inappropriate for this timeframe.
🏆 Professional Position Management:
Entry Execution:
Wait for Sunday close above $875 (no guessing, no front-running)
Execute spot buy Monday morning
Stop loss below $800 (demand zone invalidation)
Position Sizing:
Tier 1 allocation: 3-5% of portfolio for high-conviction crypto position
Size according to distance to stop ($875 entry - $800 stop = $75 risk)
Calculate position size so $75/coin = 1-2% total portfolio risk
Profit Taking:
First reduction (1/3): $1138 target hit
Second reduction (1/3): $1300-1400 if momentum continues
Final position (1/3): Previous highs or trailing stop
This staged exit removes emotion and locks gains progressively.
📊 Risk Management Framework:
Stop Loss Placement:
Below $800 demand zone. If this level breaks on a weekly close, the bullish thesis is invalidated and the position must be exited.
Risk Per Position:
Entry at $875, stop at $800 = $75 risk per coin
If you can tolerate $1000 portfolio risk, buy ~13 BNB ($875 × 13 = $11,375 position)
If BNB hits stop at $800, loss = $75 × 13 = $975 (acceptable risk)
Reward Calculation:
To $1138: $263 gain per coin × 13 coins = $3,419 profit (3.4:1 reward/risk)
To $1400: $525 gain per coin × 13 coins = $6,825 profit (6.8:1 reward/risk)
This is why leverage isn't needed—spot returns are excellent with defined risk.
⚠️ What Could Go Wrong:
Sunday Close Below $875:
Setup doesn't trigger. No entry, no risk, wait for next opportunity. This is a feature, not a bug.
False Breakout:
Weekly close above $875 but fails the following week. Stop loss at $800 protects capital with controlled loss.
Broader Crypto Weakness:
If Bitcoin or Ethereum enter bearish trends, BNB will likely follow regardless of its individual structure.
Binance-Specific Events:
Regulatory actions against Binance exchange, leadership changes, or business disruptions could cause rapid price declines.
Demand Zone Break:
If price closes below $800 on weekly basis, the entire bullish thesis fails and position should be exited immediately.
📌 Key Takeaways:
✅ $800 demand zone held: Multiple tests defended successfully—strong hands accumulating.
✅ Sunday close above $875 is the trigger: Objective, emotion-free entry rule. Market either confirms or doesn't.
✅ $1138 first target offers 30% upside: Favorable reward with defined $75 risk to $800 stop.
✅ Tier 1 allocation appropriate: High-conviction setup deserves meaningful position size with proper risk management.
✅ SPOT ONLY absolutely no leverage: Volatility, timeframe, and risk management all dictate spot allocation for this setup.
⚠️ Important Disclaimers:
This analysis is for educational purposes and reflects a technical view based on demand zones, weekly timeframe structure, and risk/reward analysis. It is not financial advice or a recommendation to buy or sell BNB or any cryptocurrency.
Cryptocurrencies are highly speculative and volatile. BNB can decline 20-30% even if the weekly close trigger occurs. The $800 demand zone could fail, invalidating the entire setup.
Binance Coin carries specific risks related to Binance exchange operations, regulatory scrutiny, and centralization concerns. Position sizing must account for these crypto-specific and platform-specific risks.
The Sunday close rule is a disciplined approach, not a guarantee of success. Market conditions can change rapidly, and technical setups can fail even with proper structure.
Only invest capital you can afford to lose completely. Crypto allocation should represent high-risk portion of a diversified portfolio. Never use leverage on volatile assets unless you fully understand and accept the risk of total loss.
Always conduct independent research and consider consulting a financial professional. All cryptocurrency investing involves substantial risk of loss.
✨ Sunday Decision Point:
Will BNB close above $875 this Sunday? If so, are you prepared with your spot buy plan? Share your thoughts on the setup in the comments.
📜 Wait for structure. Execute with discipline. Spot only.

BTC/USD drops 3.5% - key levels to watchJust when everything look calm again, cryptos have taken a beating again today and consequently US indices have come off earlier highs. Bitcoin hit resistance around $94K, which was a prior support level, and today it has broken below interim support around $91K, trigger stops from dip buyers. As before, key support comes in at $85.3K, but if that fails to hold this time, then $80K could be the next targets. on the upside, $91K is the most important level for the next days or two, and if that level is reclaimed then $94K is the next reference point to watch.
By Fawad Razaqzada, market analyst with FOREX.com
