BTC/USDT – Bitcoin 1 hour timeframe 📊 Technical Overview
🟢 Support Zone:
📌 Around $105,700
🛡 Marked by multiple bounces (white arrows), this zone shows strong buyer interest.
🔁 Historically acts as a springboard for upside moves 📈.
🔴 Resistance Zone:
📌 Range: $109,000 – $111,500
🚫 Every approach has triggered a sharp sell-off (black arrows), confirming this zone as significant supply.
🔄 Price Action & Pattern Insights
📉 Bearish Swings from Resistance:
Several high-wick candles followed by strong rejections ⛔
Downward arrows suggest a distribution phase near the top range
📈 Bullish Reversal Signals:
Price sharply rebounds from support 💥
V-shaped recovery setup in motion with a clean reaction from the demand zone ✅
Arrow projection hints at a potential full range recovery 🌈
📦 Box Range Formation:
Market has been consolidating in horizontal zones
Each zone acts as a base for accumulation or distribution 🧭
🎯 Trade Idea & Forecast
📍 Current Price: $105,793.35
📈 Projected Move: Upside rally toward $111,000+
🧠 Rationale:
Bounce from a major support zone
Prior similar price actions led to parabolic rises 🚀
No lower lows made – signs of a bottom forming 🪙
📌 Action Plan
✅ Long Setup:
Entry: Above $106,000
Target: $109,000 – $111,500
Stop Loss: Below $105,000
📉 Risk/Reward: Favorable (~1:3)
🚫 Bearish Alternative:
Breakdown below $105,000 with volume ❗
Target: $103,000 (next liquidity zone)
📎 Conclusion: Ready for a Bullish Comeback?
Bitcoin (BTC/USDT) is showing signs of a textbook bullish reversal 📘 after defending a key demand level 💪. If the current momentum holds, we could see a swift move back to the top of the range. Ideal for short-term buyers looking to ride the intraday wave 🌊.
Cryptos

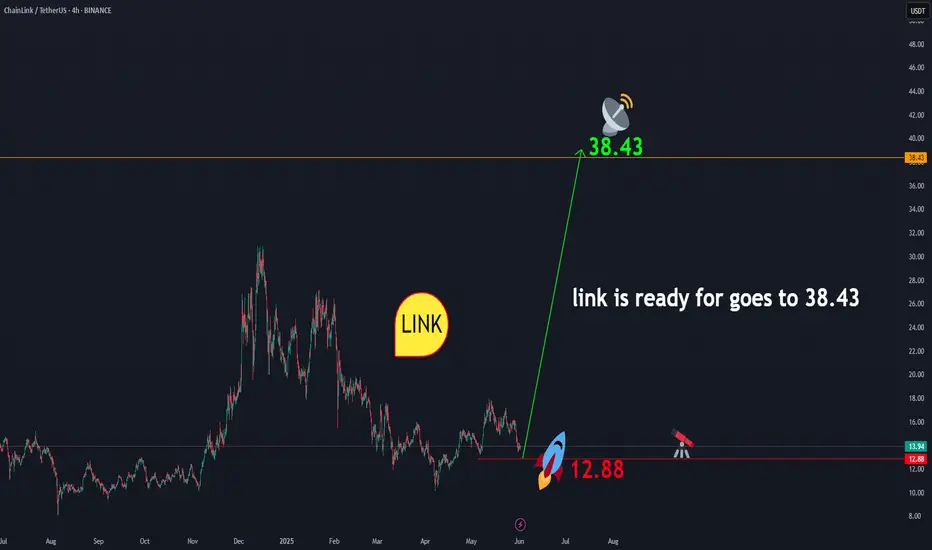
linkusdtLINK is showing readiness to initiate an upward movement towards $38.43. From the current price range of $13.93, a correction down to the $12 area is possible. This zone presents a favorable opportunity for long-term investment . In any case, according to the geometry that has formed in LINK, the price level of $38.43 is expected to be achieved. And this is certain.
BINANCE:LINKUSDT
Breakdown Alert: Crypto Market Cap Tests Major Demand ZoneThe total crypto market cap is testing a key support zone around $3.23T. This area has acted as a demand zone in the past, and now price is hovering right above it.
The current structure suggests a possible breakdown–retest–continuation setup. If price retests this zone from below and fails to reclaim it, further downside toward $3.0T could be likely.
This idea is based on price action and structure only — no indicators used.
❗ This is a personal analysis for educational purposes only. Not financial advice.
Feel free to share your thoughts or technical perspective in the comments

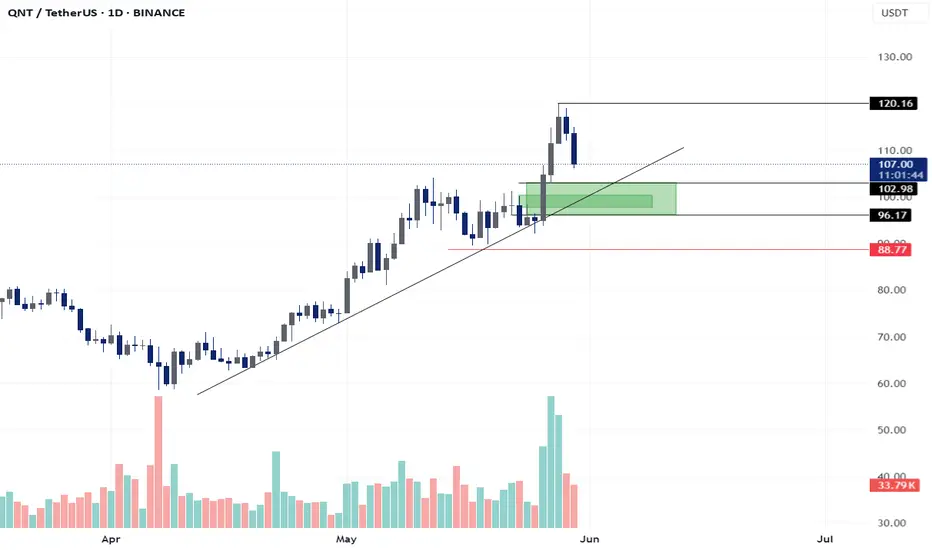
QNT - FVG Long Set-UPBINANCE:QNTUSDT
🔍 𝐊𝐞𝐲 𝐙𝐨𝐧𝐞𝐬:
Support Zone (Demand): $96.17–$102.98 (green box)
Former resistance turned support.
Aligns with ascending trendline – a critical confluence zone.
𝐒𝐭𝐨𝐩-𝐋𝐨𝐬𝐬 𝐋𝐞𝐯𝐞𝐥: $88.77
Below structural low and invalidation of bullish thesis.
Target Zone (Resistance): $120.16
Previous local high and psychological round numbe
#XRP MARKET STRUCTURE | DAILY OUTLOOK | MAY 2025📊 *XRP - Strong Support & Breakout Watch | Daily Timeframe*
XRP is currently holding above a major support zone around the 102B market cap level. Price has shown multiple rejections from this zone, indicating strong buying interest.
🔹 *Key Levels:*
- *Support Zone:* 102B (Strong Demand Area)
- *Resistance Zone:* 147B (Breakout Level)
📈 *Market Structure:*
Price is forming a potential accumulation pattern. If this structure holds, we might see a bullish reversal towards the resistance, followed by a possible breakout.
📌 *Bullish Scenario:*
- Bounce from support
- Retest of previous high
- Breakout above resistance
📌 *Invalidation:*
- If price closes below 102B support zone, setup may fail and a deeper drop could follow.
🧠 *Note:* This is not financial advice. Always do your own analysis before trading.
#XRP #CryptoAnalysis #TechnicalAnalysis #Breakout #SupportResistance

XRUSD Price Market Trend Day TF Long Term BUYXRPUSD is trading at 2.33674, with a strong recommendation to buy for long-term gains. The chart indicates a potential upward trajectory, with price targets set at:
TP1: 2.44200 (Near-term resistance)
TP2: 3.00500 (Mid-term target)
TP3: 3.40000 (Long-term bullish goal)
The mention of 3.40000 at the top of the chart suggests this is a psychological resistance level, reinforcing the optimistic outlook if bullish momentum sustains.

SOLUSD Trend Analysis DAY TF BUY The provided chart and analysis outline a bullish outlook for SOL/USD (Solana against the US Dollar) as of May 26, 2025. The current price is noted at **177.71**,
with a strong recommendation to look for long/buy entries, particularly on dips. The analysis emphasizes long-term holding for optimal results, with three key profit targets: **TP1: 194.00, TP2: 227.00, and TP3: 252.00**.
**Key Observations from the Chart**
1. **Long-Term Bullish Trend**: The analysis highlights that Solana’s long-run trajectory has significant upside potential. The suggested strategy involves accumulating positions gradually, especially during price retracements, to maximize gains over time.
2. **Green Zone as Critical Support**: The chart indicates a "green zone," which acts as a crucial support area. If the price crosses below this zone and closes a candle beneath it, the bullish setup becomes invalid, signaling a potential trend reversal or deeper correction.
3. **Risk Management**: Traders are advised to exercise caution by using smaller quantities on each dip and conducting due diligence before entering trades. This approach minimizes risk while capitalizing on upward momentum.

Pi Network Price Prediction DAY Chart BUY AnalysisThe Pi Network (PI/USDT) is attracting increased attention from crypto traders and long-term investors alike, with growing speculation about its future price potential.
Based on the current technical chart dated May 26, 2025, several critical insights and projections can be drawn for those considering investment in this digital asset.
This analysis reflects personal views and does not constitute financial advice.
At the time of analysis, PI/USDT is trading at **$0.7812**, with visible consolidation just above the key support zone.
The chart displays three major **Take Profit (TP)** targets, reflecting potential bullish momentum in the medium to long term:
TP1: $1.0000
TP2: $1.6700
TP3: $3.0000

₿ Bitcoin Weekly Chart – Is Wave 5 Now in Motion?Bitcoin has found strong support and looks to be powering higher again. Based on Elliott Wave structure, we may now be entering the final leg of this major impulsive wave sequence—Wave 5.
✅ Support Held at a Classic Level
Wave 4 recently pulled back to the 38.2% Fibonacci retracement level of Wave 3—an area that often serves as key support in bullish Elliott Wave trends.
This bounce suggests buying interest remains strong at this level.
📈 Next Target: Wave 5 Projection
If the current structure holds, Wave 5 could aim for the 61.8% Fibonacci extension of Wave 1 + Wave 3, which points to a potential target around $132,669.
This level lines up with the upper boundary of the ascending channel, offering a confluence of resistance.
⚠️ One Caution: The Wave 3 Structure
While the count remains valid, Wave 3 lacks ideal symmetry, and may not exhibit the “right look” that Elliott Wave theory often prefers.
This introduces a slightly lower confidence level, but not enough to invalidate the primary bullish scenario.
🧠 For Beginners:
Elliott Waves are patterns of market behavior. A full trend typically moves in five waves, with Wave 5 often being the final push before a larger correction. Fibonacci levels help us project where waves may end based on the size of prior moves.
📌 Summary:
Wave 4 found strong support at 38.2%.
Wave 5 may now be in progress, targeting $132,669.
Keep an eye on price action near the top of the channel to gauge momentum and potential exhaustion.
If Bitcoin can maintain its trajectory, we may soon test the highs projected by this wave count.

BItcoin; Heikin Ashi Trade IdeaCOINBASE:BTCUSD
Picture tells more than 1000 words!
Thank you for checking out!

solusdt will go to towards 320$solusdt BINANCE:SOLUSDT will go towards $320
In the current area, a downward correction to $150.5 is possible, but ultimately the final destination is $320,
Market geometry doesn't lie.
$320 is an index for this symbol.

Bitcoin (BTC/USD) Timeframe: 4-HourCurrent Price: ~$108,120
Key Chart Elements:
🔹 BOS (Break of Structure):
Multiple BOS markers indicate continuation of bullish structure from late April onward.
Recent BOS near $107,000 confirms bullish momentum is active again after a brief consolidation.
🔹 CHoCH (Change of Character):
Initial CHoCH around $104,000 signals a trend reversal from previous downtrend to bullish structure.
Later CHoCH further confirms buyers taking control.
🔹 FVG (Fair Value Gaps):
Multiple FVG zones are marked below price (between ~$93,000 to ~$106,000).
These represent areas where price moved impulsively, possibly returning to fill gaps.
The most recent FVG (between ~$107,244 and ~$105,518) acted as a support zone on the current retracement.
🔹 Fibonacci Retracement:
Price bounced off between the 0.5 and 0.618 fib levels (~$107,000–$106,387), a typical reversal zone in a strong trend.
Current Setup & Projection:
Price has broken above resistance near $108,000, suggesting a bullish continuation.
Target zone projected at $113,634, supported by structure and volume breakout.
Strong bullish momentum is visible after the BOS, and the price retest of FVG confirms smart money accumulation.
Volume Analysis:
Noticeable volume spike with the most recent bullish breakout, supporting the continuation case.
No large bearish volume indicating supply absorption—bulls remain in control.
Summary:
Bitcoin has completed a successful breakout from consolidation with bullish confirmation through BOS, FVG support, and volume spike. As long as price holds above $107,000–$106,200, the target zone around $113,634 remains highly probable.

5-20-25 WARNING : Bitcoin Sets Up MASSIVE Double-Top WarningI highlighted this incredible price/technical pattern in my morning Plan Your Trade video. But, I thought it was important enough to create a separate video highlighting this incredible Double-Top warning and to try to tell all of my followers to start actively protecting capital over the next 2-3+ weeks.
As much as I would like to say this won't happen (meaning some type of crisis event or global financial crisis) causing a collapse in Bitcoin (and the US/Global markets) - but I believe the continued constraints on the global markets, related to Trump's policies and attempts to reduce US govt spending) will act as a devaluation event for global economies.
Think about it for a minute...
1. If the US is able to remove $500-900 Billion in fraud/waste/NGO spending (of which, a portion of that spending is dedicated to supporting global initiatives/spending), this will result in a contraction (in some form) for some global economies.
2. If the US is able to negotiate more favorable tariff rates for US goods supplied to the world (where foreign nations reduce or eliminate tariffs on US goods), this will also act as a reduction in economic income for many foreign nations.
3. These combined and continued efforts to restructure the US economy into a strong and more dynamic global economic driver (more fairly balanced in terms of global trade) will come at the expense of breaking away from what has traditionally been untouched.
This breaking of the past, in terms of what nations expected related to US spending and tariffs on US Goods, may represent a 15-25% (or more) contraction in foreign economic activity.
If this disruption from "what was normal" results in the US Fed, or global central banks, taking emergency measures to address short-falls in their economies, this could prompt a series of events that could result in a broad devaluation type of event (very similar to what happened after COVID in 2022-2023).
That event was prompted by the US Fed raising rates trying to stop inflation. This event could be the result of slower/lower economic outputs/expectations related to the changing tariff rates and the reduction in US spending throughout the world. Central Banks and regional governments may attempt to provide some type of capital stimulus to transition through this phase - but I see that as "building a bigger bubble - just waiting to pop".
The smart move for global central banks is to follow the US's lead and start to move towards more austerity/accountability regarding their own economies/spending and attempt to let the devaluation price phase play out.
Either way, time will tell if I'm correct or not.
You have been warned. IMO, you have about 3-6 weeks before BTCUSD potentially tops and may roll into a very strong breakdown phase.
Get Some.
#trading #research #investing #tradingalgos #tradingsignals #cycles #fibonacci #elliotwave #modelingsystems #stocks #bitcoin #btcusd #cryptos #spy #gold #nq #investing #trading #spytrading #spymarket #tradingmarket #stockmarket #silver

THETA Token Is In A Larger Flat CorrectionTheta Token with ticker THETAUSD made a deeper retracement in the last year, but it’s actually still above 2023 lows, so it can still be a larger regular 3-3-5 A-B-C flat correction in play. After recent projected five-wave impulse into wave (C) of a three-wave (A)(B)(C) decline in blue wave B, it can be now on the way back to March 2024 highs for blue wave C, which could be a five-wave impulsive cycle. Currently, it can be still unfolding a lower-degree five-wave impulse into wave (1), so more upside is expected for wave (3), especially if breaks above 1.74 bullish level, just be aware of wave (2) pullback.
Theta Token (THETA) is the native cryptocurrency of the Theta Network, a blockchain-powered platform designed for decentralized video streaming and content delivery. It aims to improve the efficiency and cost of streaming by allowing users to share bandwidth and computing resources on a peer-to-peer basis.

BTCUSD; Heikin Ashi IdeaBINANCE:BTCUSD
Possible continuation at marked area, or we will have a correction to lower daily demand area where impulsive move started.

Bitcoin Is Final Stages Of A Bullish CycleBitcoin is still bullish and the rise looks impulsive on the monthly chart, but cyclically, we are in the late stages of a 3-year bull run that can end this year, ideally around October 2025. There’s actually still about 5 months of a bullish trend to complete 35 monthly bars, like in previous bullish cycles, so we may easily see more gains this year from a technical perspective.
Next year we should be aware of a bear market that can last at least 12 monthly bars or one year.

FXAN & Heikin Ashi Trade IdeaBINANCE:ETHUSD
In this video, I’ll be sharing my analysis of ETHUSD, using FXAN's proprietary algo indicators with my unique Heikin Ashi strategy. I’ll walk you through the reasoning behind my trade setup and highlight key areas where I’m anticipating potential opportunities.
I’m always happy to receive any feedback.
Like, share and comment! ❤️
Thank you for watching my videos! 🙏

SUIUSDT; Heikin Ashi trade ideaBYBIT:SUIUSDT
Simple explanation on the chart. For any additional info's, you can let me know in the comments.
Thank you

IOTA Could Be On The Way Back To December 2024 HighsIOTA with ticker IOTUSD made sharp and impulsive rally at the end of 2024, which we see it as a first leg (A)(1) of a bigger recovery in minimum three waves (A)(1)-(B)(2)-(C)(3). Since the beginning of 2025, Crypto market slowed down and IOTA made a deep retracement, but in three legs ABC with an ending diagonal/wedge pattern into wave C, which indicates for a correction in wave (B)(2).
Well, it nicely bounced recently, making a clean five-wave impulse away from projected 78,6% Fibonacci support and back above channel resistance line, so it can be wave 1 of a new five-wave bullish cycle within higher degree wave (C) or (3). That said, after current pullback in wave 2, be aware of more gains for wave 3 of a five-wave bullish cycle that can send the price back to December 2024 highs this year.

Stock Markets Recover Amid Inflation SlowdownAfter months of instability and concerns about high inflation, stock markets have started showing signs of recovery. The slowdown in consumer price growth has become a positive signal for investors who are cautiously but confidently returning to the market. At Nebulain, we closely monitor macroeconomic trends and note that the current rebound is not just a temporary break, but potentially the start of a new investment cycle.
Inflation Slows — Markets Respond
According to the latest data, inflation rates in key economies, including the U.S. and the EU, have begun to decline. Central banks, while remaining cautious, are softening their rhetoric and in some cases even pausing further interest rate hikes. This is creating a more favorable environment for businesses, expanding investment opportunities, and contributing to stock growth.
Markets have already responded: indexes such as the S&P 500, NASDAQ, and DAX are showing steady gains, especially in the tech and financial sectors. Investors view the current signals as an indication that the global economy might avoid a deep recession and adapt to the new conditions without losing growth potential.
Nebulain's Perspective: Opportunities Ahead
At Nebulain, we view the current market situation as a window of opportunity. The restoration of investor confidence, increased liquidity, and easing inflationary pressure create an ideal entry point for medium- and long-term investments.
We recommend focusing on the following sectors:
Technology, where the growth of AI, cloud computing, and automation continues to attract capital.
Green energy, supported by both consumer demand and government policy.
Financial services, especially in the areas of digital payments and fintech innovation.
Nebulain’s Investment Approach
Our approach to asset management remains balanced and based on in-depth analytical research. Rather than simply reacting to short-term fluctuations, we build strategies grounded in fundamental analysis and macroeconomic forecasting. With inflation easing and expectations of renewed growth rising, we maintain a diversified portfolio focused on resilience and long-term performance.
Looking Ahead
Stock markets — like the global economy as a whole — are undergoing a period of realignment. The slowdown in inflation is a major indicator, but not the only factor influencing the investment landscape. At Nebulain, we believe that a combination of technological advancement, adaptive central bank policies, and steady demand for capital provides a foundation for sustained growth.
We are ready to help our clients leverage current market trends and build a financial future rooted in reliability, innovation, and strategic vision.

Bitcoin (BTC) Analysis – Will the Rally Continue or Is a CorrectBitcoin is currently trading at $94,500 💰, but statistical studies and mathematical models indicate a potential downward movement 📉 that could push the price toward $93,800, with a strong likelihood of testing the $89,900 zone.
🛡️ Critical Support at $89,000
To maintain the long-term bullish trend, it is crucial that Bitcoin holds above the $89,000 support level. If the price closes below this level for an entire week, it would be a clear negative signal ❌ and could suggest a trend reversal to the downside for a longer period before any renewed upward movement.
✅ When Does the Correction End?
According to statistical studies and mathematical models, the clearest signal that the current correction has ended would be a break above $97,650 followed by three consecutive daily closes above this level 📈.
If this scenario plays out, we could see a strong and rapid surge toward the following targets:
🎯 Target 1: $104,900
🎯 Target 2: $112,900
💡 Investor Advice
If the breakout occurs, it is advisable to take profits 💸 at the mentioned targets and avoid entering new positions until further notice. The market could experience dramatic and swift movements ⚡, so caution is essential.
📢 The analysis will be updated upon reaching these levels to provide a clearer outlook based on price behavior at that time.
Would you like this version formatted for social media, blog post, or perhaps exported as a PDF or presentation slide?

Bitcoin Dominance TO 52% with in 7 to 14 days Bitcoin dominance has recently experienced a significant upward trend, reaching 64.96% on the daily timeframe. This surge highlights Bitcoin’s growing strength 💪 relative to the broader cryptocurrency market. Currently, dominance is approaching a key resistance level at 65.79% 📈, which is considered a potential reversal zone 🔄.
🧠 Technical Overview
A closer look 🔍 at the recent momentum in Bitcoin dominance reveals signs of a maturing uptrend 📶. As the indicator nears historically significant resistance levels, the probability of a downward correction 📉 increases. Based on time-based analysis ⏱, signs of a pullback are expected to emerge within the next 7 to 14 days 📆 from the point of touching or nearing the 65.79% level.
🎯 Potential Correction Targets
If the anticipated reversal materializes, the correction targets are as follows:
First Target: A retracement to the 60% level, which has acted as prior support 🛑 and could temporarily halt further declines.
Second Target (deeper correction): A move down to 52%, a strategic support level 🧱 that could pave the way for altcoins 🚀 to outperform.

Bitcoin surpasses Google: Why BTC rallied to $94,000In April 2025, Bitcoin once again captured the spotlight by breaking above $94,000, reaching a market capitalization of $1.86 trillion. This surge pushed BTC ahead of Alphabet (Google’s parent company), making it the fifth-largest asset in the world.
The impressive rally in Bitcoin this year has been fueled by a combination of macroeconomic factors and developments within the crypto space itself. New financial instruments, political shifts, and technological advancements have made Bitcoin more appealing and accessible to a wide range of investors.
5 key drivers behind Bitcoin’s growth in 2025:
1. Approval of spot Bitcoin ETFs in the U.S.: For the first time, the SEC greenlit spot Bitcoin ETFs, allowing major institutional players to gain exposure through regulated investment products. This triggered a significant inflow of capital into the crypto market.
2. Weakening dollar and stock market declines: As global economic growth slowed and the U.S. dollar lost ground, Bitcoin emerged as a hedge asset — often compared to gold — with investors seeking safer alternatives to traditional markets.
3. Pro-crypto political climate in the U.S.: The new U.S. administration has adopted a supportive stance on crypto, easing regulations and even announcing plans to build national crypto reserves. This strengthened investor confidence across the market.
4. Bitcoin’s growing role as ‘Digital Gold’: The perception of Bitcoin as a long-term store of value continues to rise. More large investors and corporations are now including BTC in their asset diversification strategies.
5. Technological advancements: The rollout of second-layer solutions like the Lightning Network has made Bitcoin transactions faster and cheaper. This has improved real-world usability and expanded the global user base.
In 2025, Bitcoin continues to gain momentum, breaking new records and cementing its role as one of the world’s most important financial assets. The combination of spot ETF approvals, political backing, macroeconomic shifts, and ongoing tech innovation has created fertile ground for its growth. With each passing day, BTC becomes increasingly attractive to both institutional and retail investors — setting the stage for further gains in the coming years.
Still, Bitcoin’s future will depend on how crypto regulations evolve, the pace of technological breakthroughs, and global economic conditions.
