Bitcoin at a Crossroads!Downtrend overall
The general trajectory has been lower — lower highs and lower lows over the past several weeks.
🔹 Possible consolidation / base forming
Price has leveled out a bit instead of accelerating down; that can sometimes mean sellers are losing momentum and the market is consolidating.
🔹 Uncertain direction short-term
Because it’s range-bound right now, there isn’t a clear breakout direction yet. Bulls vs bears are in a tug-of-war around this level.
Key Levels to Watch
📌 Support zone: ~~$84,000–$87,000
📌 Resistance zone: ~~$92,000–$96,000
Break above or below those could signal the next big move.
Cryptos

BTCUSD; Heikin Ashi Trade IdeaLast time we had big divergence on MACD and weekly TF, we had big correction...

TESLA TO BTC & TOTALThis analysis compares NASDAQ:TSLA performance relative to BINANCE:BTCUSDT .
As you can see, Tesla’s stock is showing a bullish stance against Bitcoin and appears to be at the beginning of its Elliott Wave 3.
This chart delivers Four key messages:
1.Bitcoin is expected to decline while Tesla moves higher
2.Bitcoin is expected to drop while Tesla moves into a range
3.Both are expected to decline, but Tesla is likely to fall less than Bitcoin
4.Both rise, but Tesla gains more.
I’d be happy if you shared your thoughts.
NASDAQ:TSLA
BINANCE:BTCUSDT
CRYPTOCAP:TOTAL
BINANCE:BTCUSD

Binance Coin - $800 Demand Zone Holds, Watch Weekly The CloseBNB Weekly Reversal Setup: $800 Demand Zone Confirmed, Sunday Close Above $875 Opens Path to $1138
Binance Coin has successfully held a critical demand zone at $800 and is now approaching a pivotal weekly candle close. A Sunday close above $875 would flip the weekly structure bullish and open a clear path to $1138 as the first major target, with potential continuation to previous cycle highs. This analysis breaks down why the $875 weekly close matters and how to approach this setup with spot allocation.
🎯 Setup Overview:
Current Status: $800 demand zone held successfully
Critical Trigger: Sunday weekly close above $875
First Target: $1138 (major resistance zone)
Extended Target: Previous cycle highs
Strategy: Tier 1 spot buy on confirmed weekly close
Position Type: Spot only NO leverage recommended
📊 What's Happening Right Now:
The $800 Demand Zone:
BNB tested and held a massive demand zone at $800 an area where significant buying activity has historically occurred. This level represents:
Previous consolidation support
High-volume accumulation zone
Psychological round number
Multiple prior tests that held as support
The fact that price bounced from $800 rather than breaking through signals strong hands are defending this level.
The Weekly Candle Setup:
BNB is currently forming a weekly candle that could close above $875 on Sunday. This isn't just any level it represents the pivot point between continuation of consolidation versus breakout to higher targets.
Why Sunday's Close Matters:
Weekly closes carry far more weight than daily closes in crypto. They represent sustained positioning across an entire week of trading, filtering out intraday manipulation and noise. A close above $875 would confirm:
Demand zone at $800 was the low
Buyers have control on the weekly timeframe
Structure is shifting from consolidation to expansion
📈 Why $875 Is The Critical Level:
Technical Significance:
$875 sits at the intersection of multiple technical factors:
Weekly resistance that capped prior attempts
50% retracement of recent decline
Breakout level from current consolidation range
Momentum shift threshold on weekly indicators
Structural Flip:
Below $875: Price remains in consolidation, neutral structure
Above $875 (weekly close): Bullish structure confirmed, targets open
Historical Behavior:
BNB has shown respect for weekly closes throughout its history. When it breaks key levels on the weekly timeframe and holds them through the Sunday close, sustained moves typically follow.
🎯 The Target Structure:
First Target: $1138
Represents next major resistance zone
~30% upside from $875 trigger level
Previous consolidation area that will attract profit-taking
Logical zone for first position reduction
Extended Target: Previous Cycle Highs
If $1138 breaks cleanly, path opens to prior all-time high zones
~50-60% additional upside potential from $1138
Requires sustained bullish momentum and favorable crypto market conditions
Final target for remaining position
Why These Levels:
Based on:
Historical support/resistance zones
Volume profile analysis showing concentration at these prices
Fibonacci extension projections
Previous cycle behavior patterns
🛡️ The Tier 1 Spot Buy Strategy:
What Is a "Tier 1" Buy:
This represents a high-conviction allocation one of your primary positions rather than a small speculative bet. Tier 1 positions get larger capital allocation because they meet multiple criteria:
Strong technical structure (demand zone held)
Clear trigger (weekly close above $875)
Defined risk (invalidation below $800)
Favorable reward (30%+ to first target)
The Sunday Close Rule:
Entry trigger: Sunday weekly candle close above $875
If BNB closes at $876+ on Sunday: Execute spot buy
If BNB closes at $874 on Sunday: No entry, wait for next opportunity
This removes emotion—the market either triggers the setup or it doesn't
Why This Discipline Matters:
Entering before the weekly close risks buying a level that fails. Entering after confirmation means you might pay $5-10 more, but you have objective validation that the structure has flipped. This is the difference between gambling and strategic positioning.
⚠️ Why SPOT ONLY - NO LEVERAGE:
Crypto Volatility Is Extreme:
BNB can drop 15-20% in a single day even during bull markets. Leverage amplifies this into account-ending losses. Spot positions can weather volatility; leveraged positions cannot.
Weekly Timeframe = Long Hold:
From $875 to $1138 could take weeks or months. Leverage costs accumulate, and funding rates can erode position value even if directionally correct.
Sleep-at-Night Capital:
Spot allocation allows you to hold through inevitable pullbacks without liquidation risk. If BNB dips to $850 after entry at $880, spot holders are fine—leveraged traders are liquidated.
Preservation Over Greed:
The target offers 30-50%+ gains on spot. That's excellent risk-adjusted return without needing leverage multiplication. Protecting capital always supersedes maximizing gains.
📊 Technical Confluence:
Demand Zone at $800:
High-volume accumulation zone that has held multiple tests. This level represents where institutional and whale accumulation likely occurred.
Weekly Structure:
Higher lows forming on the weekly chart. A close above $875 would establish a higher high, confirming uptrend structure.
Momentum Indicators:
Weekly momentum oscillators (RSI, MACD) are turning bullish. A close above $875 would confirm the momentum shift.
Volume Behavior:
The bounce from $800 occurred with increasing volume, suggesting accumulation rather than dead-cat bounce behavior.
🧠 Trader Psychology: Why Most Will Miss This:
Waiting for "Better" Prices:
Many will wait for a pullback to $850 after the $875 break. By then, momentum has shifted and risk/reward has compressed. The best entry is at the trigger, not after confirmation proves correct.
Fear of Being Early:
What if Sunday closes at $873? Then you don't enter—simple. But fear of "what if it fails" prevents traders from having a plan for "what if it works."
Wanting Certainty:
No setup is guaranteed. But a weekly close above $875 after holding $800 demand offers high-probability structure. Waiting for 100% certainty means waiting forever.
Leverage Temptation:
"If I use 3x leverage, I can make 90% instead of 30%!" This thinking blows up accounts. The patient spot holder survives to compound gains over time.
📈 Why BNB for Spot Portfolio:
Utility and Ecosystem:
Native token of Binance, the world's largest crypto exchange
Used for trading fee discounts (real utility, not speculation)
Powers Binance Smart Chain (BSC) ecosystem
Regular token burns reduce supply over time
Market Position:
BNB consistently ranks in top 5 cryptocurrencies by market cap. Established network effects and institutional recognition provide relative stability compared to smaller-cap alts.
Exchange Token Premium:
During bull markets, exchange tokens often outperform as trading activity increases. More volume = more BNB usage for fees = increased demand.
Risk Factors:
Centralization concerns (Binance-controlled)
Regulatory scrutiny of Binance exchange
Price correlates heavily with Binance's business success
Broader crypto market conditions affect all assets
📅 Timeframe and Expectations:
Entry Timing:
Decision point: Sunday's weekly candle close. No entry before confirmation, regardless of how price behaves during the week.
Target Timeline:
$1138 could take 4-8 weeks if momentum sustains
Previous highs could take 3-6 months if bullish cycle continues
This is a position trade, not a swing trade
Volatility Tolerance:
Expect 10-15% pullbacks even if the setup works. Spot positions can hold through these; it's why leverage is inappropriate for this timeframe.
🏆 Professional Position Management:
Entry Execution:
Wait for Sunday close above $875 (no guessing, no front-running)
Execute spot buy Monday morning
Stop loss below $800 (demand zone invalidation)
Position Sizing:
Tier 1 allocation: 3-5% of portfolio for high-conviction crypto position
Size according to distance to stop ($875 entry - $800 stop = $75 risk)
Calculate position size so $75/coin = 1-2% total portfolio risk
Profit Taking:
First reduction (1/3): $1138 target hit
Second reduction (1/3): $1300-1400 if momentum continues
Final position (1/3): Previous highs or trailing stop
This staged exit removes emotion and locks gains progressively.
📊 Risk Management Framework:
Stop Loss Placement:
Below $800 demand zone. If this level breaks on a weekly close, the bullish thesis is invalidated and the position must be exited.
Risk Per Position:
Entry at $875, stop at $800 = $75 risk per coin
If you can tolerate $1000 portfolio risk, buy ~13 BNB ($875 × 13 = $11,375 position)
If BNB hits stop at $800, loss = $75 × 13 = $975 (acceptable risk)
Reward Calculation:
To $1138: $263 gain per coin × 13 coins = $3,419 profit (3.4:1 reward/risk)
To $1400: $525 gain per coin × 13 coins = $6,825 profit (6.8:1 reward/risk)
This is why leverage isn't needed—spot returns are excellent with defined risk.
⚠️ What Could Go Wrong:
Sunday Close Below $875:
Setup doesn't trigger. No entry, no risk, wait for next opportunity. This is a feature, not a bug.
False Breakout:
Weekly close above $875 but fails the following week. Stop loss at $800 protects capital with controlled loss.
Broader Crypto Weakness:
If Bitcoin or Ethereum enter bearish trends, BNB will likely follow regardless of its individual structure.
Binance-Specific Events:
Regulatory actions against Binance exchange, leadership changes, or business disruptions could cause rapid price declines.
Demand Zone Break:
If price closes below $800 on weekly basis, the entire bullish thesis fails and position should be exited immediately.
📌 Key Takeaways:
✅ $800 demand zone held: Multiple tests defended successfully—strong hands accumulating.
✅ Sunday close above $875 is the trigger: Objective, emotion-free entry rule. Market either confirms or doesn't.
✅ $1138 first target offers 30% upside: Favorable reward with defined $75 risk to $800 stop.
✅ Tier 1 allocation appropriate: High-conviction setup deserves meaningful position size with proper risk management.
✅ SPOT ONLY absolutely no leverage: Volatility, timeframe, and risk management all dictate spot allocation for this setup.
⚠️ Important Disclaimers:
This analysis is for educational purposes and reflects a technical view based on demand zones, weekly timeframe structure, and risk/reward analysis. It is not financial advice or a recommendation to buy or sell BNB or any cryptocurrency.
Cryptocurrencies are highly speculative and volatile. BNB can decline 20-30% even if the weekly close trigger occurs. The $800 demand zone could fail, invalidating the entire setup.
Binance Coin carries specific risks related to Binance exchange operations, regulatory scrutiny, and centralization concerns. Position sizing must account for these crypto-specific and platform-specific risks.
The Sunday close rule is a disciplined approach, not a guarantee of success. Market conditions can change rapidly, and technical setups can fail even with proper structure.
Only invest capital you can afford to lose completely. Crypto allocation should represent high-risk portion of a diversified portfolio. Never use leverage on volatile assets unless you fully understand and accept the risk of total loss.
Always conduct independent research and consider consulting a financial professional. All cryptocurrency investing involves substantial risk of loss.
✨ Sunday Decision Point:
Will BNB close above $875 this Sunday? If so, are you prepared with your spot buy plan? Share your thoughts on the setup in the comments.
📜 Wait for structure. Execute with discipline. Spot only.

BTC/USD drops 3.5% - key levels to watchJust when everything look calm again, cryptos have taken a beating again today and consequently US indices have come off earlier highs. Bitcoin hit resistance around $94K, which was a prior support level, and today it has broken below interim support around $91K, trigger stops from dip buyers. As before, key support comes in at $85.3K, but if that fails to hold this time, then $80K could be the next targets. on the upside, $91K is the most important level for the next days or two, and if that level is reclaimed then $94K is the next reference point to watch.
By Fawad Razaqzada, market analyst with FOREX.com

EthereumETHUSD
- Falling Wedge as an corrective pattern in Long Time Frame
- Demand Zone
- Order Block
- Completed " 123 " Impulsive Waves
- Fibonacci Level - 38.20% / 50.00%

I've lost my patience with BCHMoB point... (682) I don't have much hope for pump... If the whales decide to buy... all of the above targets are possible and easy.
1. Picture before my patience runs out
2. Picture what I would like before my patience runs out.
P.S.
BCH at $5.500 || market cap $111,00B
BCH at $16.500 || market cap $333,00B

LINK/USD LONG SET UP(Swing Trade)Entry 1 $12.50
Entry 2 $10.00
Stop loss $8.50
Take profit 1- $16.50
(Close 25%)
Take profit 2- $20.50
(Close 50%)
Take profit 3-$24.50
(Close 75%)
Take profit 4-$28.50
(Close 100%)

XYZ(BLOCK) HIGH PROBAIBILITY LONG SETUP SOON!!!🚨 XYZ HIGH PROBABILITY BUY SETUP 🚨
* Here We Can See Clearly The Next Potential Moves For BLOCK Coming Hours/Days.
* Keep Your Eyes Close On Your Trading Positions.
* Happy PIP Hunting Traders.
FXKILLA.

Downside protected, upside unprotected — BTC to 500kThere's a ton of intriguing action unfolding with Bitcoin right now. Several cycle low indicators I track have started firing off around the $80K mark—pretty wild if you ask me. Let's break them down step by step.
1. 2-Week RSI Signal
It's a straightforward fact: the two-week RSI is sitting at 42, a level that has consistently marked cycle lows in the past. So, at $80K, we've got our first major cycle low signal.
2. Fear & Greed Index
Historically, after a cycle top, the first wave down has driven the Fear & Greed Index to a reading of 10 in the last two cycles.
The rest of the time? It's signalled cycle lows or major bottoms ahead of massive rallies.
#### What This Means: History Rhyming (Again)
This setup screams repetition—Bitcoin has now topped out after exactly 1,064 days, mirroring the last two cycles. On this first corrective wave, Fear & Greed has already plunged to 10. But here's where it gets really telling: layer in the Sharpe ratio for some nuance.
As the chart shows, the Sharpe ratio has dipped into negative territory—a rare event that *only* occurs during true cycle lows.
Invalidation & Bear Market Confirmation
The chart makes it crystal clear: Bitcoin is primed to echo the last cycle's playbook, with a full rejection at the 0.382 Fibonacci retracement. In the prior two cycles, after the initial drop from the cycle high, any subsequent rally completely fizzled out right there at 0.382.
If Bitcoin fails to rally and close decisively above that level by mid-January 2026, the odds skyrocket for a full-blown bear market. Keep an eye on it—this could be the pivot that defines the next leg.
What do you think then?
500k or 67k by October 2026?
Still fully on the upside boat. Risk is heavily skewed to the top side, not down

Can crypto catch the rate cut bid?Recently I noticed a falling wedge on an equal-weight crypto basket which can be bullish. However prices resolved sharply lower!
This week is seeing an aggressive increase in Dec Fed rate cut expectations, evidenced by
Bond yields TVC:TNX -- lower
US Dollar fx basket TVC:DXY -- lower
Small cap stocks AMEX:IWM -- higher
The moves haven't all happened in tandem; it looks like bonds were first to price in the rate cut bet. In recent sessions we're starting to see a follow through in Dollar and small cap stock pricing.
Nothing says a rate cut is imminent, but if the market is pricing for that across asset classes, does that make a stronger case for a small ascending triangle in an equal-weight crypto basket?

Crypto might still have gas in the tankAn equal-weight basket of popular cryptos is forming a descending wedge (bullish) on the 4 hour chart.
There's also a very mild uptick in momentum.
I wouldn't take excessive risk here, potentially add on dips to cryptos you have strong conviction on, and don't be surprised if we really are at the end of the cycle.

Bitcoin: The ATH Was a Trap. Here's the Real Roadmap.Since mid-July, Bitcoin has been in a global range. The "breakout" to a new ATH on Oct 5-6, which the majority expected to continue, was actually a liquidity sweep . This has confirmed the global range and a high probability of a high-timeframe correction.
After the sharp drop on the Oct 10 news, a local range has formed. I expect a breakdown from this local range, with the minimum target being a sweep of the Previous Month's Low (PML) .
After that, the plan is to look for long-term long setups at three key global support levels.
SCENARIO 1: 50% Monthly Fib Level
The first major support is the 50% Monthly Fibonacci retracement level . If price reaches this level and also performs a liquidity sweep of the June 22 low , the probability of a long setup will be much higher.
Confirmation: Price must find acceptance above this level, confirmed by Daily or Weekly candle bodies .
Target: Mitigation of the global and local ranges.
SCENARIO 2: 78.6% Monthly Fib + Weekly OB
If the 50% level is broken, the next major support is the 78.6% Monthly Fib level in conjunction with a Weekly Order Block .
Confirmation: The interaction must be analyzed with D1/W1 candles. Acceptance above this level confirms the long setup.
SCENARIO 3: The "Make-or-Break" Level
A break of the 78.6% level opens the door to the April 7 low at $74,500 . The market's reaction to this final level will determine whether the bull cycle has a chance to continue, or if a new bear cycle will begin.
~~~~~~~~~~~~~~~~~~~~~~~~~~~~~~~~~~~~~~~~~~~~~~~~~~~~~~~~~~~~~~~~~
The principles and conditions for forming the manipulation zones I show in this trade idea are detailed in my educational publication, which was chosen by TradingView for the "Editor's Picks" category and received a huge amount of positive feedback from this insightful trading community. To better understand the logic I've used here and the general principles of price movement in most markets from the perspective of institutional capital, I highly recommend checking out this guide if you haven't already. 👇
P.S. This is not a prediction of the exact price direction. It is a description of high-probability setups that become valid only if specific conditions are met when the price reaches the marked POI. If the conditions are not met, the setups are invalid. No setup has a 100% success rate, so if you decide to use this trade idea, always apply a stop-loss and proper risk management. Trade smart.
~~~~~~~~~~~~~~~~~~~~~~~~~~~~~~~~~~~~~~~~~~~~~~~~~~~~~~~~~~~~~~~~~
If you found this analysis helpful, support it with a Boost! 🚀
Have a question or your own view on this idea? Share it in the comments. 💬
► Follow me on TradingView for timely updates on THIS idea (entry, targets & live trade management) and not to miss my next detailed breakdown.
~~~~~~~~~~~~~~~~~~~~~~~~~~~~~~~~~~~~~~~~~~~~~~~~~~~~~~~~~~~~~~~~~

Everyone Gave Up on ETH – Perfect, Disbelief Phase ActivatedThe sentiment in crypto right now is as bad as—if not worse than—during the COVID crash or the FTX collapse. Anyone who was around back then remembers the “this is the end of crypto” vibes. It always feels apocalyptic in these moments, and this time is no exception.
Yet the fear index is hitting lows we haven’t seen since COVID… while Bitcoin is sitting between 80k and 100k. That combination is almost comical. History shows that when despair peaks like this, what feels like the end is usually just the beginning.
The chart above is a bar-pattern fractal on ETH I’ve been tracking privately for nearly a year. The moment I finally published it, price deviated hard—classic lol
Zooming in, here’s my current road map assuming we’re headed into a proper bull market in 2026:
- We just finished Wave 2
- Wave 3 (the longest and strongest) is starting now
→ Top around May 2026 at ~$11,000
→ Wave 4 retraces ~50% of Wave 3, retesting the previous ATH zone
→ Wave 5 takes us to $18,000–$25,000 sometime in Q4 2026 or early 2027
Invalidation level?
In the last two cycles, the real bear market began when price repeatedly rejected and failed to reclaim the 0.5 Fibonacci level. A clean break and hold above that zone has always kept the bull alive.
I’ve also been watching the Russell 2000 as a macro confirmation .
No breakout yet, but notice the deep pullbacks it always has right before the eventual clean break higher. We’re following the exact same script.
Conclusion
Technicals are still noisy and not fully confirmatory, but sentiment is screaming. Capitulation is extreme—90%+ of people have thrown in the towel. My inbox and comment sections are filled with “you’re insane” and “what are you smoking” messages. That level of universal bearishness, combined with the price action we’re seeing, is one of the strongest contrarian buy signals you can get.
When everyone is this convinced it’s over, going against the herd is usually the right play.

Bitcoin at the Edge – What Comes Next?Over the past couple of months, Bitcoin has been navigating a complex mix of macro shifts, liquidity changes, and sector-specific catalysts that, in our opinion, have pushed the market into a critical decision zone. Sentiment has become increasingly divided: long-term structural bulls remain confident, while short- and medium-term flows have turned more cautious.
1. Recent Developments & Market Sentiment
In the past half a year, crypto markets have been influenced by several overlapping narratives. Regulatory tone has eased globally, with more pro-innovation stances emerging in key regions. Political developments—particularly renewed efforts in the U.S. toward clearer crypto frameworks—have added a layer of optimism. Institutional participation has also continued to expand, with ETF flows stabilizing after earlier periods of volatility.
Yet despite these supportive headlines, market behavior has shown hesitation and sold off in the past month. In our opinion, this was driven primarily by the resurfacing of Trump’s aggressive tariff threats, reigniting trade-war fears, a sharp drop in expected Fed rate cuts, and massive institutional ETF outflows plus leveraged liquidations. Sentiment has flipped from extreme greed to extreme fear.
In our view, the inability to sustain acceptance at recent highs points to exhaustion in the prior uptrend. Overall sentiment is less euphoric and more cautious—this current zone would likely be a battleground between long-term accumulation and shorter-term mean reversion.
2. The Underlying Driving Forces
Bitcoin’s medium- and long-term structural drivers remain intact: institutional adoption, the growing integration of digital assets into traditional finance, the post-halving supply dynamics, and Bitcoin’s increasing correlation with broader macro conditions.
Macro factors such as real yields, liquidity conditions, and risk appetite continue to play a major role. As markets position for next year’s rate lowering expectations and potential fiscal shifts, Bitcoin, in our opinion, is behaving more like a liquidity-sensitive asset than a speculative outlier. This is especially apparent in how it has reacted to major economic releases and policy signals. The bottomline is that Bitcoin’s major swings are increasingly tied to macro liquidity flows—the same forces that drive equities, especially high-beta tech.
Market structure is equally important. Bitcoin’s auction process—how price accepts or rejects value—often drives multi-month cycles. When value areas break or hold, the market tends to transition into new regimes. That is exactly where the market appears to be now.
3. Chart Analysis – A True Decision Area
Bitcoin is currently sitting at what we believe is a major inflection point: the 2024 Low-Value Area (LVA), where Bid Block 1 formed in March 2025. This zone acted as the structural base where buyers initiated up to new all-time highs earlier this year.
From July to October 2025, the market attempted to accept near the top of the range, with buyers defending Bid Block 2. By mid-October, however, bid support weakened. Longs unwound, driving price back into Bid Block 1 near 84,600, which is confluent with yearly support and the prior trendline break from November 2024.
Going into the next quarter, Bitcoin sits atop a critical area of demand. In our opinion, how price responds here could determine whether this pullback stabilizes or it becomes a deeper liquidation phase.
Key Levels:
82,000 – 2025 developing low / Bid Block 1 low / 2024 TL breakout
77,000 – 2024 VPOC
Bearish Scenario:
If buyers cannot recover quickly back above 87,700 (2024 VAH), and bids fail to hold the 81,000–77,000 region, the market may open the door to further long liquidation. That could lead to a move through the 2024 Value Area, potentially targeting the 60,000 region (2024 VAL).
Bullish Scenario:
If buyers reject strongly up from the 82,000 area, a move through 94,200 (Bid Block 1 high) could shift control back toward buyers. This may open a path toward 100,000/102,550 (2025 developing VAL / Bid Block 2 low), where sellers could be expected. Acceptance above that could set up a move toward 123,050 (2025 developing VAH) and possibly a revisit of the all-time highs.
Neutral Scenario:
Without any new catalyst, the market may consolidate and form a two-way auction between 99,700 and 82,000 as it digests recent volatility. This could serve as a base for the next directional expansion.
In our view, how Bitcoin behaves around this zone will set the tone heading into 2026. I’d love to hear your views—drop your thoughts in the comments and give this post a boost so others can join the discussion.
This post reflects our personal market views and is for educational discussion only. It should not be interpreted as financial or trading advice. Market conditions can change rapidly, and the levels discussed here may shift as new information emerges. Always conduct your own research and consult a licensed financial professional before making trading decisions.

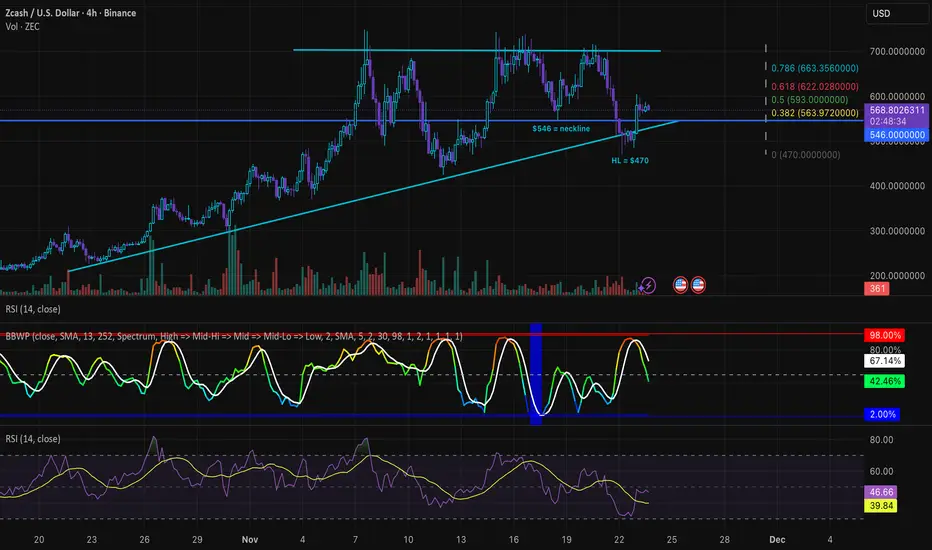
ZEC recovered from ascending triangle downside overshoot but...ZEC price has rebounded after briefly overshooting the lower trendline of the ascending triangle on the 4H and is now consolidating above the $546 level, which marks the neckline of the double top flush. Volatility is resetting following the impulsive down move, while RSI is recovering from oversold.
Resistance established at $605, half-way through the impulse down leg. Volume elevated at trendline reclaim, but lower then during seff-off.
ZEC will likely consolidate in the current zone until BBWP resets to the blue zone before attempting a directional move within the triangle. $560 seems like a good entry for short-term trades with targets near $580–$600 lower-timeframe resistances.
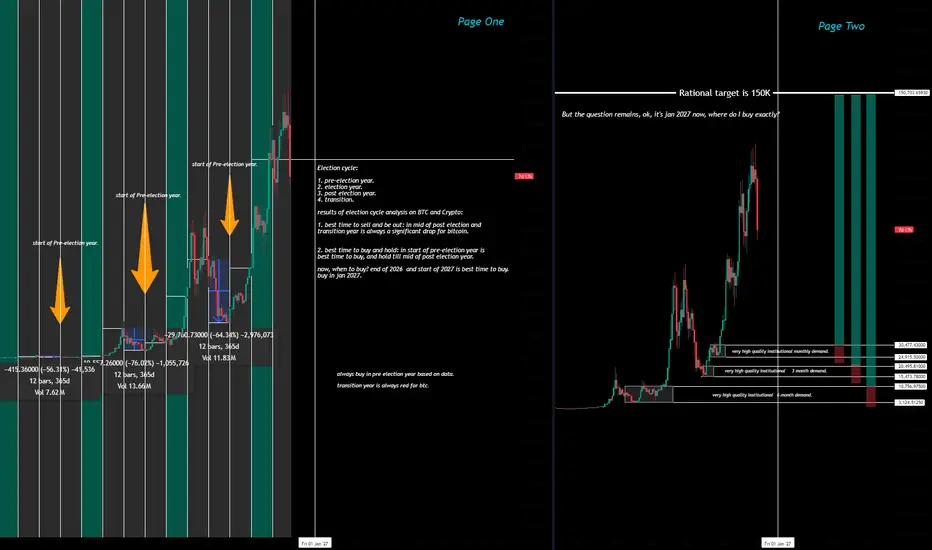
BTC and Crypto analysis based on Presidential Cycle. I've seen a 36% drop in bitcoin, and for the first time in my life as a multi asset trader and investor, I wonder: ok, this seems like a good opportunity, where will price turn, and where will it move to?
when you look for a pattern, you first go with 3 things:
1. presidential cycles.
2. Decennial Market Cycle.
3. Annual and quarterly cycle.
first thing you saw when you analyze the presidential cycle, you see a beautiful pattern that has been repeated 3 times in bitcoin historical data out of 4.
and it is
1. buy in pre-election year, and sell in middle of post-election year.
2. transition year / second year after election is always a profit taking cycle with 30% average drop.
now you know one data of best time to buy.
and it's Jan 2027.
when to sell? you might ask:
1. first option: after the election is done.
2. end of post election year.
3. hold it till the rest of your life.
profit target is 150K, or you can hold it for the rest of your life, because you bought the bottom of all bottoms. (just kidding)
Patiently wait for this opportunity, because it happens once in every 4 year.
Crypto Dhadaam!Bitcoin from Last month and all time high of 121245 has now showing weakness.
As per my analysis bitcoin Should find its Support @ 80000 and from here it should rally till
107000 which is my target.
Buy @ 80000
SL @ 75000
Target 107000
Trade of 1:5
Ting Tong Ting...

BTC: The 50% Level Failed. Is the 61.8% Fib the Next Support?Bitcoin is continuing its corrective fall within the still-globally-bullish structure. Today, it has definitively confirmed the break of the first global 50% Fib level, which I discussed in my main overview: Bitcoin: The ATH Was a Trap. Here's the Real Roadmap.
Price is now approaching the next 61.8% global Fib level , from which a long can be considered if a reversal is confirmed.
The condition for a long setup to form will be price finding acceptance above this level (with D1 candle bodies) upon reaching it, and the beginning of a bullish order flow on a lower timeframe. An additional confluence for this level will be the top of the Weekly FVG .
The invalidation for this long scenario will be acceptance below the level, which would mean it is broken. The next target for price would then be the 78.6% Fib level —a stronger level, as its arrival will be accompanied by the mitigation of a Weekly Order Block .
~~~~~~~~~~~~~~~~~~~~~~~~~~~~~~~~~~~~~~~~~~~~~~~~~~~~~~~~~~~~~~~~~
The principles and conditions for forming the manipulation zones I show in this trade idea are detailed in my educational publication, which was chosen by TradingView for the "Editor's Picks" category and received a huge amount of positive feedback from this insightful trading community. To better understand the logic I've used here and the general principles of price movement in most markets from the perspective of institutional capital, I highly recommend checking out this guide if you haven't already. 👇
P.S. This is not a prediction of the exact price direction. It is a description of high-probability setups that become valid only if specific conditions are met when the price reaches the marked POI. If the conditions are not met, the setups are invalid. No setup has a 100% success rate, so if you decide to use this trade idea, always apply a stop-loss and proper risk management. Trade smart.
~~~~~~~~~~~~~~~~~~~~~~~~~~~~~~~~~~~~~~~~~~~~~~~~~~~~~~~~~~~~~~~~~
If you found this analysis helpful, support it with a Boost! 🚀
Have a question or your own view on this idea? Share it in the comments. 💬
► Follow me on TradingView for timely updates on THIS idea (entry, targets & live trade management) and not to miss my next detailed breakdown.
~~~~~~~~~~~~~~~~~~~~~~~~~~~~~~~~~~~~~~~~~~~~~~~~~~~~~~~~~~~~~~~~~

DOGEUSD; Heikin Ashi Trade Idea📈 Hey Traders!
Here’s a fresh outlook from my trading desk. If you’ve been following me for a while, you already know my approach:
🧩 I trade Supply & Demand zones using Heikin Ashi chart on the 4H timeframe.
🧠 I keep it mechanical and clean — no messy charts, no guessing games.
❌ No trendlines, no fixed sessions, no patterns, no indicator overload.
❌ No overanalyzing market structure or imbalances.
❌ No scalping, and no need to be glued to the screen.
✅ I trade exclusively with limit orders, so it’s more of a set-and-forget style.
✅ This means more freedom, less screen time, and a focus on quality setups.
✅ Just a simplified, structured plan and a calm mindset.
💬 Let’s Talk:
💡Do you trade supply & demand too ?
💡What’s your go-to timeframe ?
💡Ever tried Heikin Ashi ?
📩 Got questions about my strategy or setup? Drop them below — ask me anything, I’m here to share.
Let’s grow together and keep it simple. 👊

Solana Explosion: Will SOL Hit $183 or Crash Below $100?If SOL breaks above 144.77, next stops are 153.65 and possibly 183 on strong momentum.
But dropping below 130 could trigger a sharp slide toward the $100 zone—watch these levels!

CRYPTO MARKET IN BIG TROUBLE! CRACK!!🔥 Crypto Bros… this is the LAST thing you ever want to see on your chart.
The last time I warned about a MEGAPHONE CRACK back in July 2024, the entire crypto market dropped 31% — and that was while it was still in an uptrend.
This time?
This crack is far, far worse because it’s breaking the entire structure, not just a line.
Breaking a trendline alone is whatever…
But breaking a major structural boundary at this point in the cycle?
You do NOT want to find out whether this is “the real one” or not.
I’m issuing a major WARNING to crypto bulls.
Your whole generation has been trained for 17 straight years to “Buy The Dip.”
That conditioning is a massive disadvantage — and most of you don’t even know it.
And those cute, colorful, meme-filled crypto charts made by 12-year-olds posing as traders?
They aren’t going to save you.
They’re going to massacre your account when the cycle actually breaks.
You had your fun.
Now it’s time to get off the Ferris wheel, step to the sidelines, and actually observe and learn — no matter where price goes from here.
Over $1 trillion has already been wiped out.
Don’t stick around waiting for the other $2 trillion to evaporate with it.
Stay sharp. Stay humble. Stay alive.
Sorry, but it has to be said by somebody!
THANK YOU for getting me to 5,000 followers! 🙏🔥
Let’s keep climbing.
If you enjoy the work:
👉 Boost
👉 Follow
👉 Drop a solid comment
Let’s push it to 6,000 and keep building a community grounded in truth, not hype.

Ethereum 1st Spot Buy Target has been reachedMarkets like to reverse at low volume nodes or fair value gaps, so as you can see, we have reached one of the lowest volume areas of this year so this can act as my personal buy target for Ethereum.
2nd and 3rd are noted as well.
Wish you all the best trading.
