Riding the Crypto TOTAL Market Cap WavesHey stars ✨ — just popping in with a little dose of chart magic and market wisdom 🌙💫
I’ve been watching the TOTAL Crypto Market Cap chart (yes, the big picture one!) and something beautiful is forming — a rising channel pattern on the weekly timeframe. It’s like the market is climbing a staircase of light, pausing to recharge, and then glowing higher again.
Here’s what I’m seeing:
The channel support has held strong three times already 🌟 — each bounce confirming that this trend still has confidence and flow behind it.
Every time price touches the top of the channel, we tend to see a pause or small correction.
So, the rhythm is:
🌟 Buy near support.
🌟 Take some profits near resistance.
It’s simple, elegant, and works beautifully when the market respects structure.
But… we never want to get too comfy in a single scenario 👀✨
Because when a channel finally breaks, it can go either way:
A break above the channel often signals acceleration — and that’s when we wait for a retest of the breakout to go long again 🚀
A break below means the trend is losing its shine — and we can prepare to short or hedge after the breakdown retest ⚡
So, whether you’re team bull or bear, keep your eyes on that linework. The market always gives a little whisper before the next move… if you’re calm enough to listen 🌌
Let’s trade smart, stay kind to ourselves, and remember — good energy attracts good setups ✨💫
Cryptos

BTC/USDT — New Volume Entry Zone Forming - 117KBTC/USDT — New Volume Entry Zone Forming 💥
Bitcoin is stabilizing above the pre-cycle range and building new volume around the $115K zone.
This could mark the next accumulation area before continuation if support holds here.
📊 Key Range: $115K–$116K
📈 Focus: Maintaining this new volume base for further upside to 117K

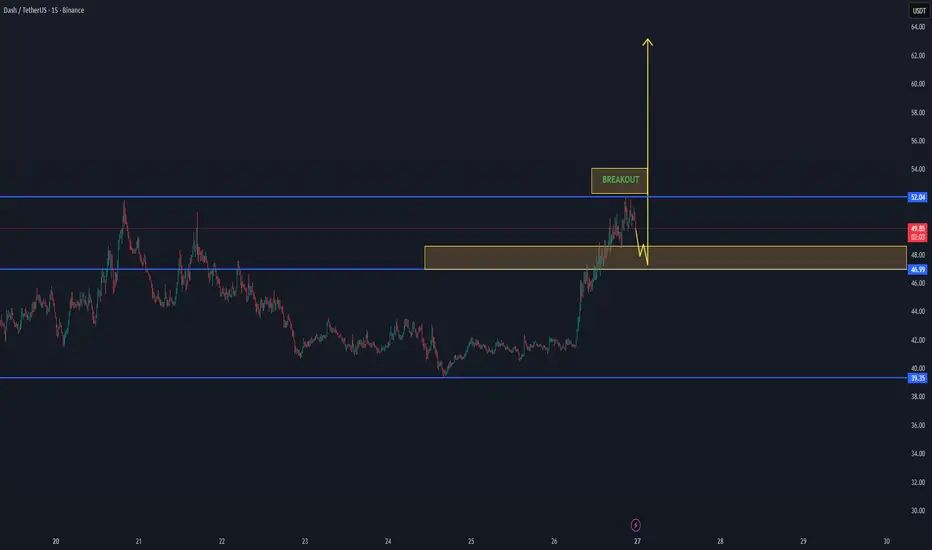
DASH/USDT Market Update – Breakout Tested, Pullback ExpectedDASH/USDT recently confirmed a breakout above the previous resistance zone near 46.9–47.0 USDT, showing strong upside momentum.
However, after this breakout move, the market is currently cooling down, suggesting a potential pullback retest before continuation.
The key support zone sits around 46–47 USDT — holding this level would confirm healthy consolidation and prepare the structure for a potential next leg up toward the 52–66 USDT range.
If price fails to hold the zone, a deeper retracement toward 39.3 USDT remains possible before another attempt to push higher.
📊 Summary:
Support zone: 46.0 – 47.0 USDT
Resistance target: 52.0 – 66.0 USDT
Structure: Breakout → Retest → Potential continuation
Bias: Bullish, but expecting short-term correction first
🔎 Focus: Watching for retest confirmation and buy pressure re-entry around the support range before any renewed upside.
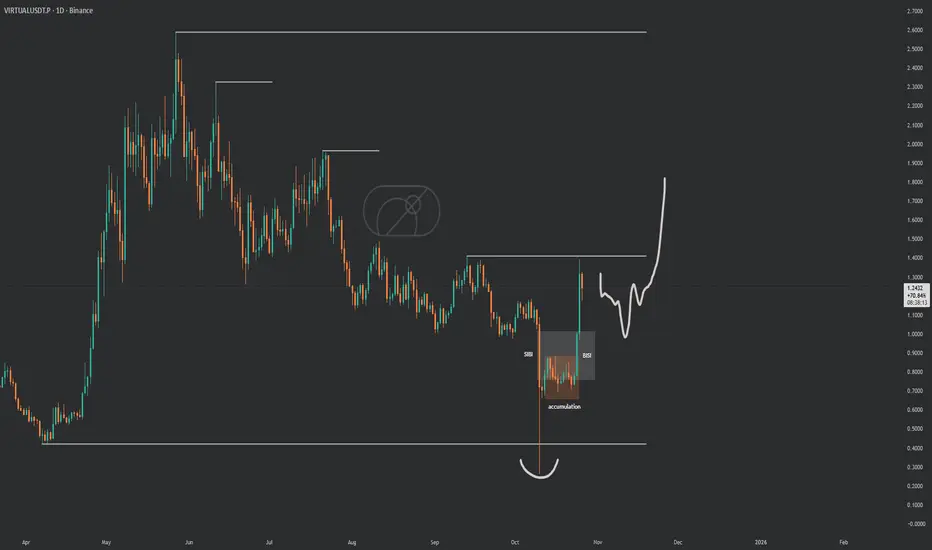
$VIRTUAL got that clean range clean price actionSPARKS:VIRTUAL got that clean range clean price action straight textbook accumulation. Lot of coins looking just like this, coiling up for the first real upside blast !If it dips to hand us $1, that's the golden entry.
new month watch list : SEED_WANDERIN_JIMZIP900:ASTER AMEX:XPL SPARKS:VIRTUAL
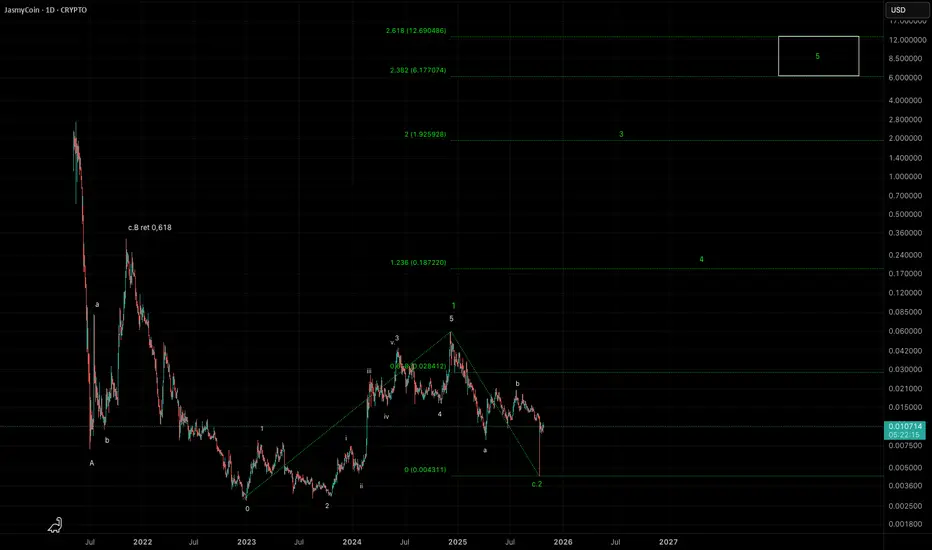
JASMY Waves 1 and 2 in place. Powerful 3rd wave up nextEverywhere we look at, JASMY has a textbook structure. First of all an ABC correction to bottom, then a beautiful wave 1, next a perfect wave 2. The chart shows a potential wave 3 in the making.
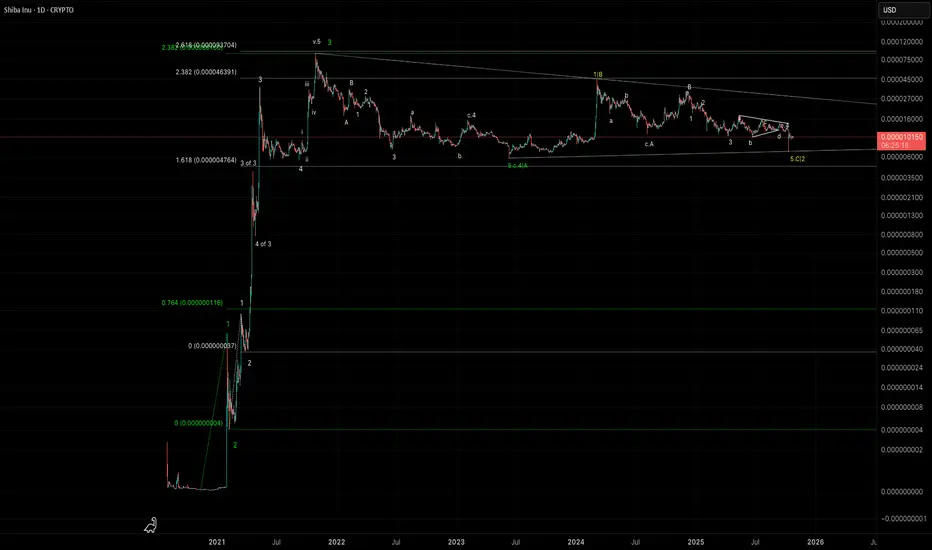
SHIBA INU, Why it needs One more highThis is my all-time elliott wave structure for SHIBA INU, and the reason why i think it needs one more high to complete 5 waves since it's creation. The structure shows how SHIBA has hit extension 2,382 to end wave 3. If we look at the internal structure —12345 white— we can see 5 waves of internal wave 3 hitting exactly the 2,618 extension. So, we have a nice confluence of 2,618 extension corresponding to all of wave 3 and 2,382 extension. SHIBA is now in a very long wave 4. Either it is a very large triangle where waves d and e are still needed or this correction is almost over. Also we have a classic bull flag. It's just a matter of time before SHIBA decides to go up and complete wave 5 to at least 2,618 extension
ICP @ 9/2023 support. Icp at 9/2023 support. Possible buy zone, if the zone breaks it could go to $1. If the zone holds it could rise dramatically. Trade wisely.

BTC Intraday Trap? Price Spikes, Volume Stalls
🕵️♂️ Observation:
- Price made a sharp spike upward, grabbing attention.
- But behind the scenes, volume told a different story—slow, hesitant, and lacking buyer aggression.
- CVD showed no real pressure from buyers; AO momentum faded quickly after the spike.
- This looks like a classic liquidity grab or engineered move to trap breakout traders.
- No follow-through from buyers = no conviction.
- Price structure remains vulnerable, especially near supply zones or previous POC.

KGEN - LEVEL BY LEVEL - UDPATE:SET:KGEN - update:
Big resistance hit ⚠️ - 0.3580 - 0.3600$.
Possible scenario i'm watching:
Pull back toward 0.2850 - 0.2900$; then leg up toward 0.420$+ 📈
Momentum might remain strong above trend + possible (curve line).
Remember:
70% up from previous call, so don't be greedy!✅💰
Level by level team! 🐸

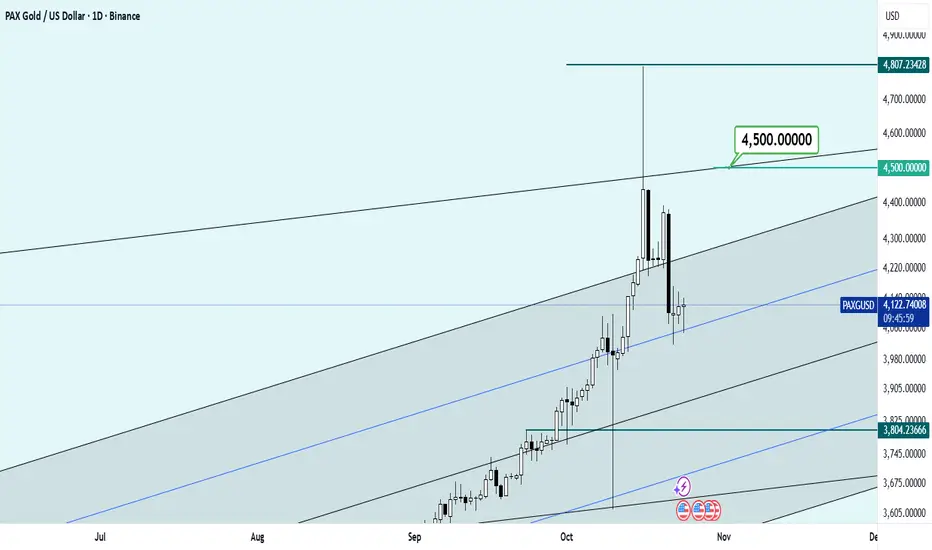
We should test gold with a price target of $4,800!!!This is an empirical test and forward and backtests on the gold chart have confirmed this to some extent, but the timing of the events remains a vague issue. In the end, I must say that I envision a range of $4,800 for the global gold price!
Good luck...
Everyone Thinks the Cycle Is Over — $300K–$450K Q4 2026Sentiment is mostly bearish with everyone calling the cycle top because 1064 days have passed. It seems everyone has finally cracked the Bitcoin code based on historical data and simple mathematics. Apparently, it has become so easy to time Bitcoin that everyone must be right.
But if you have been around long enough, you know Bitcoin always does the unexpected. When everyone is watching the same pattern and timeframe, the market tends to move in the opposite direction. History has shown this repeatedly, and I believe this time will be no different.
My target remains 300-425k by Q4 2026 with ETH between 25-33k. To understand how I arrived at this timeframe and prediction, check the ETH TA below for context.
The model shown above is the Bitcoin Power Law Corridor model. If you have followed me for a while, you know I normally use another model shown below.
Unfortunately, the BLX Bitcoin chart is no longer being updated and that model only works with that data, so it has to be retired.
Months ago, my take aligned with the Bitcoin cycle ending around this time, but new data has shifted the outlook toward an extended cycle into 2026 or possibly the completion of the standard four-year cycle.
From the chart above, you can see that whenever Bitcoin breaks the center line of the Power Law model, it enters the final phase of the cycle. This cycle has not yet closed a single monthly candle above that line. Historically, once it does, the final move begins and usually lasts about a year. Each move from the center line has been smaller over time, averaging around -48 percent per cycle, implying a potential 130-145 percent move this time, which aligns with a 300k Bitcoin target.
RSI currently sits at 67.
$111,191.670 — Mayer Multiple 1.03
Mayer is at 1.03, yet I am supposed to believe the herd that the cycle top is already in. It would be wild to top out with such a low count.
No Pi cycle cross.
Until we break and close a weekly candle inside the Gaussian channel, I will say the run is not over. In the last cycle, we touched it twice before falling in on the third attempt. Perhaps the same happens again and it marks the top, but this analysis will only be invalidated if we get that close inside. Until then, there is no reason to worry.

The future of Bitcoin can be found in this channel This channel is simple and will tell us the short-term... and maybe even long-term direction.
The 1.414 FIB is having an obvious impact.
If it falls below this yellow uptrending channel, then the $70k re-test is likely.
Below that, we're talking $50k and $30k.
After $30k... I don't care!
Above its current all-time high, $170k and $220k. It could do that within this yellow channel.
Just follow the lines ;)

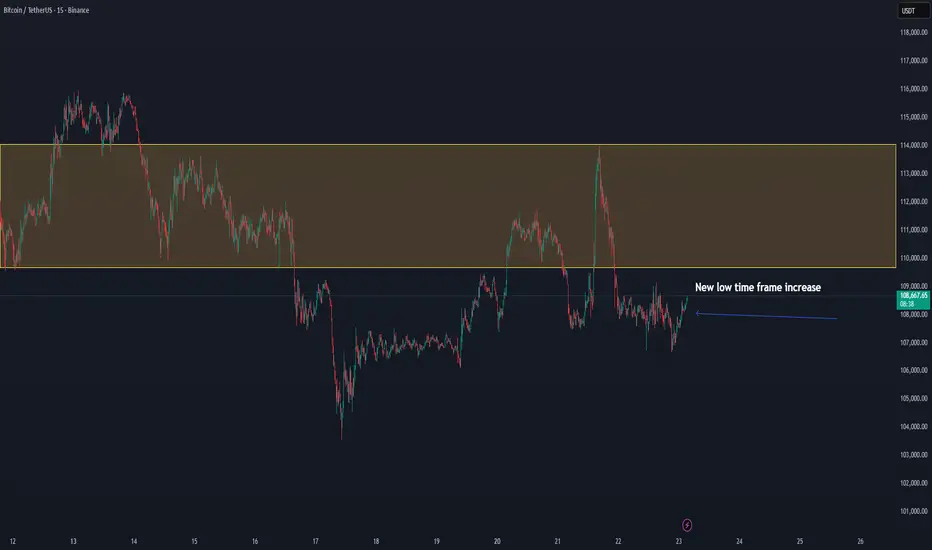
BTC/USDT — New Low-Timeframe Expansion Forming, Potential 114k+Bitcoin is beginning to show strength in the new low-timeframe structure, reclaiming the $108K zone with rising momentum. This confirms a short-term bullish shift after the recent consolidation.
The key resistance range between $110K–$114K remains the main obstacle, but if BTC maintains higher lows and continues to push within this structure, a move toward $118K becomes likely.
📊 Technical Overview:
Support: $106K–$108K
Range Resistance: $110K–$114K
Next Upside Target: $118K
Bias: Bullish on low-timeframe momentum
BTC’s ability to sustain above the $108K region suggests growing buyer confidence — confirmation above $110K could trigger continuation toward the upper range.
📈 Outlook: Low-timeframe expansion
🎯 Targets: $110K → $114K → $118K
ETH - NEUTRAL, but bearish bias#ETHERUM - price update:
👉Monthly = bullish, if bulls stay above 3185$ |
Double top resistance Monthly around 4800$ (no breakout).
👉Weekly = Neutral area: 4200 | 3185$
👉Possible bearish retest daily completed under 4080$ ✅📉
My bias:
Consolidation phase (monthly).
Neutral area, lower support haven"t been tested yet. 📉
I expect to slee a slow correction toward 3200 - 3100$ to grab liquidities, before to see another potential leg up!
Under 4100$, bear may be in control.
A daily candle close above 4800$ is required to confirm bull breakout HTF.
Possible setup & important levels in my charts.

Ethereum’s Hidden Fractal Points to $33K by November 2026Most of the space seems to think that the bull market is officially over, that the four-year cycle has come to a close. For most of the cycle, I have thought that way too. 1,064 days is up, and that’s the longest a Bitcoin cycle has ever gone for. So, the idea that the same thing will play out again is very valid, and it’s entirely possible that it is indeed the end. However, my stance is very different — I still think we have one year left in the tank, and I will present a lot of evidence to support why I believe this and why I’m sticking to it.
If you’ve been following me for a while, you know that we’ve found some very interesting bar patterns in history that keep on repeating, and this will be the primary source of evidence used in my thesis.
Bar Pattern Fractals
I have tested hundreds of indicators over the last six years and bought thousands of dollars’ worth of indicators, and in the end, the highest success rate has come from simply following bar pattern fractals. They repeat over and over. They are hard to find, but once you do, you can ride them for months.
ETH 2017 Fractal
What you see above is a fractal I have been following for months now. It has been mirroring the 2017 cycle, with some parts nearly identical in movement and timing, with only a few small deviations here and there. The macro pattern continues to play out like clockwork.
Take a look at this TA from March 2025. We caught near the bottom, called for max pain, and discussed this fractal that could be playing out. The ETH call was under 2000 back then.
I also published TAs on Chainlink and its repeating bar patterns. It was straightforward for catching big macro moves for LINK.
As you can see, these are just two examples of many fractals I’m following. The main one is ETH because it’s been a 1:1 mirror for the most part. The last spike down was a deviation for sure — well, at first I thought it was on the Bitstamp chart because it has the most historical data for ETH, but when I switched to the Binance chart, I found something very interesting.
A view of the bar pattern fractal is telling us where we are.
When switching to the Binance chart, we see a very interesting wick of 26% that nuked the market during that time — very similar to what Binance has done this time around. You cannot make this stuff up. So at first, I thought it was a small deviation, but in fact, after looking at this chart, it’s still a mirror, even including that huge scam wick of 27%. Amazing.
So as you can see, in terms of the bar pattern fractal, I simply cannot ignore the fact that this keeps mirroring, and if it continues, it’s possible that we have one more year left in this bull market, and that this four-year cycle thesis is, in fact, a massive bear trap.
If we take a look at the monthly candle that shook a lot of players out last cycle before the run-up, we can see that we printed a candle with wicks on both ends — very similar to what we are forming right now.
If we zoom into that moment on a smaller timeframe, you can now see the moves are similar — a big drop into a double bottom followed by a slow grind up. This is how ETH normally puts in bottoms.
Looking at ETH’s RSI levels on the monthly chart — during the first cycle, when it broke the all-time high, RSI was extremely overbought at 87. On the last cycle, it was 82. This cycle, ETH is at an all-time high and the RSI is only 59. We’re not even in the overbought range yet — there’s so much room for ETH to expand, it’s crazy.
Since its inception, ETH has always pulled off the same move: one very aggressive wave with an aggressive pullback, followed by one smaller wave that creates a higher high to finish off the cycle. It’s done this every time.
Which means that if the bar pattern fractal continues to mirror, then wave 1 tops in the first week of January 2026, followed by a massive correction that will again fool everyone into thinking the four-year cycle is 100% over. But what if ETH puts in a bottom in February 2026 and rallies back up to all-time highs? Nobody would believe it — the disbelief would be strong because everyone would have sold the top in Q4 2025 due to the four-year cycle theory.
The second major piece of evidence I’m leaning on is the Russell 2000. Since its inception, the Russell 2000 has done the exact same thing before expansion comes:
Double top
Second drop bear trap
V-shaped recovery back to all-time high
Expansion breakout
Same thing every time. Look at the chart and tell me we’re not going into expansion — there’s a very high chance. The last two times, we got that massive monthly candle breakout in November.
Which brings me to the main point — every time the Russell goes into expansion, Bitcoin has started its most aggressive run. The last three times, Bitcoin went on to break its all-time high and put in a cycle top within an average of 355 days.
Gold, shown above, is so close to the 4.236 extension right now that it would be crazy to buy here. There’s a high chance of a major top coming in, and we’re about to see a major rotation back into Bitcoin with those gains.
Just take a look at the Power of Law model for Bitcoin — the bull market hasn’t even started yet.
It’s crazy that people are calling the cycle top with the Mayer Multiple sitting at 1.19.
Conclusion
My view is that there is one more year left in this uptrend in crypto. Bitcoin has turned into a different beast. It has completely detached itself from the rest of crypto for the most part, but the first expansion is coming in 2026. If the bar pattern does not deviate, then greatness lies ahead.

Leverage is a Double-edged SwordCME: Micro Bitcoin Futures ( CME:MBT1! )
On October 6th, Bitcoin spot price hit a new all-time-high record at $126,198.07. The King of Crypto seemed unstoppable. Just four days later, President Trump escalated trade tension with China by threatening 100% additional tariff. This sparked a broad market selloff. The crypto market was among the hardest hits. Bitcoin plunged 11% for the day.
A post on X by The Kobeissi Letter captured the latest crypto crash:
"It's official: Crypto just saw its LARGEST liquidation event in history with 1.6 MILLION traders liquidated. Over $19 BILLION worth of leveraged crypto positions were liquidated in 24 hours, 9 TIMES the previous record." It notes it marked a single-day swing in Bitcoin's market cap of a $380 billion.
Leverage: A Double-Edged Sword
Leverage allows investors to amplify returns by borrowing funds, but it also magnifies losses, as seen in this crash. In crypto, traders often use 10x, 50x, or even 100x leverage, controlling large positions with very minimal capital. It was this overexposure, fueled by excessive leverage, that led to the $19 billion liquidation.
Margin trading can boost gains, but risks margin calls if prices suddenly drop, forcing asset sales at a loss. The risks of leverage are stark: a mere 2% price drop on a 50x leveraged BTC position wipes out 100% of the initial investment. Volatility, already high in crypto, makes leverage treacherous. A sudden drop of 5%, very common in cryptos, will overblow a $100K investment into negative balance of $150K for the same account.
While there are no regulatory limits in the U.S. restrict retail crypto leverage, few exchanges offer it. On the other hand, offshore crypto trading platforms offer much higher ratios, increasing exposure. Without stop-loss orders or risk management, leverage can turn a manageable dip into a total loss. Some crypto platforms offer Derivatives contracts. The name is often misleading. Many so-called “Exchanges” are not registered nor regulated by financial regulatory authorities. These contracts do not have the financial safeguard in place to protect the investors.
Investing in bitcoin is like riding a roller coaster. Taking on high leverage will be like not wearing a seatbelt. You could get thrown out of the ride every time it takes a turn.
Protecting your Bitcoin with CME Futures
As of October 18th, Bitcoin is up nearly 12% year-to-date. However, the gain was 32% when Bitcoin hit ATH. In less than two weeks, we have witnessed an 18% drawdown.
Despite the crash, Bitcoin’s long-term potential remains high. Its fixed supply of 21-million-coin and growing institutional adoption through exchange-traded funds and corporate treasuries support its "digital gold" narrative. Traders who are bullish on bitcoin could explore CME Micro Bitcoin Futures ( PSE:MBT ).
The MBT contract has a notional value of 0.10 bitcoin, as defined by the CME CF Bitcoin Reference Rate (BRR). On October 18th, the December contract (MBTZ5) is quoted at $108,495. Each contract has a notional value of $10,850. To buy or sell one contract, CME Group requires an initial margin of $2,590. By design, this futures contract has a built-in leverage of 4.2-to-1. When bitcoin goes up, futures positions could enhance the return by four times compared to spot bitcoin positions.
What happens if bitcoin drops? For price protection, traders could enter a buy order with a stoploss. For example, a long order at 108,495 with a stoploss of 100,000 limit the maximum loss to $849.5 (= (108495-100000) x 0.1).
In addition to margin (leverage) and stoploss (loss protection), Micro Bitcoin has a daily price limit at 10%. This feature is particularly helpful when the market is panicky. Price Limit or Circuit slows down the irrational price movements until cooler heads prevail.
To recap:
1) Always invest in Exchanges regulated by a national financial regulatory authority.
2) Employing bitcoin futures and options could enhance investment return.
3) Use stop loss to set maximum loss at a level within your tolerance.
Happy Trading.
Disclaimers
*Trade ideas cited above are for illustration only, as an integral part of a case study to demonstrate the fundamental concepts in risk management under the market scenarios being discussed. They shall not be construed as investment recommendations or advice. Nor are they used to promote any specific products, or services.
CME Real-time Market Data help identify trading set-ups and express my market views. If you have futures in your trading portfolio, you can check out on CME Group data plans available that suit your trading needs www.tradingview.com

BITCOIN HIGH PROBABILITY SETUP SOON!!!🚨 BTC HIGH PROBABILITY BUY SETUP 🚨
* Here We Can See Clearly The Next Potential Moves For BTCUSD Coming Hours/Days.
* Keep Your Eyes Close On Your Trading Positions.
* Happy PIP Hunting Traders.
FXKILLA.

BNB Game Plan - TBKZ ModelBNB Game Plan – TBKZ Model
📊 Market Sentiment
Market sentiment is currently volatile, heavily influenced by U.S. foreign policies.
With the U.S. entering a quantitative easing (QE) phase, the long-term outlook remains bullish, as more liquidity is expected to flow into risk assets.
However, the short-term sentiment is bearish due to renewed trade tensions and Chinese tariff concerns.
Overall, sentiment is slightly bearish short-term, but bullish long-term as macro liquidity expands.
📈 Technical Analysis
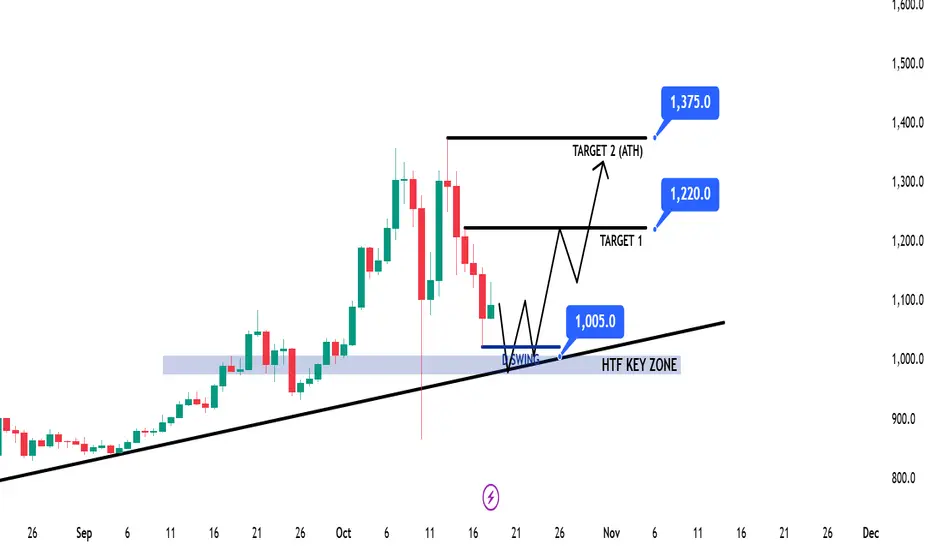
Price tapped the HTF bullish trendline and faced a rejection wick during the Chinese tariff announcement.
This reaction confirms the trendline’s significance as a major dynamic support zone.
Now, I’m watching for another price leg toward the HTF trendline, expecting a possible retest and bounce from the HTF Key Zone around $1005.
📘 Model to be used – TBKZ Model (Trendline Bounce at Key Zone)
1️⃣ Identify the HTF trend — trade only in that direction.
2️⃣ Map out the HTF trendline that may act as dynamic support.
3️⃣ Locate the HTF Key Zone containing significant liquidity and structure.
4️⃣ Wait for a bounce and LTF confirmation before entering the position.
📌 Game Plan
I will be waiting for price to return to the HTF trendline and retest the HTF Key Zone near $1005.
Once price gives confirmation (12H–4H structure break), I’ll look for a long setup.
🎯 Setup Trigger
Break of structure on 12H–4H timeframe after testing the $1005 zone.
📋 Trade Management
Stoploss: 12H–4H swing low that breaks structure
Targets: TP1: 1220$ | TP2: 1375$ (ATH)
Move stoploss to breakeven after TP1 hits.
💬 Like, follow, and comment if this breakdown supports your trading! More setups and market insights coming soon — stay connected!
⚠️ Disclaimer: This content is for informational and educational purposes only and does not constitute financial, investment, or trading advice. Always DYOR before making any financial decisions.
Ethereum Key Buy Zones 💠 Ethereum (ETH/USD) – Key Buy Zones Ahead
ETH is showing a major rejection from the same price zone that has only been tested twice in history — near the $4,000–$4,100 resistance area (highlighted in circles). Both previous visits led to sharp corrections, making this a historically strong resistance zone.
⸻
🔹 Current View
• ETH rejected the $4,000–$4,100 zone — same level as the 2021 top.
• Price is now trading around $3,770, below the 50 & 100 SMAs, signaling short-term weakness.
• The RSI is trending down from mid-levels, suggesting more room for a correction before a potential bounce.
⸻
🔹 Buy Targets
• First Buy Target: $2,590
• Second Buy Target: $2,160
• Third Buy Target: $1,715
These levels line up with strong historical support zones and key moving averages, ideal areas to start accumulating if ETH continues to pull back.
⸻
🔹 Outlook
The long-term structure for Ethereum remains bullish, but a deeper correction could provide much better risk-reward entries for the next cycle.
My plan: accumulate gradually at the marked levels, focusing on patience and strong technical confirmation.
⸻
🧠 “Smart investors don’t chase green candles — they buy when fear returns.”
📜 Disclaimer : This is general information only and not financial advice. Always do your own research before investing.

EDU - price analasysNYSE:EDU - price analysis:
Ascending accumulation, or HTF sideway move?
H1 = uptrend 📈 but the current daily view remain very neutral.
Key resistances:
0.1685 - 0.1880$
Bulls need to break above 0.1685$ with large buy volume to confirm further price increase. ⚠️
Lower key demand zone:
0.1280 - 0.1160

SEI - perfect play, TP4 GIT AGAINYesterday vs today; #SEI TP4 HIT
EPIC one again, congrats fam.
{Not a financial advice).

BTC/USDT — Volume Confirmation Points Toward UptrendBitcoin has reclaimed strength within the low time frame zone, while also showing rising volume activity — a key technical signal that supports the early stage of a potential uptrend continuation.
BTC volume has been increasing since the last 7H step by step.
Currently, BTC is stabilizing between $111K and $113.6K, forming a supportive base within this range. The volume range just above acts as a confirmation layer — once price holds above this level with consistent demand, the uptrend momentum could accelerate.
📊 Technical Highlights:
Low Time Frame Support: $111K–$113.6K
Volume Zone: $116.6K area and important confirmation zone.
Main Resistance / Target: $118-120K
A sustained move above the volume zone ($116K) would be the main confirmation that BTC’s next leg toward $126K is underway.
📈 Bias: Bullish continuation forming
🎯 Key levels: $113.6K → $116K → up 118K

Bitcoin Pulls Back Toward Key Support as Momentum WeakensBitcoin (BTC/USD) has experienced a sharp decline after failing to sustain gains above the 123,200 resistance zone. The drop has brought price back toward the 111,000 area, a key horizontal support level that has previously acted as a pivot point within the broader range.
The 50-day SMA (near 115,000) has now turned slightly downward, while the 200-day SMA (around 103,200) continues to trend higher, maintaining the longer-term bullish structure despite recent weakness.
Momentum indicators reflect a clear shift in sentiment:
The MACD has crossed below its signal line, suggesting bearish momentum may be building.
The RSI has fallen toward 42, moving closer to oversold territory but not yet indicating exhaustion.
If price stabilizes above 111,000, the current move may evolve into a consolidation phase within the existing range. However, a break below 107,300 would expose the next structural support near the psychological 100,000 level.
-MW
