BTC/USD: Danger Zone Ahead—Here’s What I’m Watching Take a close look at what’s happening now. BTC/USD is on the edge at 111,060, and if that breaks, the next major levels are 106,470, 103,200, then possibly even 100,000. Markets can shift fast; are you prepared with clear levels and a plan, or will you get caught reacting?
If you’ve ever felt unsure about how to spot big moves before they happen, or wondered how some traders seem to always stay one step ahead, you’re not alone. What’s the one thing you wish someone had told you when the market started moving fast? What’s your biggest struggle when the price gets volatile?
Drop your thoughts or questions in the comments
Or if you want to dig deeper, my inbox is always open for a real conversation. Sometimes the right question is all it takes to unlock a breakthrough. What do you want to see covered next?
Cryptos

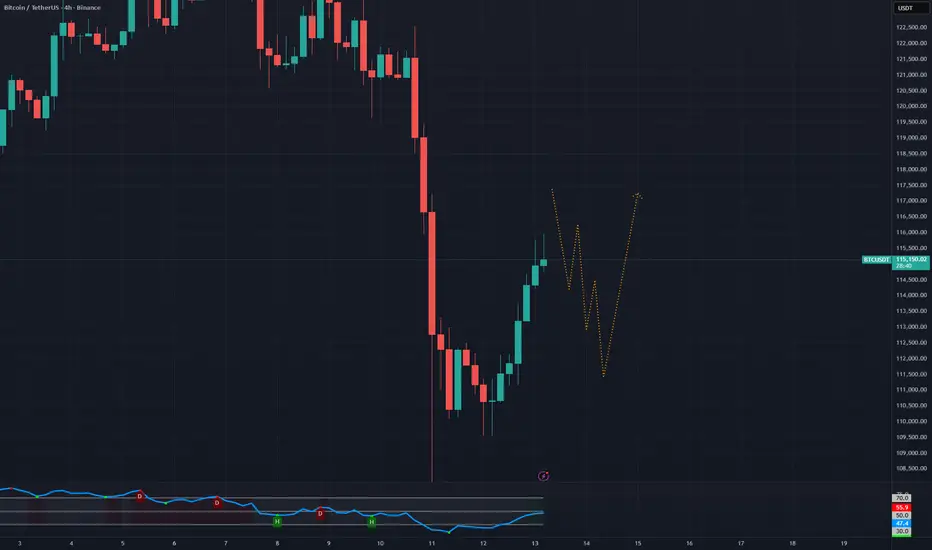
BTC Weekly Outlook (Oct 13 → Oct 20)After that brutal dump on Oct 10, BTC has been slowly reclaiming key levels — showing a short-term optimism across the market. It’s clear that many traders are buying the dip, thinking the crash was just a massive long squeeze after an overheated rally.
But personally, I don’t think it was just a long squeeze. It felt like a broader reaction to Trump’s sudden policy shift — something the market simply couldn’t price in fast enough. Both equities and crypto got hit hard by that shock, especially since everything had only recently stabilized after months of inconsistent policy moves under Trump’s return.
Looking at BTC, ETH, and internal money flow across the crypto market, I think we’re likely to see another short-term correction coming soon. Here’s why:
Profit-taking after the bounce:
The market just recovered from a deep dip — many short-term traders will likely take profits early, especially since the last BTC collapse still left a scar on most of them.
Stalled inflows:
The recent bounce didn’t come with major inflows. There’s been some recovery, but overall volume and liquidity seem to be slowing down.
Smart money behavior:
This bounce looks heavily driven by institutional/smart money. These players don’t gamble — they’ll wait to see how the market reacts next. If BTC drops again, expect them to pull back temporarily or rotate funds into BTC from alts (e.g., ETH).
Heavy resistance ahead:
BTC faces a major resistance zone at $116.8k – $117.5k. Breaking through that level will require a strong, high-volume push — not something easy to achieve right now.
Still, the weekly (W) timeframe remains healthy — momentum is intact, and overall this could still be viewed as a normal correction inside a larger bullish structure.
My take for the week (Oct 13 → Oct 20)
Price will likely attempt to push into the resistance zone above, but I expect at least one rejection bounce before any real breakout.
If that push fails, BTC might retest market sentiment around $114k, or in a more bearish case, down to $112k – $111.8k.
So this week, keep an eye on how price reacts near the upper resistance.
If we see a strong rejection, it’s worth considering short opportunities toward the lower zone — but be flexible with exits depending on how price reacts.
During the first half of the week, expect some choppy, whipsaw moves as bulls and bears fight for control.
After Oct 16, we’ll likely get a clearer short-term trend direction for the following week.
BTC BUY NOW ?BITSTAMP:BTCUSD
Bitcoin flushed out .
Next Impulse started from 98200 - 98400 range.
Entered long @98700 with SL the low.
Expecting a rally & holding it to ATH
Small Risk and changing SL to CtC when it crosses 100300

LINKUSDT – Possible Reversal After 5 Waves UpLINK has just completed a clear 5-wave impulsive move to the upside. With Wave V looking complete, there’s now a high probability of a corrective phase.
I’m watching for a potential drop towards the 17.5 USDT zone, which would be a significant percentage move from current levels.
📊 Potential Trade Levels:
Entry zone: 24.5 – 23.2 USDT
Stop Loss: 27.030 USDT
Target: 17.171 USDT
This scenario could unfold as an ABC correction.
⚠️ Disclaimer: This is just a personal trading idea based on Elliott Wave analysis, not financial advice. Please manage risk and do your own research before trading.

XRPUSD: From Panic to Opportunity - The Drop I'm Waiting ForGood morning everyone and Happy Sunday once again. Last Friday was a mess for a lot of us who hold long positions. But sometimes these sudden big drops creates opportunities for those who are patiently waiting.
I only have two cryptos that I kept buying every time it tested the 200MA. These are BITSTAMP:BTCUSD and BITSTAMP:ETHUSD and I considered it as my long term investments.
BITSTAMP:XRPUSD was supposed to be my 3rd one but because of the legal history happened between Ripple and US S.E.C. I stayed away.
These dispute was settled and won by Ripple last 2023, and honestly I missed the train when XRP breakouts after the US election last year.
For those who wants to understand BITSTAMP:XRPUSD , here's some quick points:
XRP is a cryptocurrency created by Ripple Labs. Its main goal isn’t to replace traditional money — it’s to make global money transfers faster and cheaper, especially between banks and financial institutions.
Here’s the core idea:
When you send money internationally through traditional systems (like SWIFT), it’s slow, expensive, and goes through several intermediaries.
Ripple built the XRP Ledger (XRPL) — a blockchain that can settle cross-border payments in seconds, at a fraction of a penny per transaction.
XRP acts as a bridge currency — meaning it can be used to instantly convert one fiat currency to another (say USD → EUR or PHP → CAD) without holding both in reserve.
XRP usage is a big game changer and I think bank institutions could or might adapt the system - who knows.
Last Friday, I bought my first XRP when I saw the big drop, I was really waiting for that sub $2.00 level but the price action was so fast and I ended up filled at $2.41-$2.45.
I think this will test back again from that Friday's low (Oct.10) which was at around $1.78- $1.80s and if that happens, I will add from that again. I know we shouldn't be averaging down but like I said from the beginning that I want this to hold long (like the same strategy I'm using for BTC and ETH).
As of this writing, XRP is trading at around $2.40s but I don't care. My exposure here is not that much plus I am really planning to add more at $1.80's, if for some reason it comes back there.
Just remember that to always manage your risk ok, watch your position size and most of all God Bless You all...

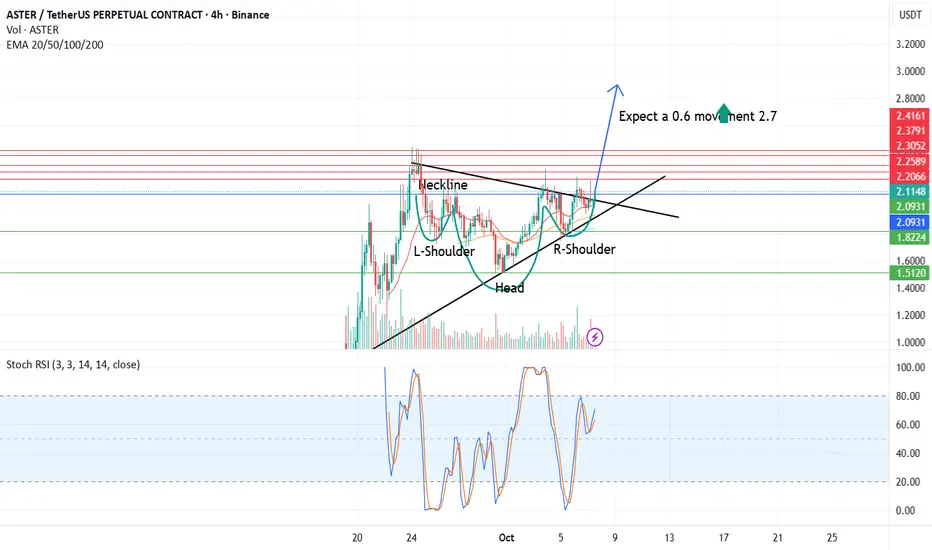
Aster is undervalued + IHS ; $2.7 soonAster has a 3.5B marketcap vs Hyperliquid has a 15.6B marketcap
On perpetual / derivatives volume, Aster currently seems to outpace Hyperliquid by a substantial margin (tens of billions vs a few billions), based on DefiLlama’s 24h volume figures.
On spot / pool DEX volume, Hyperliquid is strong (hundreds of millions in daily pool trades), and Aster also reports substantial volume (e.g. $793M on a high day) but it depends on the day and market conditions.
Aster is undervalued in fundamental terms
And tecnically speaking the chart is asking to run wild.
Personally I expect a 4 at least. But for now, not yet listed on Binance, that Inverted Head & Shoulders says we could see a 2.7 very very soon.
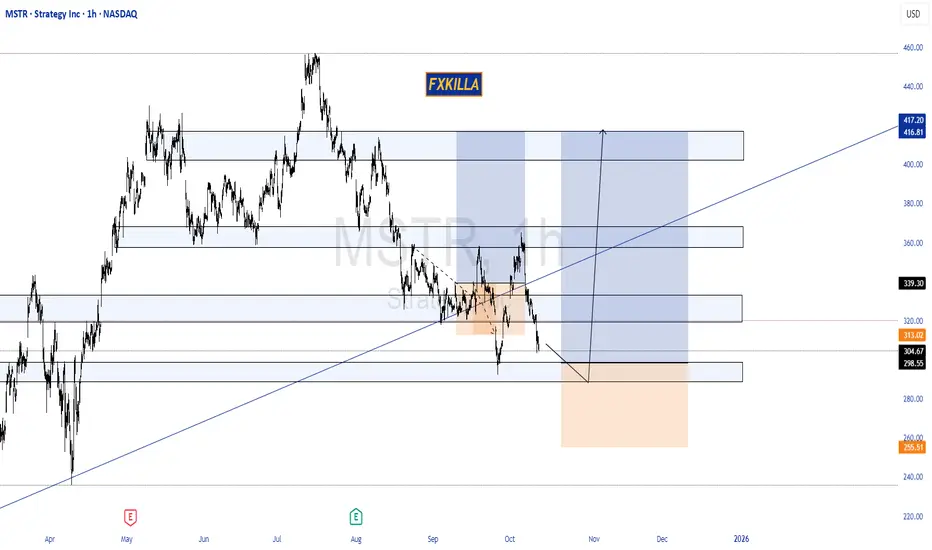
MSTR HIGH PROBABILITY SETUP SOON!!!🚨 MSTR HIGH PROBABILITY BUY SETUP 🚨
* Here We Can See Clearly The Next Potential Move For MSTR Coming Hours/Days.
* Keep Your Eyes Close On Your Trading Positions.
* Happy PIP Hunting Traders.
FXKILLA.
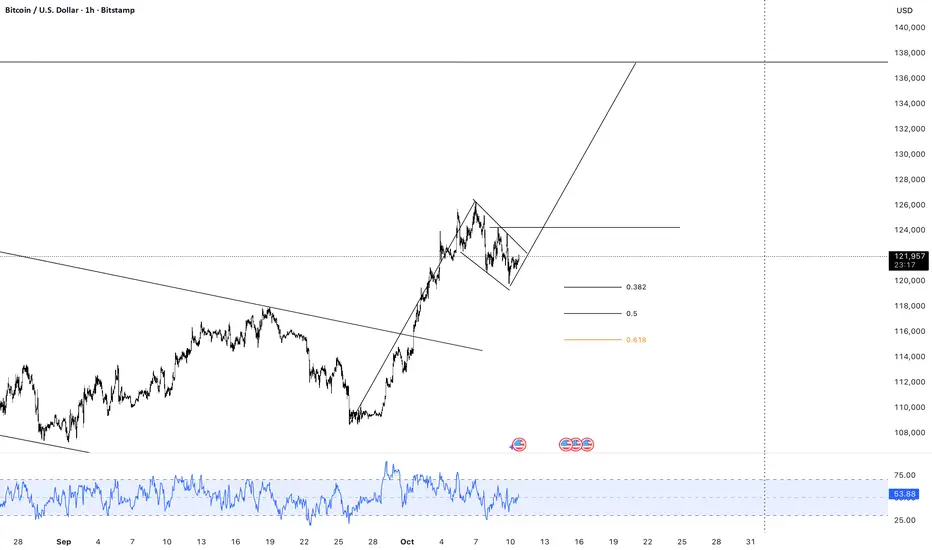
Bitcoin Ready to Fly! Harmonic ABCD Pattern
Bitcoin is currently active in the trading market, forming a harmonic ABCD pattern.
Price has retraced around 30% to a key Fibonacci level.
This zone may act as a potential reversal area if buyers hold the level.
RSI shows bullish divergence, indicating weakening bearish momentum.
Risk–Reward Ratio (RRR): 1:2
ETHUSDT 1H - Key Liquidity Zones & Bullish Reversal Potential ETHUSDT 1H Analysis: Price is reacting from a critical support zone between the Fib 0.5 - 0.618 retracement and previous day low, both marked as high-liquidity areas. If current support holds, expect a potential bounce targeting the previous day’s high ($4,530.80), with further upside toward the buy side liquidity at $4,748.04. Watch for confirmation in the highlighted demand zone for low-risk long setups. A break below $4,143.60 would invalidate this scenario and shift focus to lower sell side liquidity.”
This chart setup is useful for traders seeking possible long opportunities, with clearly defined risk and upside targets.

Fartcoin Wyckoff ReaccumulationCRYPTO:FARTCOINUSD looks to be in Wyckoff reaccumulation. Honestly, there’s nothing more to say, the chart speaks for itself.
We’re currently sitting in the spring zone, waiting for a bounce, retest, and move up. In my opinion, that should unfold over the coming months.
The risk here is that the spring I’m seeing might not actually be the spring, in that case, price could go lower. Still, I doubt it breaks below the current low; if it does, I’d say the downside risk sits around $0.5.
The trend is slowly curling upward, and I’m looking at potential targets of:
- Bear case: $2
- Base case: $3
- Bull case: $4

LINKUSD – Bullish Impulse Toward D-Point Target
LINKUSDT:
Title: LINKUSD – Bullish Impulse Toward D-Point Target
Price action has completed a corrective ABC structure, finding strong support at point C. The current breakout above mid-structure resistance confirms bullish momentum, aiming toward the D-point completion. Risk is managed below the breakout zone, with potential for trend continuation if price sustains above local support.
Risk Management Notes:
– Entry aligned with breakout confirmation
– Stop-loss below structural support (C-area)
– Take-profit near projected D-point completion

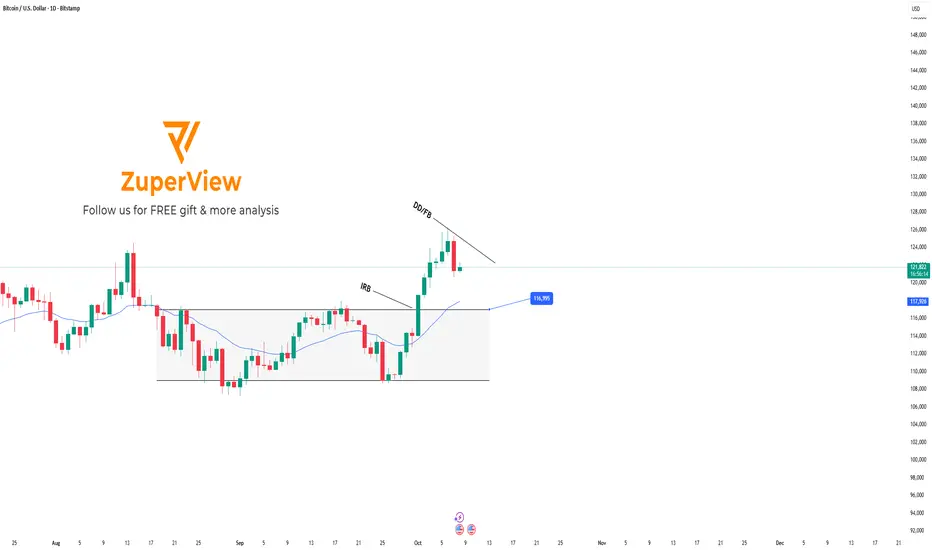
BTCUSD: Short term sell setup - Long term buy opportunity ahead
🔁 Review of Yesterday’s Plan
After BITSTAMP:BTCUSD rallied and set a new high at 126,190, the market entered a corrective phase.
In yesterday’s plan, we expected that:
Once the H1 candle closed below EMA, BTC could continue its decline and retest the lower support zone.
After touching support, price might pause briefly, then break lower to continue the downtrend.
Currently, BITSTAMP:BTCUSD has broken below and is consolidating sideways within a narrow range on H1, aligning perfectly with the anticipated correction scenario.
📈 Trading Plan for Today
On the H1 timeframe
Two key levels to watch for the Sell plan:
Resistance: 123,449
Support: 121,293
Scenario 1:
If price fails to break above EMA and keeps consolidating near 121,238While staying below EMA, → wait for a BB (Break Block) confirmation → Sell following the breakout signal.
Scenario 2:
If price retraces toward EMA and moves up to test 123,471→ wait for bearish confirmation around resistance to Sell from that level.
On the Daily timeframe
After the strong rally, BTC is now undergoing a technical correction.
The plan is to wait for price to pull back to retest the upper boundary of the previous range around 116,995, and Buy from that area.
Alternative setup:
If price reaches EMA sooner without testing the 116,995 zone,→ wait for BTC to accumulate momentum, then look for DD (Double Doji) / FB (First Breakout) pattern confirmation → Buy after signal confirmation.
🎯 Summary:
Short-term (H1): Bearish correction.
Mid-term (Daily): Bullish bias intact, waiting for confirmation near support.
Please like and comment below to support our traders. Your reactions motivate us to do more analysis in the future 🙏✨
Daniel Miller @ ZuperView
SUI/USDT; BUYERS INHello friends
Given that the price has reached the specified support and the price is supported by buyers and the specified resistance has been broken, we can buy in steps with risk and capital management and move towards the specified goals.
*Trade safely with us*

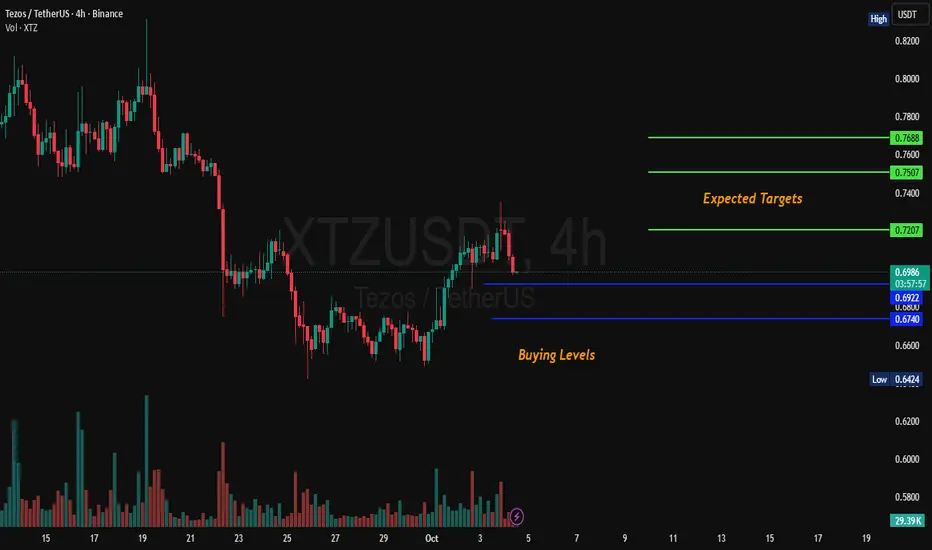
XTZ 4H Analysis XTZ Has started upward momentum. Key buying area are marked as 0.682 & 0.675. Possible targets are also given on the chart. NFA DYOR
BUFFALO | $ARKM is going goodOverall, the monthly timeframe of ARKM is showing a clear compression phase, characterized by large-volume doji candles — a sign that strong accumulation is taking place at current levels. After an extended downtrend, the current price structure indicates that selling pressure is weakening, while buying interest is gradually stepping in around key support zones. From a technical standpoint, this is shaping up to be a solid base-building phase, potentially setting the stage for a new bullish cycle once broader market conditions stabilize.
I’ll be keeping a close watch on ARKM in the coming weeks, as a clean breakout from this consolidation range could offer a significant trading opportunity. My plan is to enter around 0.55x, with DCA entries down to 0.4 if further retracement occurs. The target levels are set sequentially at 0.82, 1.00, 1.18, 1.38, 1.78, and 2.39, aligning with major technical resistance zones and potential profit-taking areas along the upward trajectory. Overall, ARKM remains one of the coins I’m watching most closely for the upcoming quarter.
Swing Trading Plan:
Entry: 0.55x - 0.4
SL: 0.3
Tp: 0.8 - 1.1 - 1.3 - 1.75
Drop a comment here if you have the same opinion :)

BTCUSD: Monday analysis and buy plan within rangeLast week, BITSTAMP:BTCUSD had a strong bullish recovery, setting a new all-time high.
At the moment, the trading plan remains bullish (Buy bias), but risk and position sizing should be managed carefully, as the market may experience short-term corrections after such an extended rally.
🧭 BTC Trading Plan
Small Range within a Larger Range
Price is currently moving inside a smaller range within a larger range.
Wait for price to accumulate momentum and form an IRB (Inside Range Break) signal before setting up a potential Buy entry.
Upper Boundary of the Larger Range
Once price breaks the IRB and approaches the upper boundary of the major range, look for price compression near EMA.
Upon confirmation of an RB/ARB (Range Break / Advance Range Break), execute a Buy market order, aiming for a reward ratio of 2R or higher.
If the Market Deviates from Plan
Stay on the sidelines and wait for clearer signals before re-entering the market.
🎯 Summary:
BTC remains in a bullish structure, but selective entries and disciplined risk control are essential.
Wishing everyone a productive and profitable trading week ahead!
You can refer to my previous analysis here:
Please like and comment below to support our traders. Your reactions motivate us to do more analysis in the future 🙏✨
Daniel Miller @ ZuperView

ZEC - BEARISH STRUCTURE --> UNSAFE AREA FOR BULLS#ZEC- price analysis: Cautious with long, NO FOMO.
Prices is up 250%+ in few days, because of hype on "privacy tokens' if i'm right!
Neutral zone monthly.
Key levels weekly have been hit.
🚨Double top daily
🚨H4 bearish divergence
🚨H4 Rising wedge structure
In my opinion, prices is gonna correct deeper toward 125$ or 115$ support next.
Upper big levels:
157 - 165 - 170$
To sum up:
Really unstable area for long subject to a bearish correction.
Bullish momentum faded + bearish structure visibile H1 view.
Cautious under those resistance levels.
Invalidation: H4 candle close above 170$

BITCOIN HIGH PROBABILITY SETUP SOON!!!🚨 BTCUSD HIGH PROBABILITY SELL SETUP 🚨
* Here We Can See Clearly The Next Potential Moves For BTC Coming Hours/Days.
* Keep Your Eyes Close On Your Trading Positions.
* Happy PIP Hunting Traders.
FXKILLA.

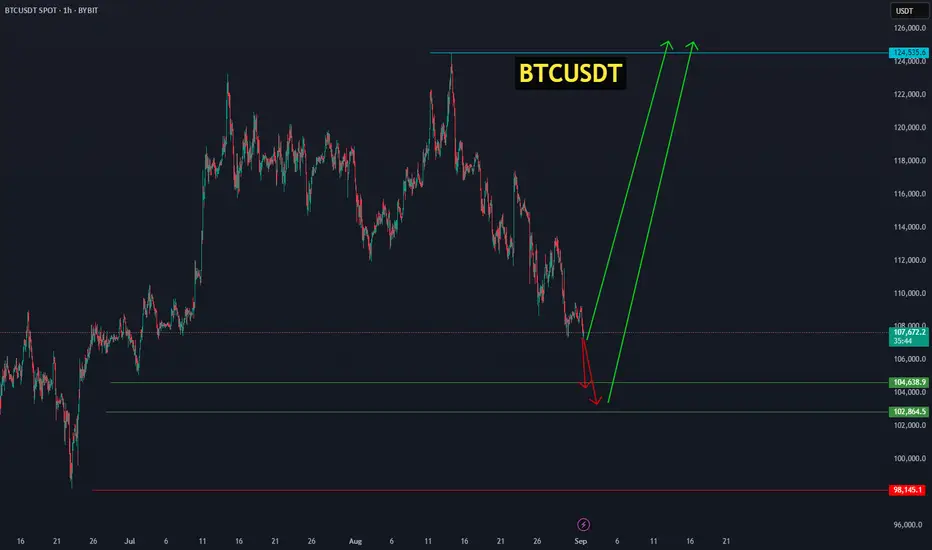
Bitcoin from the 102,864 zone is set to ignite its next bullish Bitcoin will either start its upward move from the current price or from the range of 104,638.9 – 102,864.5, aiming for targets between 118,000 and 124,535. BINANCE:BTCUSDT
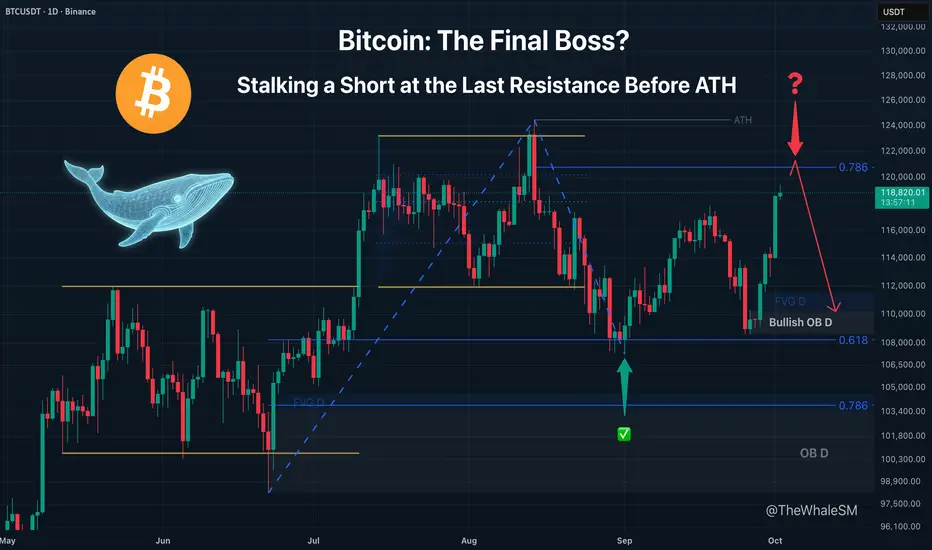
BTC: New ATH or One More Correction? The 78.6% Level DecidesIn every great story, there is a final challenge before the ultimate prize. For Bitcoin, that moment is now. The price is approaching the last major line of resistance that stands between the current price and a new All-Time High. This analysis breaks down that critical level and the tactical, counter-trend opportunity it may present.
Bitcoin is continuing its uptrend after the correction to the 61.8% Fib level, which I showed in the trade idea " Bitcoin's Tumble: How Deep Does the Rabbit Hole Go? ", and is now approaching a very important level that will determine whether a new ATH will be formed or if the asset will correct further before that.
This is the 78.6% Fib level - the last resistance level from which a short can be considered.
Conditions for the Short Setup:
🔑 POI: 78.6% Fibonacci Retracement Level
🔎 ENTRY CONDITIONS: The price must find acceptance below the 78.6% level. Since this is a daily structure, this may require daily candle bodies closing below the level for confirmation.
🎯 MINIMUM TARGET: Bullish Daily Order Block below.
❌ INVALIDATION: A confirmed break and hold above the 78.6% level. A break here would signal a probable move to a new ATH.
~~~~~~~~~~~~~~~~~~~~~~~~~~~~~~~~~~~~~~~~~~~~~~~~~~~~~~~~~~~~~~~~~
The principles and conditions for forming the manipulation zones I show in this trade idea are detailed in my educational publication, which was chosen by TradingView for the "Editor's Picks" category and received a huge amount of positive feedback from this insightful trading community. To better understand the logic I've used here and the general principles of price movement in most markets from the perspective of institutional capital, I highly recommend checking out this guide if you haven't already. 👇
P.S. This is not a prediction of the exact price direction. It is a description of high-probability setups that become valid only if specific conditions are met when the price reaches the marked POI. If the conditions are not met, the setups are invalid. No setup has a 100% success rate, so if you decide to use this trade idea, always apply a stop-loss and proper risk management. Trade smart.
~~~~~~~~~~~~~~~~~~~~~~~~~~~~~~~~~~~~~~~~~~~~~~~~~~~~~~~~~~~~~~~~~
If you found this analysis helpful, support it with a Boost! 🚀
Have a question or your own view on this idea? Share it in the comments. 💬
► Follow me on TradingView for timely updates on THIS idea (entry, targets & live trade management) and not to miss my next detailed breakdown.
~~~~~~~~~~~~~~~~~~~~~~~~~~~~~~~~~~~~~~~~~~~~~~~~~~~~~~~~~~~~~~~~~
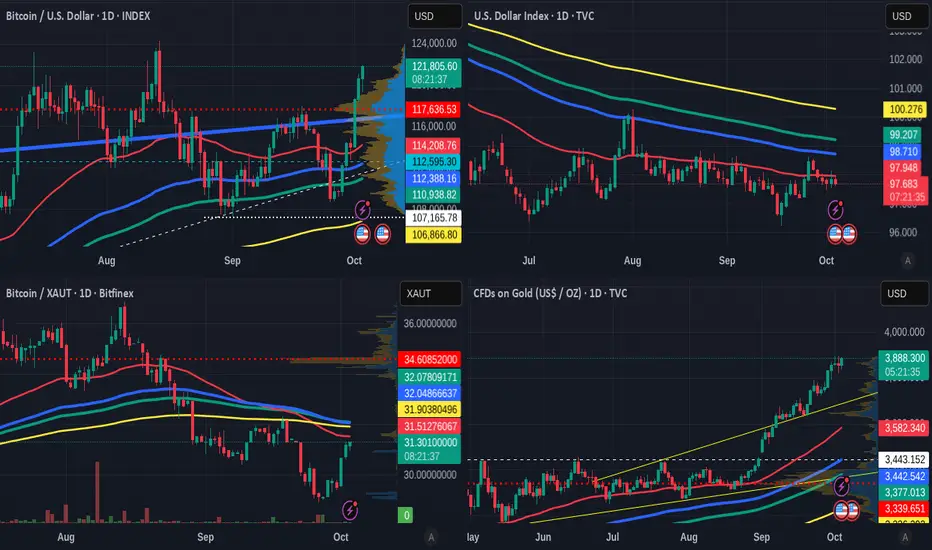
Why we should be using BTCXAUt GOLD pair and NOT BTCUSDT
These charts are DAILY chart
Top Left BTCUSDT Index - Top right DXY US $ Index
Bottome Left BTCXAUt Bitcoin GOLD - Bottom right GOLD USD
Easy to see how the USD is currently running FLAT after Months of devaluation (top left)
So while BTCUSD has risen, More $ per Bitcoin, the REAL Value of each $ is less than it was in 2023, when this bull run began taking shape.
If we look at the BTCXAUt chart, we can see how in the same time period, BTC has Lost to Gold since June but has begun to regain,
Infact, if we look at the BTCXAUt Weekly chatrt, you can see how BTC has walked all over GOLD.
More than that, just look at that pennant.
But Why is GOLD better pair than $?
Look at the Weekly GOLD chart
This is the same scale as the chart above.
GOTH HAVE RISEN IN VALUE SUBSTANTIALLY>
This is a WIN WIN situation
The DXY ni the same period
Ranging with Deeper Drops each time.
Trading is 90% more profitable with BTC GOLD pair
Even if you do not trade and you want to take profit, Sell your Bitcoin to GOLD and your profit continues to Rise !!
If you Trade the swings higer andlower on each asset, there is a risk but the Gains are REAL
Just saying, NOT Advice
Have a Nice weekend
DOGS; BUY OR SELL?Hello friends
Given that the price has reached the specified support and the price is supported by buyers in the specified area and the specified resistance has been broken, we can buy in steps with risk and capital management and move to the specified targets.
*Trade safely with us*

BTC smashes 120K, ETH tests 4.5K! Is Altseason finally here?Bitcoin breaks through $120K while Ethereum retests critical $4500 resistance. Our analysis reveals why this "Uptober" rally could signal the start of the biggest altcoin surge since 2021.
🚀 Rally catalysts
US Government shutdown : Dollar weakness from political uncertainty and Fed policy paralysis
"Uptober Effect" : Bitcoin historically averages 20%+ gains in October (currently up 5-6% with 3 weeks remaining)
Institutional flows: $4B+ institutional buying, 850K ETH whale accumulation in past 2 weeks
Q4 seasonality: Crypto's strongest quarter with historical momentum into year-end
📊 Bitcoin Technical Analysis
Pattern : Bullish hidden divergence confirmed with swing high breakout above $118K resistance
Current structure : Potential 5-wave Elliott sequence suggesting final impulse leg
Key levels : Support at $117K (trendline), resistance cluster $122K-$124K
Momentum : RSI recovering, MACD bullish crossover confirms continuation
⚡ Ethereum technical breakdown
Weekly setup : Successful retest and hold above $4K support, pennant/triangle breakout in play
RSI divergence : Bullish divergence confirmed on multiple timeframes, RSI near 60 (room to 70+)
Elliott wave count : Either completing Wave 5 (correction ahead) or early Wave 3 (massive move higher)
Cup & Handle : Measured move target to $6,850 based on long-term pattern
🔥 Altseason indicators - Total3 analysis
Chart pattern : Cup & handle formation on Total3 (altcoins ex-BTC/ETH) approaching ALL-TIME HIGHS
Key level : $1.1T breakout threshold - confirmation needs 3 daily closes above ATH
BTC dominance: Break below 60% support signals potential altcoin rotation
Targets: $1.2T initial, $1.3T extension if breakout sustains
💹 Trading Strategy
ETHEREUM LONG Setup:
Entry: $4,300 on pullback (current: $4,500)
Stop Loss : Below $4,050 (1.618 Fib extension)
Take Profit 1 : $5,200 (2:1 R/R)
Take Profit 2 : $6,850 (measured move target)
Risk Management : Trail stops above breakeven after TP1
Key levels to watch:
Bitcoin : $117K support, $122-124K resistance zone
Ethereum : $4,126 critical support, $4,500 resistance, $6,850 long-term target
Total3 : $1.1T breakout level for altseason confirmation
🎯 Market outlook
October living up to "Uptober" reputation with favourable macro setup. Dollar weakness, institutional flows, and technical breakouts align for potential crypto supercycle. Watch Total3 breakout - if altcoins breach ATH, we could see 2021-style altseason explosion.
This content is not directed to residents of the EU or UK. Any opinions, news, research, analyses, prices or other information contained on this website is provided as general market commentary and does not constitute investment advice. ThinkMarkets will not accept liability for any loss or damage including, without limitation, to any loss of profit which may arise directly or indirectly from use of or reliance on such information.
