ETH 4H Analysis - Key Triggers Ahead | Day 28❄️ Welcome to the cryptos winter , I hope you’ve started your day well.
⏰ We’re analyzing BINANCE:ETHUSDT on the 4-Hour timeframe .
👀 On the 4-hour chart, after the recent drop, Ethereum managed to hold above $3,900 thanks to support from its maker-buyer zone. Price is currently trading below a key resistance at $4,034. A breakout and confirmation above this level could lead ETH toward its next major trend-shift resistance.
The primary resistance for initiating a new bullish leg sits at $4,133. A break and stabilization above this zone could trigger a solid upside move, potentially extending toward the $4,800 area.
🧮 The RSI oscillator shows that during the recent sell-off, ETH dipped twice into deep oversold territory, with significant time spent under selling momentum. The key RSI zone now is the 50 baseline, which acts as resistance. A momentum break above this level would support price stabilization over $4,034, and allow ETH to retest and potentially break its resistance on the way to the overbought zone.
🕯 The candle size and volume on the rebound from the maker-buyer support have been reasonably strong, suggesting that ETH has likely established a key floor around $3,837. As price approached the $4,034 resistance, red candles have become smaller — signaling weakening bearish pressure and absorption of sell orders at that zone.
Given the weekend environment, volume has cooled off, and price is moving in a range. With the start of the new week, increased volume could spark a breakout, and trader reaction on ETH may be notable.
💸 The BINANCE:ETHBTC pair is also sitting below a key resistance zone. A breakout and confirmation here could shift ETH’s trading behavior and momentum. On RSI, the pair is around the 50 level, showing reduced volatility due to weekend conditions.
The first key resistance is at 0.03687. A breakout and confirmation above this level could support a long setup on ETH. However, the critical resistance sits at 0.03853 — which aligns with the pair’s overbought potential. Breaking and stabilizing above that level would likely trigger notable bullish continuation, but only if RSI enters the overbought zone as confirmation.
🧠 Since CRYPTOCAP:USDT.D recently rejected from 4.72% and Bitcoin has shown some support, Ethereum now holds a reliable floor that can be used for long setups once the specified resistances break. Two main scenarios are in play:
1️⃣ Scenario 1: We need a higher-timeframe candle close above key resistance, starting with $4,034, which also aligns with RSI’s 50-level resistance.
After that, spotting a multi-timeframe indecision candle could allow an entry with controlled risk.
Upon a confirmed break of the major resistance at $4,133, or signs of trend reversal, additional position size can be added.
Essentially, we require a higher low above $4,034, enabling formation of a higher high and eventual breakout through $4,133.
2️⃣ Scenario 2 : A short on ETH is less favorable due to strong buying interest at current levels and weaker risk-to-reward. However, if price breaks and confirms below the key support and maker-buyer zone, a deeper correction could follow.
❤️ Disclaimer : This analysis is purely based on my personal opinion and I only trade if the stated triggers are activated .
Cryptowinter

ETH 1D Analysis - Key Triggers Ahead | Day 27❄️ Welcome to the cryptos winter , I hope you’ve started your day well.
⏰ We’re analyzing ETH on the 1-Day timeframe
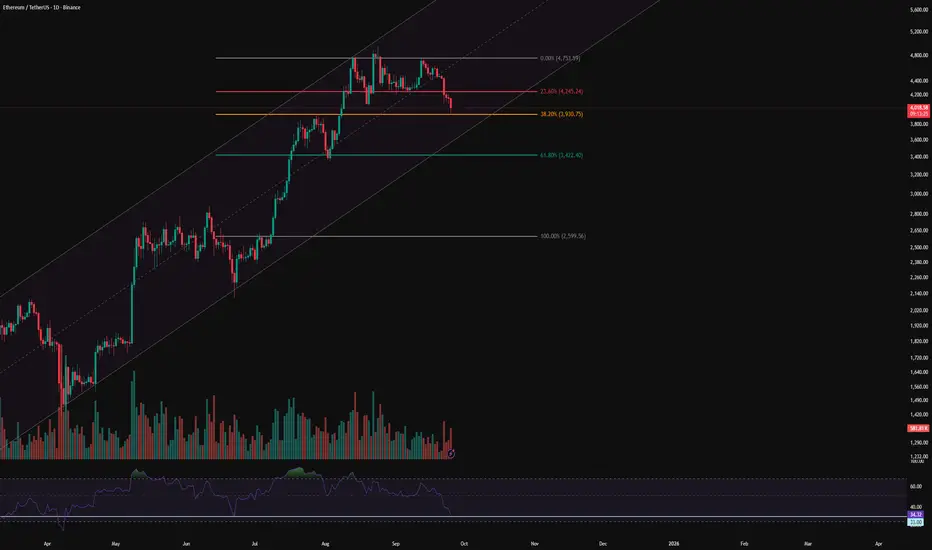
👀 On the daily timeframe we observe that Ethereum is trading inside a strong ascending channel. Currently, after touching the channel top, price moved toward the midline, lost the midline, and is now heading toward the channel bottom. Ethereum reacted once at the 38% Fibonacci zone, but selling pressure is increasing, and with losing this support level around $3,930, ETH can move toward the channel bottom and even lower support levels.
🎮 The Fibonacci retracement is drawn from the $2,600 breakout area up to the all-time high of Ethereum, which clearly covers all the support and resistance zones. At this stage, Ethereum has reacted to the 38% Fib level, but with losing this area it could move toward the key support overlapping with the channel bottom. The 38% zone observed in this analysis has high validity in daily price action, and with breaking this area we can open a short position.
🧮 Looking at the RSI oscillator, after creating a new all-time high, Ethereum entered selling pressure and is now near its oversold area. Our key RSI zone is also located here. With a cross below 33, Ethereum could experience a deeper correction and fully enter the oversold range.
🕯 The size and volume of red candles for breaking Fibonacci zones usually happen in a whale-driven manner. Normally, before the move, one or two opposite stop-hunts with shadows (wicks) appear, and then the move continues. The recent candles Ethereum has formed show strong selling volume, and candle closes below the 38% Fib zone together with selling pressure can bring even more red candles.
🧠 For an Ethereum position, it seems better to wait until whales and sharks of the market finish their stop-hunts. On the third touch, for example, with a break of the 38% Fib zone and entry of ETH into the oversold RSI area, we can open a sell position.
💡 Keep in mind that today the U.S. labor market has strengthened significantly, and there may be no signal of upcoming rate cuts in the next Fed meetings.
❤️ Disclaimer : This analysis is purely based on my personal opinion and I only trade if the stated triggers are activated .
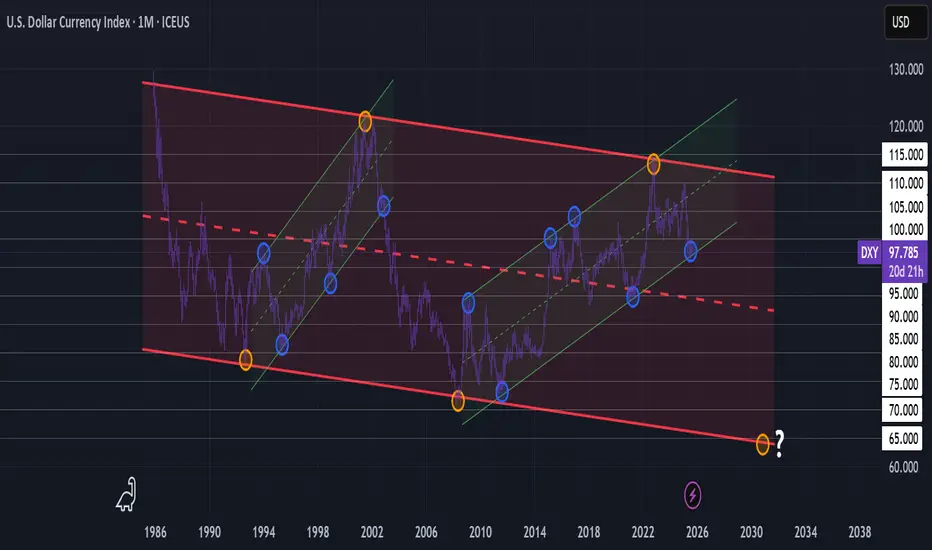
Implausible until it's not? Zoom out $DXY.On the high time frames, the dollar is trading inside a long-term descending channel that dates back decades. The rally into a rising channel has been previously followed by a decline 2002-2008. The most recent rejection from the channel’s upper trend in 2022–2023 suggests that momentum could shift toward the downside, with our next macro target lying near the bottom of the range. We've already broken below our major whole of 1.00 and retested.
Recent NFP data shows a cooling labor market. Slowing job growth and downward revisions might point to a break in momentum. A softer labor market reduces the Fed’s ability to maintain higher rates, undermining DXY strength. Beyond employment, consumer spending is showing cracks while business investment is being pressured by higher borrowing costs. If growth becomes stagnant, the immediate appeal of the economy could weaken, reducing foreign capital that support the dollar. Other factors may include tariffs, policy shifts, or deficits.
When both macro fundamentals and technical structure align, the case for a dollar decline strengthens. While near-term volatility is always expected around Fed shifts and global risk, the high-time-frame view points to the possibility of a downtrend that could extend into the months or possibly years to come.
Eyes peeled for an inverse crypto-winter.
$BTC - Steeper correction if below $93500Hi guys! 👋🏻
🔔 Lacking momentum and liquidity and it's time for correction
🔔 I believe it's too early for $100K and time to get rest before the next run.
🔔 CRYPTOCAP:BTC couldn't get the $100K and with each try the daily close is lower than the previous one, which states that market might not be ready yet for a strong impulse.
🔔 The best scenario for #bitcoin would be to close below $93500 and go for a correction down to $80K, regain momentum and take over the $100K barrier.
🔔 Triangles could be tricky, so watch for a breakout before making any decisions.
✊🏻 Good luck with your trades! ✊🏻
If you like the idea hit the 👍🏻 button, follow me for more ideas.

#BITCOIN WEEKLY CANDLESTICK's ... LOOK PROMISINGAt least for a relief bounce to horizontal resistance
Taking things step by step
Level by level
Before we can call a reversal of course.
Bullish Divergence on the momentum structure as well

Bart Says HelloWith resistance locking in what seems to be Wave 4 of a potentially leading diagonal wave (see orange circle), unless bulls can push price back above $72K in the days ahead, its probably best to consider the idea that Bitcoin has printed its top already for 2024.
If so, we can expect Bitcoin to fall steeply for the next 2 years roughly.
Target?
$5.00

Bitcoin Dominance Looks Towards ATLBitcoin has reigned supreme within the crypto universe since its first introduction. The BTC.D shows a shift in the trending direction however. Should levels make a return to 74% or better, expect all time lows to come near 2027.
Posting for tracking and public historical reference.

XRP to breakout to 0.87 for XMAS 12.25.2023 XRP/usdNot sure why there is such low volume on CRYPTOCAP:XRP but the sentiment is still the same IMO.
The Crypto winter is HERE
I think XRP is potentially being manipulated by the alphabet boys SEC.
CRYPTOCAP:BTC is in an upward channel to test 50K
CRYPTOCAP:ETH has broken out to test 2500
Why is CRYPTOCAP:XRP so stagnant???
We have taken out the sub .60 lows, and tested .70 2x in NOV
The confluences are aligning and its only a matter of time before the impulsive bull run.
.81-.87 is the target which is is 1:5 Risk:Reward ratio as posted.
LOAD THE BUS we going NORTH!
*This is not Financial advice, simply my own analysis and opinion DYR*
#XRPtotheMOON

ETH USD Idean a strategic move that has already yielded over 500% returns, our pitchfork range has proven to be remarkably effective. Recently, we shared our algorithmically-driven channel for Ethereum, a cryptocurrency that, when moving sideways, showcases an impressive accumulation of orders and unwavering respect for algorithmic levels. Currently positioned at the 50% level with a flip in volume, we've identified another entry point with minimal drawdown.
For our followers, it's important to note that we're taking a 10% gain now at the first take profit level to secure profits and allowing the remaining position to soar higher. As the holiday season approaches, we wish you lucrative trading opportunities and encourage you to navigate the markets wisely for your benefit. Happy trading, and may the markets work in your favor!

#MARA - Marathon digital holdings back to single digitsLikely scenario in a during #Crypto winter
2014, 2018, 2022
more evidence #Bitcoin likely to bread down it seems

Bitcoin From 2010 to 2025: Not An Impulsive Wave (edited)A follow-up to my pervious invalidated long term idea of BItcoin reaching $3,000,000 within the next decade..
(to state it explicitly, this idea has largely been invalidated by further review of Bitcoin's macro price action).
This idea will be largely contrary to my previous. Based on a number of subtle signals discovered through Bitcoin's price action review, I feel at liberty to say that there's is no way that BTCUSD is structured in an Impulsive Wave format. Its expeditious growth has not once made a sizeable enough correction to satisfy a Wave 2 requirement - not one time. Generally, we expect Wave 2 to retrace at least to the 50% fib level, the most we've seen for Bitcoin (on the fib scale is 38%). Corrections to the 38% fib level are very commonly seen within Wave B (or Wave X) in certain cases. Whether it be Wave B or Wave X, such labeling only comes within corrective wave forms . Zig-Zags (the most common corrective wave type) notoriously travel much faster than Impulsive waves as well. At its current price level, Bitcoin has grown 1969928%, in a matter of 13 years. We could easily classify this as a much faster pump than we've typically seen outside of the OTC Market (and we know what follows these outrageous pumps in a lot of cases...)
Seemingly in a Bullish Double Zig-Zag wave, I believe Bitcoin has enough gas left to reach a range between $120,417.33 - $329,945.48. I suspect this target range could be reach between November 2024 and March 2025 (see the " Numbers and Levels to Consider " section below for reasoning).
Numbers and Levels to Consider:
1st Zig-Zag wave -- [ shown in light green ]
Bitcoin's initial 5 wave move (Wave A) grew by 313543% from ATL.
313543% x 1.618 (common length for Wave C when compared to Wave A) = 506,166%
From the bottom of Wave B in light green, C wave grew by 537084% (a bit more than 506,166% but quite close).
Considering this 1st zig-zag wave to have ended near $1201 , a 1.618 target from here points to $1,490,778.00 . 1.618 is a common extension level for where the 2nd zig-zag could terminate).
2nd Zig-Zag wave -- shown in light blue
Bitcoin's initial 5 wave move (Wave A) of this apparent zig-zag grew by 10576% .
Wave C (yet to fully develop) has two common termination points:
1) equals to 100% the size of Wave A (10576%). With Wave B ending slightly below $3,000, this would give Wave C at termination target near $329945.48 .
2) equals to a 1.618 extension compared the size of Wave A ; giving Wave C another possible target of $296716.57
Wave C within the 2nd Zig-Zag wave -- shown in white
Knowing that Wave C is a 5 wave move and considering the vertical range of Wave 4 (shown as a flat correction in yellow), common targets for the 5th wave are between 1.38 and 1.618 on fibonacci scales. With 1.38 pointing to an extension of $120,417.33 and the 1.618 extension pointing to $172181.44 , there are also levels worth keeping in mind.
In total, Elliott Wave rules and guidelines present us with 5 potential target levels for the potentially last upside swing in this form, being:
$120,417.33
$172181.44
$296716.57
$329945.48
$1,490,778.00 (this number seems like more of the anomaly here. Doubtful its reached.)
Beyond this phase Bitcoin should/could be due for another (more drastic) Crypto Winter. Based on the rules and guidelines of Elliott Wave Theory, I believe the downside target could very well drop below $10. At worst case, it becomes the next Luna-Bomber! Permabulls, Diamond Hand(ers) and HODLers should mentally condition themselves to protect capital and to remain loyal to the same. The main points to take away from this idea are:
1) Bitcoin is 1000% NOT in an Impulsive Wave structure.
2) In the traditional sense of price action, Bitcoin has not built any horizontal base.
3) Bullish corrective waves typically retrace 61.8%-89% on average .
**Current upside and downside targets are based on the idea that $15,501 will continue to hold as the regional low. If this low is broken, further analytical assessments must be made. Bitcoin's structure will not suddenly become impulsive in any regard. Surf well and avoid all major, time consuming drawdowns.

Crypto winter almost over , #BTCUSD to breakout 69k in Nov 2023More data leads to more accurate analysis and forecast. According to my last #bitcoin forecast which was published on tradingview (Link down below) on May 26th 2022, I was expecting a down move to 11.000$ before finding bottom. But more data has prevailed since then that leads me to believe that we have found a bottom and we are aiming for another up (25k - 27k) and down (16k - 18k) and start another #bullrun from february 2023 to breakout the 69k high of 2021. What do you think?

#Bitcoin bottom in? Look at the similarities between 2022 & 2015Everything is crystal clear on the chart, but where do you think bitcoin will top on number 7?
24k to 27k is really possible....

Bitcoin: Momentum Looks Toward Liquidity Near $27K-$29KWith a 70% drop in value over the past 8-10 months, its easy to understand why many traders consider price levels of $3K, $10K, $14K, $16K and even $0.00 as appropriate at this time. Relying solely on Bictoin's price structure, even to consider the waves from its all-time low, I find all of the above mentioned targets as doubtful in the least (though I have been wrong before).
As my prediction was made weeks ago, I yet expected Bitcoin to find very solid support above the $18.6K level and am hesitant to consider other macro, bearish alternatives without this being negated. Still sitting nicely within its apparent Leading Diagonal pattern, wedge Wave 4 should conclude very soon, likely within the next 48 hours. Also considering the guidelines of a Diagonal Wave, which many also classify as Wyckoff, the next upside swing should be at least $6503 in length, pointing us minimally to low $26K. Looking at the current upside trend line, one could also see why $29K would be attainable.
The distant ranges of traders' emotion are currently on full display. At $17K most people thought gloom, I was too undecided a bit here but shortly after the pump initiated and I found some invalidations for more downside, my sentiment has since been bullish. At $25K, certain bulls proclaimed that price was heading back into the $30Ks and beyond. The Digital Surf Trading Community was in total expectation of a drop to the $20K range. Now that we're below $20K, the sentiment of gloom and fear has yet returned. With the theory of Support and Resistance, traders feel that a drop below $20K is a very very big deal. TradingView and mainstream news articles only help to cement this bias. In the grand scheme of price action however, $20,000 is simply just another number, though definitely a psychological level when looking at the bare naked number.
Should the target range of $27K-$29K be actualized, fully expect a retest near $21.5K, though there is slim chance that support could be discovered above this level.
Based on Fib levels and my personal wavemapping, $18.6K is the only major level in the current range. If Bears can't strike below it, Bulls are largely yet in control. As said weeks ago, Crypto Winter has concluded and Crypto Spring is upon us (unless $18.6K breaks).

#Cardano Big picture... back to the Teens#ADA's recent price performance has been extremely weak to say the least.
And unlike many other stronger #Alts is testing and breaking the June lows.
No comment on the Technology , (strengths or shortcomings) of the ecosystem.
Simply observations from a Technical perspective,
This coin has given plenty of opportunities on the upside, as shown by the previous bear market inverse head and shoulders / double bottom. Which made target with over-performance.
Exactly what you need to comfortably exit your holdings accumulated during the winter period.
Which takes us to the final leg down NOW...
setting us up for what I believe could be an epic final drop.
I would not be surprised to see it back to 10 cents area (maybe high single digits, in a great unwind)
@TheCryptoSniper

MATIC - Watch For Completion 🚀MATIC has almost completed its bearish correction. We are now on the final 5th wave (subdivided into 5 waves)
There is still a chance to get in on the final shorts with hard stops above the blue structure.
The bigger trade will be getting in on the bullrun. Expecting price to go below the recent lows to fulfil the wave 5 criteria.
Trade idea:
- Watch for 5 subwaves moving down
- Mark out the 4th and 5th wave correctly and watch for a breakout
- Target the recent highs and HODL the rest.
It's going to be a big one!
Goodluck and as always, trade safe!

$BTC - 🚨Market Update🚨 - 08/29/2022$BTC 👀 - 🚨Market Update🚨 - 08/29/2022:
📌 As anticipated, #Bitcoin
performed a #Wychoff
#Accumulation
cycle over the weekend. Of the which, simultaneously completed our Wave 5, in black, of the Minor #ElliottWave
degree.
📌 Combining both concepts of Wave 5 from ElliottWave and Wchyoff's Accumulation schematic, I have even more reassurance to place various #BuyOrders
at different (discounted) price points over the weekend.
📌 In my opinion, I anticipate Bitcoin (as well as $ETH
) to complete a #bullish
ABC correction upwards towards the #GoldenZone
, range of $23,026.89 to $22,359.54, before reversing and starting Wave (3), in blue, of the Intermediate #ElliottWave
degree.
💎 Furthermore, as you can see by the "x3🐑" on the chart. The Golden Zone serves as an excellent point of interest for institutional investors/traders because it is situated directly above sell-side liqudity (collection of stop losses waiting to be hit to introduce more money into the market and take out unsuspecting retail sellers).
💎 To View or Save My Chart:
#possabilities
#longterm
#buildandgrow
#invest
#invest
#buythedip
#staystrong
#accumulation
#evs

Bubble Trouble: A Multi-Decade Bitcoin Prediction (BTCUSD)Admittingly, I am beyond fascinated by the structure and massive growth that Bitcoin has seen over the years. I don't mind acknowledging the fact that I was late to crypto and trading too, to an extent. My missing of the initial take-off has nothing to do with this prediction and I share it with no bias at all.
While I do believe that cryptocurrencies are now a staple in the world's financial system, I have little faith that Bitcoin will forever remain as the most dominant currency within the market. I say this solely because of BTCUSD's price structure and current wavemapping. I don't follow news too closely nor do I heavily consider many factors outside of the chart itself.
The use of Elliott Wave Theory allows me to minimize any personal bias and follow a close set of rules/guidelines to help find tremendous probabilities, both bullish and bearish in nature. Surely, I am familiar with the term bull and bear , but I regularly subscribe to neither. Rather, I surf wherever the profits may take me.
So now you know a bit about my logical stance, let's talk specifically about Bitcoin.
Having surged 202875423 % since its inception, its easy to fall in love with the allure of its massive, historical strides however, I find an issue with Bitcoin not having made its proper corrections earlier in its journey. With a very dismal 38% correction after its rise to $31, one could consider this as a Wave 2 correction despite not reaching common retracement levels. The hypothetical Wave 2 also failed to erase the previous Wave 5 within primary Wave 1. There are no rules that dictate these actions as being invalidation indicators but they both go against what's most frequently observed (within impulsive waves).
Rather than considering the correction from $31 > $2 as Wave 2, logically I place this as a Wave B correction.
After B wave's termination, naturally its my expectation that C wave has then started. Usually within a diagonal wedge, I have the tendency to assume C wave will generally be a smaller diagonal pattern but its totally eligible to be in impulsive wave as well. Hint: A diagonal wave is constructed of 5 zig-zag waves.
The anatomy of a zig-zag is that both A and C waves have to be 5 wave moves. The are two options for 5 wave moves in Elliott Wave Theory - Impulsive or Diagonal waves . A zig-zag can have two impulsive waves between A and C but cannot have two diagonal waves between A and C (see below) .
As stated in the image above, I believe that Bitcoin is currently in a wedge formation with Wave 1 being constructed of a zig-zag with two impulsive waves (A + C). Currently moving through the (C) wave of Bitcoin's primary first wave, I believe that we are more precisely within Wave (a) of Wave 4 - within (C) wave of Bitcoin's primary first wedge-wave. Based on my perception, the anatomy of (C) wave can be seen here:
As for Wave (a) of Wave 4, within (C) Wave (the current downside swing from $67K), I think that Bears will retain momentum until we strike the $11K-12K range. Placing the Fib tool on this specified range, it gives indication that Wave (b) of Wave 4 is likely (not promised) to reach between $103K-$136K by early 2024; a 10x wave. Also placing the Fib tool on the range of $11K to $136K, a possible range for Wave (c) of Wave 4 can be determined as $2355 to $6255; a 95% drop - possible to come by early 2025.
If this drop does pan out, it will be very painful for not only Bitcoin holders but likely the crypto community as a whole - only for a brief period of time. We Elliotticians know that after Wave 4's correction, new heights are generally seen within Wave 5 (aside from truncated Wave 5s). Using the Fib tool to measure the total price range of Wave 4, we can also gather possible levels for the hypothetical Wave 5 that should come.
What target range do you think we'll see? Ready for this () ?
The idea of Bitcoin hitting $1,000,000 by the year 2027 may seem farfetched to some. The idea of Bitcoin falling from $1,000,000 to $10 will surely seem farfetched to the rest but by 2030-2032 I expect this to come to fruition. From this level, I believe Bitcoin will initiate its next bullish wedge wave which should should once again hit astronomical levels, maybe near $1,700,000. Who knows!
The alternative to this idea is that Bitcoin gets Luna-bombed and drops from $1,000,000 to $0! For more actionable, daily and near real time analysis, join me on the waves (and don't forget your surfboard). No updates will be shared under this post; see my TradingView bio and let's connect.

BTCUSD SWING SHORTBTC on the weekly chart is in a persistent downtrend for this year.
In recent weeks, a bit of a bear market rally has occurred and
stochastic RSI is now at or above 80 while the MACD has K and
D lines touching. The weekly candle is a red Doji.
I see this as about the same as the pattern of early April.
I conclude that BTCUSD's bear market rally is complete
thus setting up another swing short trade to be taken.

$BTC (Bitcoin) - 1hr Analysis - Elliott Wave TheoryThis is an example of how within one set of waves, smaller fractal waves exist.

$BTC (Bitcoin) - 15 Min AnalysisI am expecting Bitcoin to continue it's downward pursuit, as we slowly but surely are making our way to the completion of the corrective wave c (of larger corrective wave B).
In the near short-term, I am spotting some institutional points of interest such as #imbalance and #Liquidity. It also appears to be performing another potential ABC Flat Irregular/Expanded Flat.
This would fit my narrative, as it would provide for a perfect liquidity sweep (aka stop hunt for recent sellers, as well as for recent buyers), meanwhile it will clear up some imbalance price action caused when the price sold off too quickly.
This is for informational purposes; If you participate in the markets you are fully accepting those risks on your own.

BTC - 45 Min Chart Update - ExtensionPossible extension of Wave C (in the minute degree) of within the larger Wave B (in the Minor Degree).
Extensions can only occur within Impulse Waves 1,3, & 5, therefore extensions can also occur within Waves A & C of corrections.
Extensions, are better known as nested waves. As we know that within Elliott Wave theory rules, Wave 4 cannot overlap with Wave 1. Thus, if the anticipated wave 4 overlaps with the previous Wave 1, then anticipated Waves 3 & 4 need to labeled as Waves 1 and 2 (again) but in the next lower degree.

BTC (Bitcoin) - 15 Min - CryptoUpdateAs of July 23rd, 2022 @ 11:36AM (MST)
#Bitcoin is to complete the smaller #fractal #corrective wave 4 (in red) and #impulse wave 5 (in red), within the bigger corrective wave (c) .
Once Bitcoin reaches the green #shortterm #buying #accumulation zone, we would expect a #wychoff schematic of #accumulation to take place #signsofweakness, #lastpointofsupport, #fakeout (or aka #liquiditygrab or #stoprun) before the bigger corrective wave (c) of #waves begins.
Link to Previous 1hr chart: https://
