Bitcoin From 2010 to 2025: Not An Impulsive Wave (edited)
A follow-up to my pervious invalidated long term idea of BItcoin reaching $3,000,000 within the next decade..
(to state it explicitly, this idea has largely been invalidated by further review of Bitcoin's macro price action).
This idea will be largely contrary to my previous. Based on a number of subtle signals discovered through Bitcoin's price action review, I feel at liberty to say that there's is no way that BTCUSD is structured in an Impulsive Wave format. Its expeditious growth has not once made a sizeable enough correction to satisfy a Wave 2 requirement - not one time. Generally, we expect Wave 2 to retrace at least to the 50% fib level, the most we've seen for Bitcoin (on the fib scale is 38%). Corrections to the 38% fib level are very commonly seen within Wave B (or Wave X) in certain cases. Whether it be Wave B or Wave X, such labeling only comes within corrective wave forms. Zig-Zags (the most common corrective wave type) notoriously travel much faster than Impulsive waves as well. At its current price level, Bitcoin has grown 1969928%, in a matter of 13 years. We could easily classify this as a much faster pump than we've typically seen outside of the OTC Market (and we know what follows these outrageous pumps in a lot of cases...)
Seemingly in a Bullish Double Zig-Zag wave, I believe Bitcoin has enough gas left to reach a range between $120,417.33 - $329,945.48. I suspect this target range could be reach between November 2024 and March 2025 (see the "Numbers and Levels to Consider" section below for reasoning).
Numbers and Levels to Consider:
1st Zig-Zag wave -- [shown in light green]
Bitcoin's initial 5 wave move (Wave A) grew by 313543% from ATL.
313543% x 1.618 (common length for Wave C when compared to Wave A) = 506,166%
From the bottom of Wave B in light green, C wave grew by 537084% (a bit more than 506,166% but quite close).
Considering this 1st zig-zag wave to have ended near $1201, a 1.618 target from here points to $1,490,778.00. 1.618 is a common extension level for where the 2nd zig-zag could terminate).
2nd Zig-Zag wave -- shown in light blue
Bitcoin's initial 5 wave move (Wave A) of this apparent zig-zag grew by 10576% .
Wave C (yet to fully develop) has two common termination points:
1) equals to 100% the size of Wave A (10576%). With Wave B ending slightly below $3,000, this would give Wave C at termination target near $329945.48.
2) equals to a 1.618 extension compared the size of Wave A; giving Wave C another possible target of $296716.57
Wave C within the 2nd Zig-Zag wave -- shown in white
Knowing that Wave C is a 5 wave move and considering the vertical range of Wave 4 (shown as a flat correction in yellow), common targets for the 5th wave are between 1.38 and 1.618 on fibonacci scales. With 1.38 pointing to an extension of $120,417.33 and the 1.618 extension pointing to $172181.44, there are also levels worth keeping in mind.
In total, Elliott Wave rules and guidelines present us with 5 potential target levels for the potentially last upside swing in this form, being:
$120,417.33
$172181.44
$296716.57
$329945.48
$1,490,778.00 (this number seems like more of the anomaly here. Doubtful its reached.)
Beyond this phase Bitcoin should/could be due for another (more drastic) Crypto Winter. Based on the rules and guidelines of Elliott Wave Theory, I believe the downside target could very well drop below $10. At worst case, it becomes the next Luna-Bomber! Permabulls, Diamond Hand(ers) and HODLers should mentally condition themselves to protect capital and to remain loyal to the same. The main points to take away from this idea are:
1) Bitcoin is 1000% NOT in an Impulsive Wave structure.
2) In the traditional sense of price action, Bitcoin has not built any horizontal base.
3) Bullish corrective waves typically retrace 61.8%-89% on average.
**Current upside and downside targets are based on the idea that $15,501 will continue to hold as the regional low. If this low is broken, further analytical assessments must be made. Bitcoin's structure will not suddenly become impulsive in any regard. Surf well and avoid all major, time consuming drawdowns.
Comment:
Collectively, double zig-zags should be labeled as WXY being that they contain two corrective waves (excluding the X/mid/connector wave).

Comment:
Assuming that top is found near the white/blue lines, we can see where a 0.618-0.89 retracement on the fib scale would bring Bitcoin down to:
Comment:
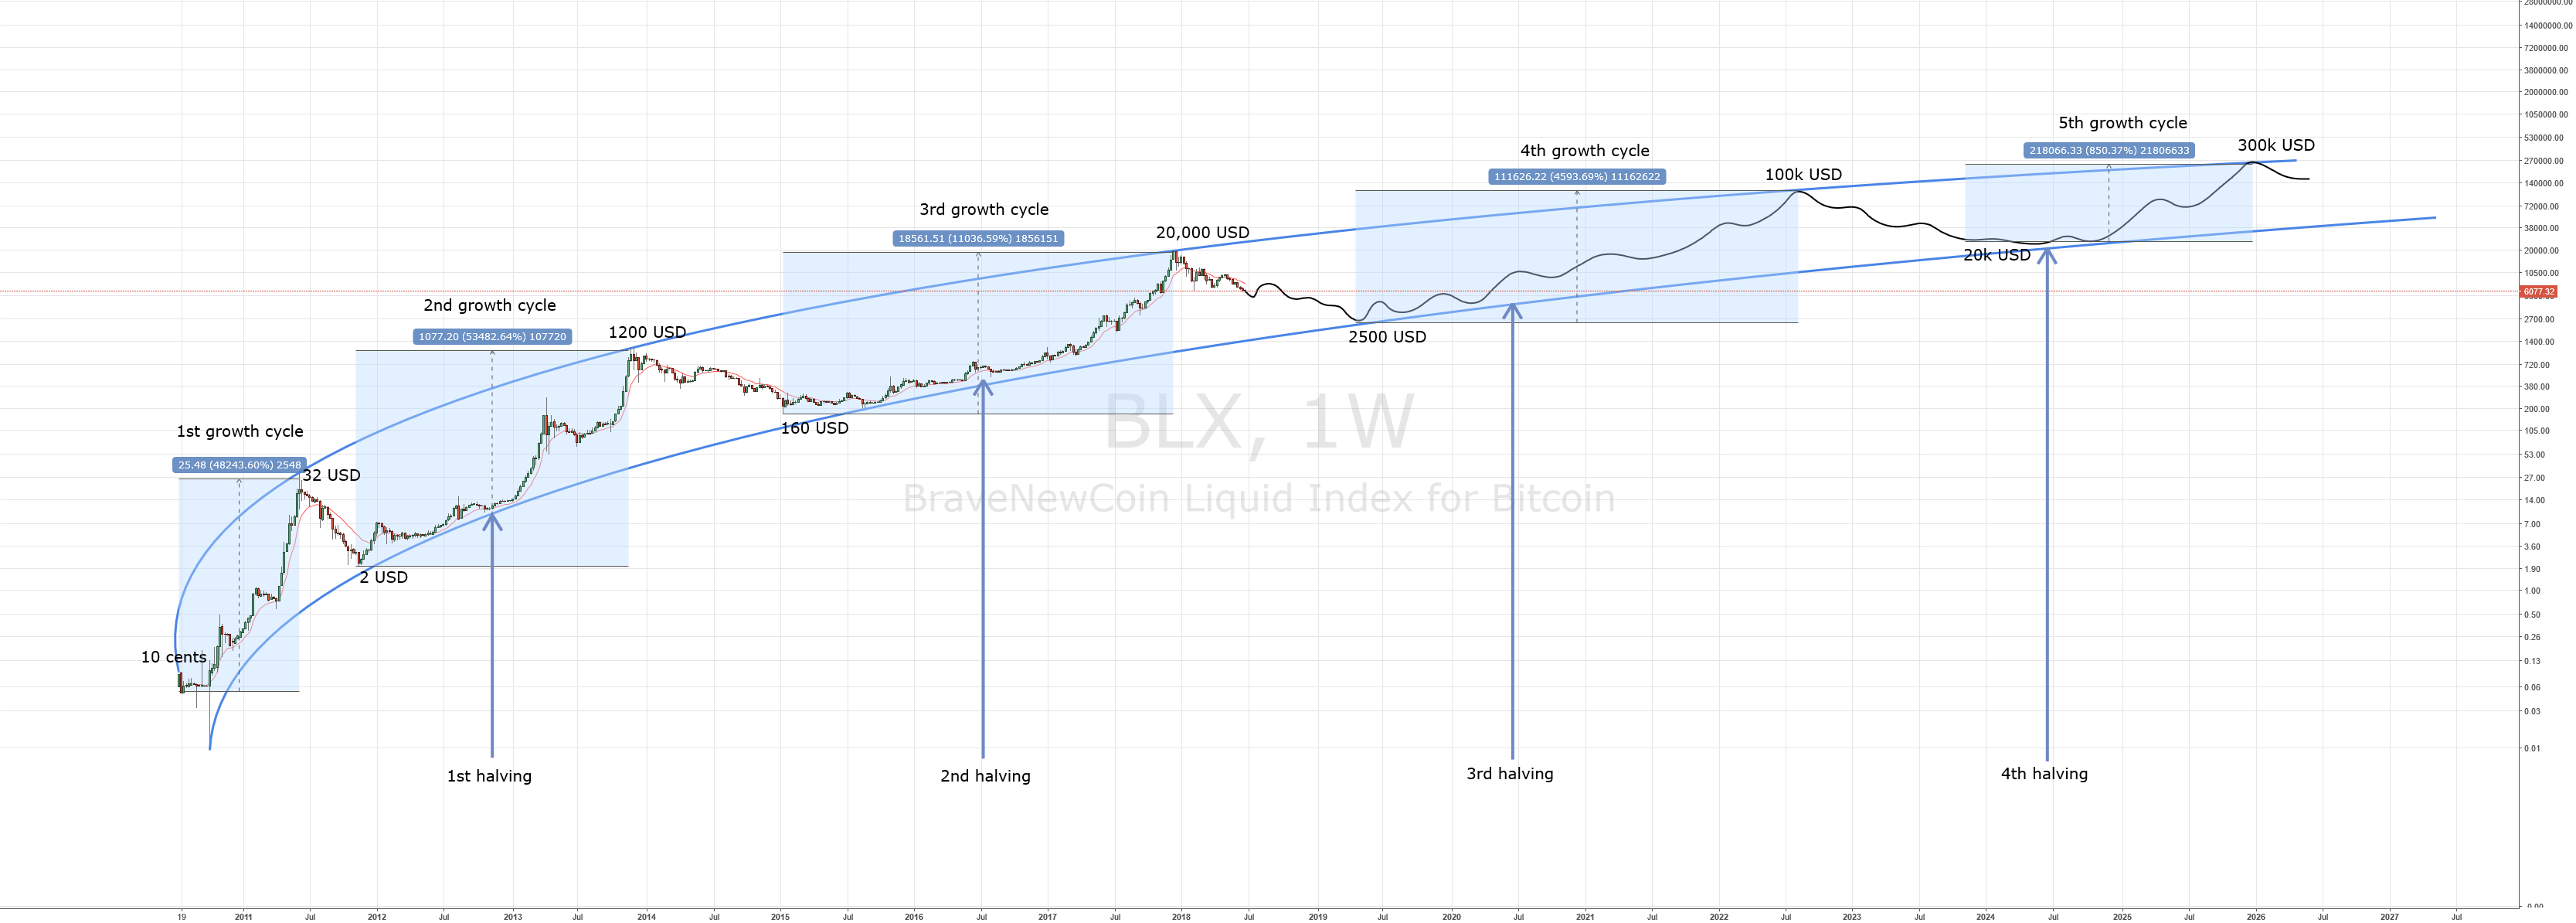
If "ignorance is bliss" was a Bitcoin chart:
I've often times seen this image shared around as it if meant that Bitcoin is on an unstoppable route. We've all heard the term 'bubble' before and nothing resembles it more than this chart.
My point in sharing this is just to say and show once again, from a different angle/perspective, Bitcoin is most definitely not in an Impulsive wave. That should be a troubling revelation for anyone who has bought Bitcoin above $100 and plans to hold it for decades.
Comment:
I think its quite probable for Bitcoin to undergo a very chilly, 2-3 year bear market between the years of 2025 and 2028 roughly.
Comment:
Ignore the typo for "previous" (typed as pervious).
Comment:
Fun fact: Bitcoin's monthly RSI has been under bearish divergence since 2013.
Comment:
To highlight the possibility and logic behind a potential/likely $360,000 price tag for Bitcoin in 2026-2027.
Comment:
The most fascinating chart of all. A beautiful disaster....
Sharing chart analytics to build the world's most profitable investor community. Free to join below! 0 strings attached.
🏄 www.discord.gg/QRPx6ShxMt
🏄 www.discord.gg/QRPx6ShxMt