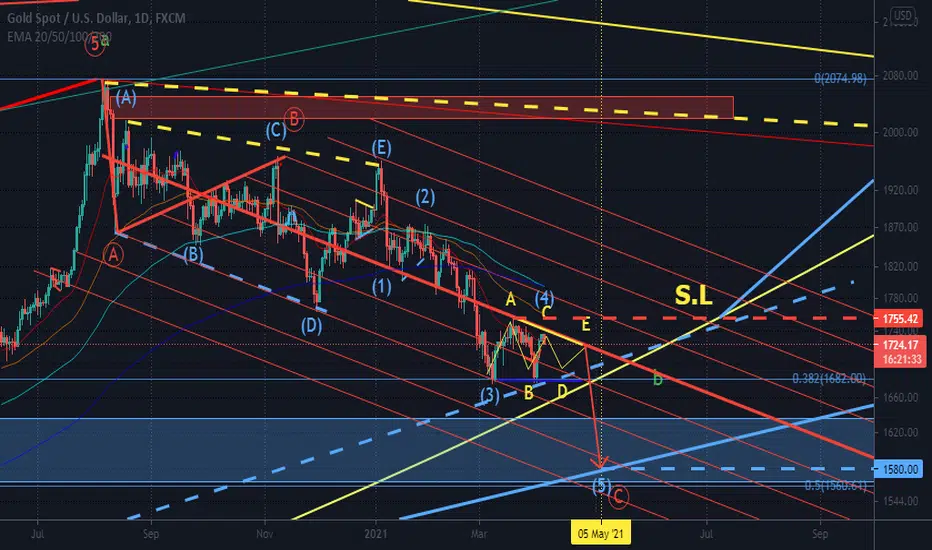
GOLD short for bearish triangle. Updated 5 April 2021SL @ around 1756 .. TP @ around 1580 detail @ The Chart.. While everyone waiting for 10 year_treasury reaching 2% rate
Cycle
Is XRP ready to MOON?????We should get some real volum soon as xrp gets listed everywhere again #RELISTXRP
"What has been will be again,
what has been done will be done again;
there is nothing new under the sun."
Ecclesiastes 1:9
Thank you!

Bearish Cycle in the MarketBearish Cycle in the Market
1) "market maker spread" is the maximum and minimum of the initial channel. This is usually 25-50 pips high.
2) "Stop Hunt" usually consists of three movements that can occur in a short time.
Three impulses will be marked on the "live" candle.
The end of the stop hunt results in the extreme value (LOD) of the cycle and gives the first signal of where the reversal will occur.
3) "Zone Shift" is a movement intended both for accumulation and for keeping the trading volume concluded at the maximum of the price movement.
According to my observations, I can say that after the "Zone Shift" consolidation is formed, volume continues to accumulate. In these places, you can just look for an entry point.
4) A large impulse move during the initial channel may still be worked by resetting the initial channel hi / lo AFTER the move occurs and then looking for stop runs from the reset channel.
5) Correct entry in the second stage with “peak formation” will use the “zone shift” to take profit.
6) Use the bigger picture (1 hr & 4 hr time frame) to identify levels for possible entries. At the lowest level (15min), take trades ONLY from the LOD / HOD.
-------------------------
Additionally:
Duration of consolidation after stopping hunting before HOD / LOD
Difficult to define. We do not know how long a major player will take to gain a position and we do not know how much volume he needs.
A) The previously accumulated volume can be quite large, so no consolidation is required and a V-shaped bottom occurs.
B) Additional time may be required to accumulate volume .
C) Additional time may be required followed by the expected search for a second stop (wide W-pattern)
-------------------------
Share your opinion in the comments and support with likes.
Thanks for your support!

Bearish Cycle in the MarketBearish Cycle in the Market
1) "market maker spread" is the maximum and minimum of the initial channel. This is usually 25-50 pips high.
2) "Stop Hunt" usually consists of three movements that can occur in a short time.
Three impulses will be marked on the "live" candle.
The end of the stop hunt results in the extreme value (LOD) of the cycle and gives the first signal of where the reversal will occur.
3) "Zone Shift" is a movement intended both for accumulation and for keeping the trading volume concluded at the maximum of the price movement.
According to my observations, I can say that after the "Zone Shift" consolidation is formed, volume continues to accumulate. In these places, you can just look for an entry point.
4) A large impulse move during the initial channel may still be worked by resetting the initial channel hi / lo AFTER the move occurs and then looking for stop runs from the reset channel.
5) Correct entry in the second stage with “peak formation” will use the “zone shift” to take profit.
6) Use the bigger picture (1 hr & 4 hr time frame) to identify levels for possible entries. At the lowest level (15min), take trades ONLY from the LOD / HOD.
-------------------------
Additionally:
Duration of consolidation after stopping hunting before HOD / LOD
Difficult to define. We do not know how long a major player will take to gain a position and we do not know how much volume he needs.
A) The previously accumulated volume can be quite large, so no consolidation is required and a V-shaped bottom occurs.
B) Additional time may be required to accumulate volume.
C) Additional time may be required followed by the expected search for a second stop (wide W-pattern)
-------------------------
Share your opinion in the comments and support with likes.
Thanks for your support!

BTC CYCLESAs you can see, there is a pattern of tops and bottoms on BTC if we look on the logarithmic scale with fibonacci settings also on log. If this patterns continues we gonna have the next top on 200.000 area and the next bottom to 60.000 area. We have no reason to believe this pattern is broken so let’s see if and when we go there.

FEDFUNDS - Will See Light Again!I am not a fundamental expert (nor an economist) but I found FEDFUNDS chart really interesting!
I never thought that basic technical analysis tools can also be applied to such economic instruments!
From a technical perspective, FEDFUNDS has been bearish for a while making lower lows and lower highs.
For the momentum to be shifted from bearish to bullish, as mentioned in the title "see light again", FEDFUNDS has to break above the last swing high. (highlighted in gray as trigger)
It would be interesting to hear your thoughts on this one.
~Rich

SPX's Elliott wave ABCDE grand cycle count. 1970s-2021Since 1957 inception's day we got 2 ABCDE waves we illustrate the similarities here. Nothing stands out, but if we
can rhythm with the past we got our selves a years of bull market.

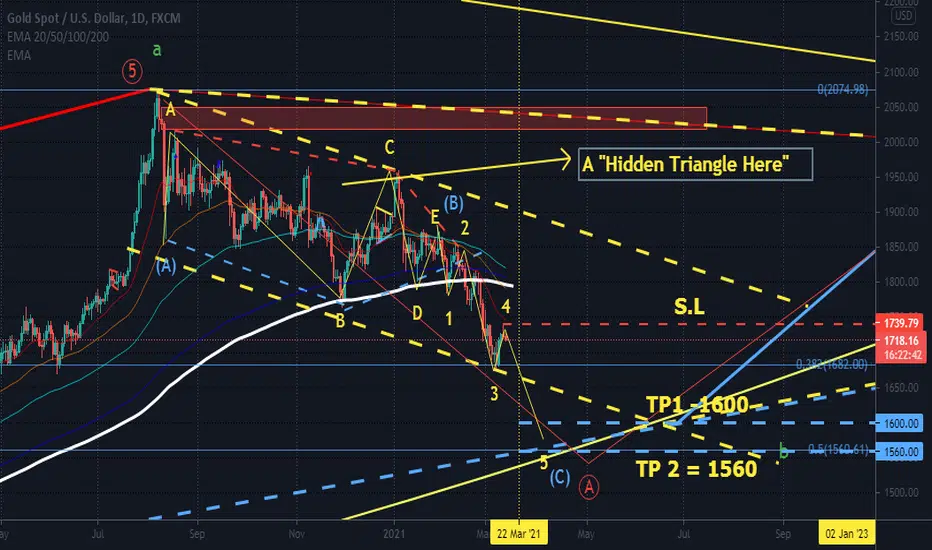
GOLD Short Term waves updated 12 March 2021Gold Final Leg Down of Wave A (red, circled ) of Triangle.. Tp 1 @ around 1600, Tp 2 @ around 1560 ( which is Fibo 0.50 % from Dec 2015 low, The Cup bottom line / parabolic arc line, weekly trend line muti - confluence zone/area ) , Sl @ 11 March 2021 High...
KLCI Future updated 15 March. 2021FBMKLCI Future might still forming expanding triangle, Stop lost for long would be around 1550, TP @ around 1760 as chart shown above..

Gold might still inside Big Bermuda Triangle 12-03-2021Referring To Time "Duration Spent " on The Cup, The Handle of The Cup Might Take Few years ( 2- 3 years ) to "complete"

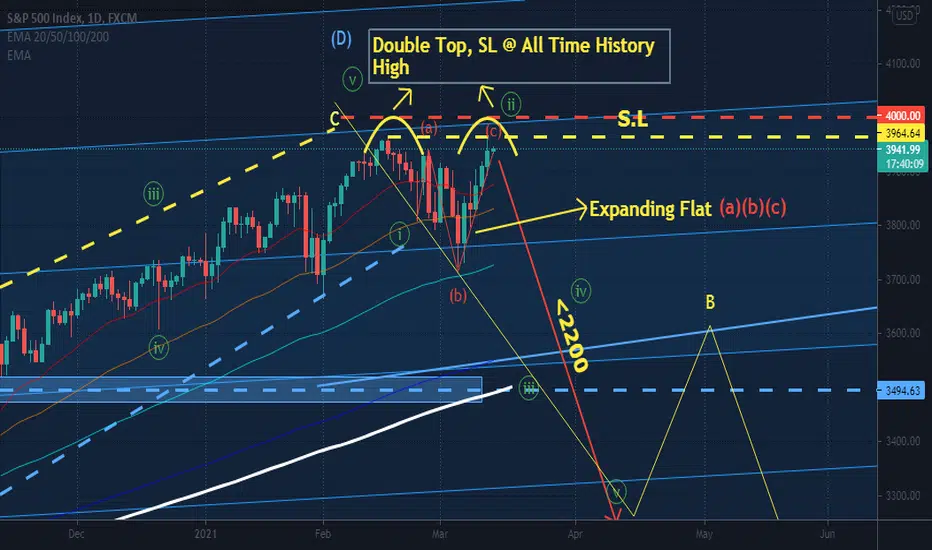
SP500 Possible Forming Double Top @ 12 March 2021After Biden Administration $1.3 Trillion Stimulus plan.. Biden Might Impose Higher Corporate Tax...
Bitcoin Market Cycle Forecast for the Next Two Halving EventsThis is what I foresee in BTC/USD in terms of long-term market cycle trends between now, the next halving (currently projected to be on May 27, 2020), and the halving after that (currently projected to be between March 2024 and June 2024).
The dotted lines mark past halving dates as well as the projected 2020 and 2024 halving dates.
Bitcoin market cycles have corresponded to each halving. Since the advent of Bitcoin , all Bitcoin halving dates have been followed by bull markets, which are then followed by a bear market and accumulation periods. Given the current long-term trend of Bitcoin's lifetime market patterns, each bull market should be less extensive than the previous bull market. That being said, patterns can always be broken, and this cycle is no exception, regardless of its longevity.
I do not hold any Bitcoin at the time of writing (June 5th, 2019).
Do your own research.

BITCOIN CYCLESPotential top around 200k $
Potential bottom before next cycle around 50k $
DYOR, it's only chart

GBP/CAD - Price residing in interesting spotPrice cycled downwards, currently residing at a key level in price and a trendline test. Lets see how this 4HR closes.
Simple structure on the HTF. Identify trend and key levels.

Don't worry about BitcoinBitcoin is still in up channel and it needs to make a lowSo to make an another low, Bitcoin needs to retrace and right now(2/24/2021) BTC is experiencing a corrective wave.] Also Bitcoin is experiencing a bearish candle in weekly time frame.
Based on fib retracements , Important support zones are:
Zone 1: 45100 - 44500
Zone 2: 42230 - 41700 (chance to return from this zone)
Zone 3: 39600 - 39000 (difficult to break out this zone)
Zone 4: 37400 - 36700
Zone 5: 34500 - 33400
Zone 6: 30000 - 29200
This is not an investing or trading idea, This is just an analysis for BTC recent corrective wave.
Do your own research and remember risk management is the key of success in financial markets.
Thanks for your time
Comment your idea and let me know what you are thinking

