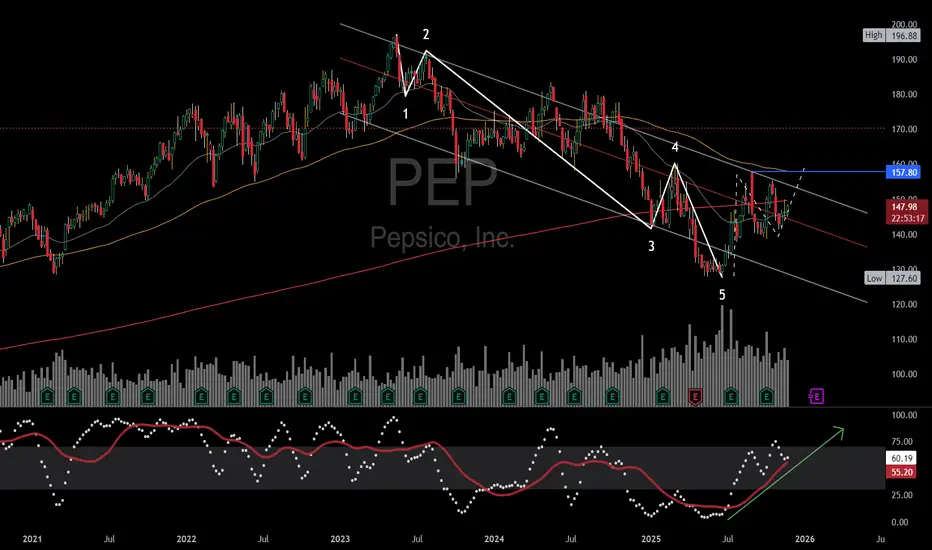
PEP Wave Analysis: The OverviewPepsiCo has been declining for the last 2 years. The impulse pattern down to a 5-year support level was influenced by higher interest rates; comparing PEP to the US10Y will show this relationship. I remember "Higher-for-longer" being the main idea behind the 3rd wave down, and we saw that pin, in the 5th wave, at a large support level with a strong reaction.
My initial thesis was $170 and I still believe that to be a large inflection point. I am looking for daily closings above the 157.8 pivot for a longer hold towards $170.
I added the Stochastic indicator to represent the divergence in price to momentum. Getting above the upper trend line (about $154) will open the door to the 120ema (sourcing the highs).
The 400sma (red line) shows the dominant trend is still upwards. Price has traded beneath this moving average for some time. It looks like a Head & Shoulders pattern is forming around this longer-term support level. A weekly close above the wave 4 pivot high can activate a thrust into the larger consolidated range.
2026 will prove to be an important year for cyclicals, in my estimation.
Cyclical
Cyclical Stocks vs Non-Cyclical Stocks: How Can You Trade Them?Cyclical Stocks vs Non-Cyclical Stocks: How Can You Trade Them?
Not every stock is created equal. One of the biggest distinctions is cyclical vs non-cyclical—those that grow or decline alongside economic conditions and those that are less sensitive. In this article, we explore the key differences between the two, how to analyse both, and how to trade them.
What Are Cyclical Stocks?
Cyclical stocks are those that rise and fall in line with the broader economy. They’re more sensitive to consumer spending and include those in the travel, automotive, construction, and luxury goods sectors.
Simply put, when consumers have more disposable income, they’re likely to buy new cars, travel abroad, or invest in home improvements. Demand boosts corporate earnings and pushes share prices higher. However, when consumers have less money or face economic uncertainty, they reduce and delay spending on these discretionary purchases, dampening company earnings and stock valuations.
Nike and Starbucks are good examples here—both are cyclical companies that see higher demand when consumers are in a stronger financial position and feel comfortable purchasing brand-name clothes or buying coffee on the go.
Cyclical stocks tend to be more volatile than non-cyclical ones. Their sensitivity to cyclical business conditions offers potential opportunities for traders to capitalise on a growth phase, but timing matters—getting caught in a temporary or prolonged downturn can lead to sharp drawdowns.
Cyclical Sectors
- Automotive
- Airlines & Travel
- Luxury Goods & Apparel
- Construction & Materials
- Banking & Financial Services
- Technology & Semiconductors
- Restaurants & Entertainment
- Retail (Discretionary Spending)
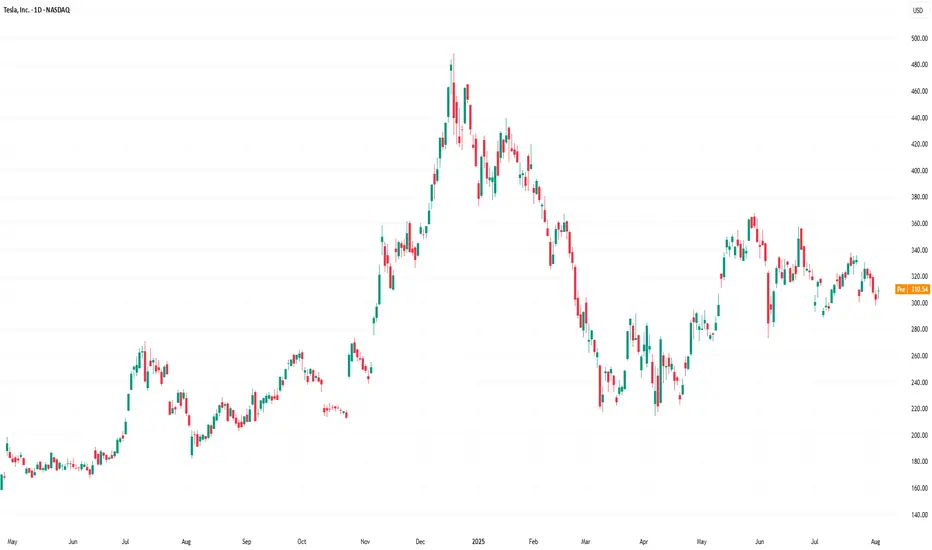
Is Tesla a Cyclical Stock?
Yes, Tesla is a cyclical stock. Demand for electric vehicles moves in line with economic conditions, consumer spending, and interest rates.
Is Amazon a Cyclical Stock?
Amazon is partly cyclical. Its retail business depends on consumer spending but its cloud computing division (AWS) sees constant demand and provides diversification.
What Are Non-Cyclical Stocks?
Non-cyclical stocks belong to companies that sell essential goods and services. Contrasting with cyclical stocks and their sensitivity to consumer spending, non-cyclical companies sell things people buy regardless of economic conditions. They’re often referred to as defensive stocks because they tend to hold up when the economy weakens.
Non-cyclical sectors include healthcare, utilities, and consumer staples. Supermarkets, pharmaceutical companies, and electricity providers see relatively steady demand because people still need food, medicine, and power whether the economy is growing or contracting.
For example, consumer non-cyclical stocks, like Procter & Gamble, which owns brands like Oral-B, Charmin, and Gillette, continue to generate revenue year-round because consumers still buy everyday household items. The same goes for Johnson & Johnson, which sells medical products that hospitals and pharmacies need.
Compared to cyclical stocks, non-cyclical stocks are usually less volatile because their earnings are more consistent. While their potential returns are relatively limited vs their more growth-oriented cyclical counterparts, non-cyclical stocks are believed to not dive as sharply during a downturn.
Non-Cyclical Sectors
- Consumer Staples (Everyday Goods)
- Healthcare & Pharmaceuticals
- Utilities (Electricity, Water, Gas)
- Telecommunications
- Grocery & Essential Retail
- Defence & Aerospace
How Traders Analyse Cyclical Stocks
In a market where going long or short volatile cyclical stocks is an option (such as with CFDs), many prefer to trade them over non-cyclical stocks. More broadly, traders analyse a few key indicators to determine whether cyclical stocks are in a growth phase.
Macroeconomic Indicators
When GDP expands, businesses and consumers spend more, and free-flowing spending boosts demand in cyclical sectors. Similarly, interest rates determine spending on more big-ticket purchases, like cars, homes, and luxury goods. Lower interest rates encourage borrowing and vice versa.
Employment rates also play a key role. More layoffs and a higher unemployment rate mean consumers dial back purchases of discretionary goods and services. Employment conditions, along with economic and policy uncertainty, drive consumer confidence. When optimism is high, cyclical stocks often rally.
Earnings Trends & Sector Data
Unlike non-cyclical companies, cyclical firms see earnings fluctuate based on economic cycles. Traders pay attention to quarterly reports and especially forward guidance. If a company expects strong sales growth due to rising demand, this can drive its stock price higher and possibly signal an upswing in the sector.
Industry-specific data, like auto sales figures or airline bookings, is also a useful gauge for assessing the future performance of a company.
Market Sentiment & Seasonal Trends
Cyclical stocks are prone to seasonal patterns—retailers surge in the holiday season, while travel stocks perform well in summer. Market sentiment is another important factor; for instance, if economic uncertainty is growing but investors on the whole believe it to be a temporary blip, then cyclical stocks may still rise.
Analysing Non-Cyclical Stocks
While traders often favour cyclical stocks for their higher potential returns, many still turn to non-cyclical companies as a possible form of short-term defence against downturns, to balance a long-term portfolio, or when unique occasions arise (earnings reports, company-specific news, etc.).
Earnings Stability & Cash Flow
Since non-cyclical companies sell essential goods and services, their earnings tend to be more consistent. Traders look at revenue trends, gross margins, and free cash flow to assess a firm’s ability to generate relatively steady income. Consistent earnings—even during downturns—can be a marker of a strong non-cyclical stock.
Dividend History & Payout Ratios
Many non-cyclical stocks pay dividends. That makes them attractive for those looking for income-generating assets. A company with a long track record of consistent or growing dividend payments is often a sign of financial strength. The payout ratio (dividends paid as a percentage of earnings) is another metric traders examine—too high, and it could indicate unsustainable distributions.
Market Conditions & Defensive Rotation
If economic uncertainty rises, investors will generally shift into defensive sectors like healthcare, utilities, and consumer staples. Many will monitor fund flows—where institutional money managing exchange-traded funds (ETFs), mutual funds, and large portfolios is headed—to understand if risk aversion is growing.
Likewise, outperformance in certain sectors can be a signal. If sector indices like the S&P 500 Consumer Staples Index or the S&P 500 Healthcare Index outperform the overall S&P 500, it may indicate capital moving into non-cyclical stocks.
Trading Cyclical and Non-Cyclical Stocks
Now, let’s take a closer look at how traders engage with these stocks.
Short-Term Trading
Short-term traders generally focus on stocks or sectors expected to move over hours or days. One strategy might be to examine the broader conditions and trade ahead of earnings reports. If summer is approaching and the economy is doing well, Delta Air Lines could rise in the weeks before an earnings release as traders anticipate strong quarterly performance and positive forward guidance.
Another strategy is trading macro themes. If inflation rises, traders might focus on companies with strong pricing power, like consumer staples firms that can pass costs onto consumers. If economic data points to a slowdown, they might focus on healthcare stocks.
Medium-Term Trading
Medium-term traders take a broader view and typically adjust their portfolio weightings based on economic conditions. During expansions, they may overweight cyclicals like construction and travel stocks, while shifting into non-cyclicals as recession risks grow. That could mean just rebalancing a collection of ETFs, over/under-weighting a set of stocks, or a mix of both.
Here, the focus is usually on broader economic trends while also staying alert for possible strengthening or weakening consumer demand.
Long-Term Trading
Long-term traders often hold a mix of cyclical and non-cyclical stocks to maintain a balanced portfolio across economic cycles. While they may still adjust weightings over time, they tend to be more concerned with long-term sector trends and income generation.
With a longer time horizon, these traders may be more willing to allocate more capital to cyclical stocks during a downturn, especially to otherwise strong companies or sectors, to take advantage of potential rebounds months down the line.
The Bottom Line
Understanding the difference between cyclical and non-cyclical stocks is fundamental to trading them. Careful analysis—macroeconomic, sectoral, and company-specific—can help traders identify potential opportunities across all time horizons.
FAQ
What Are Examples of Cyclical Stocks?
Cyclical stocks include Tesla (TSLA), Delta Air Lines (DAL), Nike (NKE), Caterpillar (CAT), Marriott International (MAR), and Ford (F).
Which Industries Are Most Cyclical?
Highly cyclical industries include automotive, airlines, hospitality, construction, luxury goods, and consumer discretionary retail.
Is Coca-Cola a Cyclical Stock?
No, Coca-Cola is considered a non-cyclical stock. Demand for its wide range of products remains stable regardless of economic conditions.
Is Starbucks a Cyclical Stock?
Yes, Starbucks is a cyclical stock. Coffee purchases aren’t essential, so demand fluctuates based on disposable income and consumer confidence.
This article represents the opinion of the Companies operating under the FXOpen brand only. It is not to be construed as an offer, solicitation, or recommendation with respect to products and services provided by the Companies operating under the FXOpen brand, nor is it to be considered financial advice.
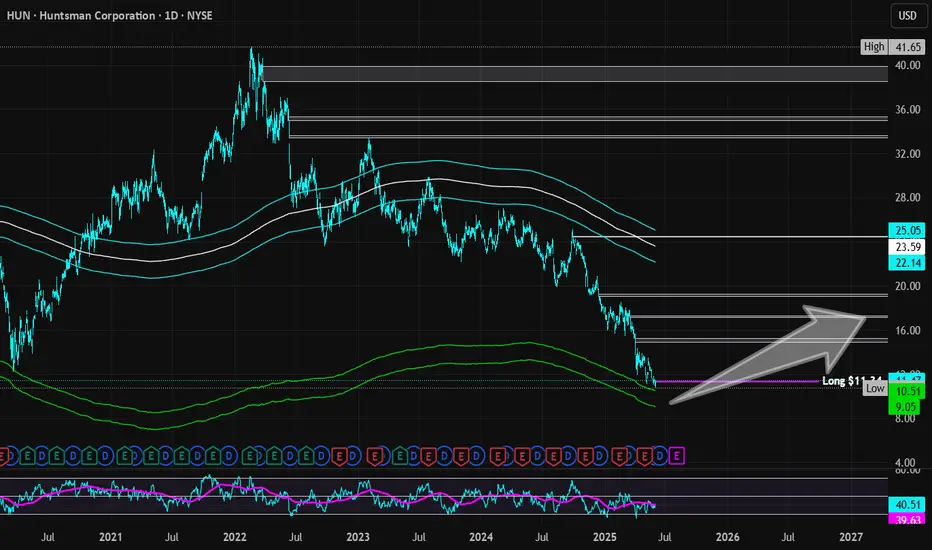
Huntsman Corporation | HUN | Long at $11.34The stock price for Huntsman Corp NYSE:HUN , a manufacturer of organic chemical products, has dropped significantly since its peak in 2022 ($41.65). This was due to lower sales volumes, weak demand in construction and transportation, higher input costs, and European operational challenges, including a $75M hit from closing a German Maleic Anhydride facility. This year (2025) is anticipated to be its worst earnings year, and the stock is priced as such. However, this stock is historically cyclical, and the company expects recovery / growth again in 2026. Moving forward, earnings are forecast to grow and the company is trading at good value compared to peers and the industry. While many headwinds may still exist with tariffs, etc., insider are grabbing shares and large options positions (very bullish). With a book value of $17, debt-to-equity at 0.8x, quick ratio under 1, etc., the company appears healthy.
From a technical analysis perspective, the stock price just barely missed my "crash" simple moving average area (currently between $9.00 and $10.50). It may reach those levels and below in 2025, for which I will add another position as long as fundamentals do not change. This moving average area often signifies "bottom" territory and historically, the stock has rebounded from this area. While my entry at $11.34 may be a little early, predicting true bottoms isn't my trading method and I hope to strengthen the position at lower trading prices.
Targets:
$15.00 (+32.2%)
$17.25 (+49.9%)
BTC Intraday Cycle ClustersThese are mathematically calculated cycle clusters based on hourly price and time data.
Cycle clusters can signal potential shifts in price action, including:
Changes in direction
Momentum shifts (acceleration or deceleration)
Breakouts
Gaps
Bold vertical lines indicate periods where more cycles are clustered. Dashed lines reflect clusters with fewer overlapping cycles.
I've also added some charting work—mainly channels—to help visualize and potentially trade the price movement between clusters and between channel lines.
Questions are welcome!

Lockheed Martin... Time to move?With tensions rising in the Middle East and the gaining of military activity here in the United States, it could be assumed that the government spending to grow the defense will mostly be seen by large defense firms. Specifically, we will be looking at NYSE:LMT but that doesn't rule out any other defense contractors from this trade ( NYSE:NOC , NASDAQ:HON , NYSE:RTX , NYSE:BA , NYSE:GD ). Firstly, let's examine the charts before reviewing anything fundamental from the company.
This is the 4h chart looking back into late-mid January
Simply put, this is just two of many possible paths that the NYSE:LMT price action could take. However, these two should be the most expected especially considering its violent downtrend that appears to be "cooling" and not "consolidating". It also appears that NYSE:LMT price action likes to reclaim any Fair Value Gap that it creates quite quickly as of recent trading terms. The good news is that two large FVG's have been created by a rather lackluster earnings report.
Now, as for a fundamental analysis POV, we can firstly examine the defense industry's cyclical movement throughout the years. This means that the industry is facing booms and busts. So lets see what the 1 week chart has to say about that...
With the chart shown above, you're probably thinking that a quick rebound seems unlikely as the other "BUST" sequences seem to last longer than the "BOOM" sequences. To this I would agree, however being first (or being early) is something I can settle for as there is no possible way to buy the exact bottom penny. When prompted with this dilemma of timing, think back to the Margin Call famous quote...
"There are only three ways to make a living in this business: be first ; be smarter; or cheat... it sure is a hell of a lot easier to just be first."

WRB RotationTesting a few technical indicators during a cyclical rotation here:
- Volume Profile
-- 50 day lookback "Quarterly PoC" | Price is at PoC
-- 100 day lookback "Power PoC" | Price is at PoC
-- PoC Price | Blue = Long
- 200 Day Moving Average
- provides baseline for Long/Short basis | Price > MA = Longs
- Volatility Radar
-- highlighted background indicates:
--- compressed volatility | Entry Allowed
--- trend intensity is showing a "weakening" bearish trend | Mixed on Direction
- 50 Day Moving Average
-- used as the ultimate exit after price goes above it
Good Luck!

BTC Market will make new hight of 140k after March 24, 2025As per the cyclic behavior of BTC, BTC will remain range-bound until March 24, 2025. Then, it will make a new high of 140k in the next 4-5 weeks.
How many of you agree with with me?

Is 2025 the last year of Bull run for Gold?Will gold fall $900-1200 in the next 5 years?
2025-2030 are the years of Crypto and not Gold.
Am I right?
Let's discuss...
Or maybe, 2025-2030 are AI revolution years.

A Bitcoin Prediction (2024)In this chart, I uncover price levels across an identified cyclical pattern hidden within Bitcoin.
I was initially hesitant to publish this, as I had been pondering the theory for a few days. However, as the price approaches the Phase 2 level, I believe the timing cannot be ignored, and a reaction may be imminent as Bitcoin could be on the verge of breaking out into Phase 2... I've posted a screenshot prior to where BTC is now (below)
My discovery in finding this was not intentional nor was it believable. However, after identifying some familiar projective price targets deriving from Bitcoin's first cycle the compelling results left me intrigued and were enough for me to continue. Whilst continuously applying my method more and more results seemed to match with key pivotable phases. Once I hit 2020, I was sure to expect some variances, but to my surprise, there was not, and price levels were again matched to pivotable levels. It is to that point I followed through into 2024 and beyond. As stated in the chart there is no trickery rather, there is logic and reason. It appears, these predictions beyond 2024 are realistic and do not point to crazy moon boy levels. So with that, I leave this here to revisit and pay my respects.
Some Observational and Key Points:
I base some findings on a 2 x 8-year cycle rather than the conventional 4-year cycle. However, it may appear shorter than expected. Just as there are diminishing returns, there too is an aspect of diminishing cycle timing.
While cycles are often recognised by their low and high targets, not many observe the time it takes to surpass a previous all-time high (ATH) or low. This is interesting because Bitcoin does not exhibit this repetitive behaviour in its history.
I observed the peaks and troughs while noting the counts and periods across cycle phases and took a visual snapshot towards 2022-24 playing into more likely that of 2013-16.
I've projected 2 ATHs as a range due to the nature of placement. The first target is primary, and wicks above could stretch into the second. Projections are also based on a 2-week (close) timeframe.
Final comments:
This is not an indication to be mega bullish and is NFA. The chart merely highlights developments I've identified and is not certain to play out, although quite probable. It is more of a "let's look back and indulge" - at least for me.
Thanks and Enjoy!

TRX/USDT , Technical analysis , CyclicityInteresting active , TRX/USDT , Timeframe 1 week.
Cyclicality in the market, please pay attention to my idea TRX/BTC

$RVLV ~ Expecting lower lows...As shown, beautiful correction taken place as expected. Will create amazing buying opportunity once done. Will need to monitor and take action when necessary. Everything is getting beatdown at the moment.

$BBBY ~ Correction should be completing soon...Deep correction still occurring as shown. Would expect a turn around based on current levels. Keeping on watchlist based on current correction and fair market value.

AMD - Fakeout
Measured move on this name would have been much bigger than what it was showing last week. The weakness was palpable. I bought 125c but sold around 123.5 at the close on March 29. Now I know why...my instinct was telling me something was not right.
first reaction off of the any ATR resistance is pullback, so no surprise it got sold at that level. It's shame I didn't foresee it...or saw it but didn't digest it.
A lot of commentary was made on twitter how this was going beyond 130, I made no such claim.
Levels below are clear, if it can hold 101 and base above, longs have control, below, 95 and 84

Cyclical stocks & 5 elements (e.g : Palm Plantation) 22/2/22Today not just "The Sun Calendar" is all 22 BUT Lunar calendar day also 22) = - The Practice of Chinese Core Five Elements Concepts for picking up Cyclical stocks ? Showing here is Malaysia Plantation Index ( Mainly Palm Oil Plantation ) .. It seem like The Index showing "up trend" when entering "Water Element" months of Lunar Calendar? Why?! Water "Growing/Generating" Plants? Show logical?...
AND it show "down trend" when entering "Metal Element" months.. I'm puzzling why?! Metal " Carving/ Counteracting" Woods?.. Show logic?..Hmmmm... Then How about "Earth Months".. Look like "side ways/no obvious trend" market.. Why? Plants need to "use/consume" its "energy" to Hold the "earth", Stopping "landslide"?....Hmmmm. How about Glove Stocks?! Either Rubber Tree, or Nitrile, Latex, and Vinyl Gloves under "wood elements" category.. Hmmm.. Look like the next up trend going to be "glove stocks""...

Consumer discretionary stocks are doing fine. McDonald's exampleHi everyone,
As millions of retail crypto and options speculators lose their savings, McDonalds Corporation is rubbing its hands with a hideos grin. "Ah, yes, millions of fresh employees, just what I need" .
In all seriousness, consumer discretionary sector as a whole was obviously contracting with the broad market. However, not quite at the same pace.
NYSE:MCD stock has seen a maximmum drawdown of 8.7%, whereas S&P dropped 12% from the top.
Though if you look for a safehaven amidst the increased volatility, it is much safer to buy consumer defensive names, such as Campbell Soup ( NYSE:CPB ), Kroger NYSE:KR , Procter&Gamble ( PG ), etc.
All these names performed really well this month compared to the general market.
McDonald's is a cyclical consumer stock, which means it will outperform the market during the economic expansion period.
And when is this going to happen?
My opinion is the following:
1. Market is in turmoil, so the Fed is not going to raise rates.
2. Inflation will slow down. Inflation is connected to the supply chain issues, not to the Fed printing money (because in reality they did not print anything, but that's another topic for discussion).
3. All Covid measures are going to be cancelled this year, as the global context on taming this virus started to shift.
The above reasons lead to a major economic expansion and another consumer discretionary stocks boom later this year.
McDonalds happens to be one of them.
Oh, yeah, also check my levels on the chart.
As always, trade wisely and good luck!
-----------------------------------------------------------------------------------------------------------------
Disclaimer!!!
This is not financial advise.


Dr KOSPI moving higher - important for global cyclicalsKOREA is one big factory with the full gamut of output, from ships to semis.
The index is a key barometer for global cyclical momentum.
Consolidation is complete

Energy breakout ~ June 2021Technical Analysis
We have been in a strong uptrend (pink segment line) since November, which I have divided into 3 ranges.
We have tested the top of "Range 2" 3 times, and we are now breaking out. Either we continue into "Range 3", or we could potentially test the pink trend line once again (ghost feed representation)
Macro
Tomorrow jobs report could be a market moving event, as the Fed has made a drastic change in its action plan, which consists of reacting to data (reports such as these), instead of reacting preemptively as it has done in the past.

General Electric, huge potential If it surpasses the resistance at $13 and breaks out, it would have a clear path to $20. In the long run it still has room to climb. To be worth it, I recommend going with leverage. At the current price, a tight stop loss is relatively "safe" as I don't see it falling further.
NYSE:GE

Synchronized marketsSo we have synchronized movements between long-term treasury yields (5, 10 and 30 years) and cyclicals (airlines, oil companies, carmakers, cruise lines, etc.) regardless of the fundamentals. If these yields are expected to continue increasing in response to a higher rate of inflation, a continuation of the trend in cyclicals would also be expected.
The peak of June 8 of last year was the clearest proof of this interrelation between markets. Oil prices could continue to rise, I would not be surprised if it reaches $ 100 a barrel.

OXT No Need To WorryAs long as .78 can hold as support OXT is only beginning a massive journey.
We could see brief dips below in coming days but bigger picture we would like to see a weekly Candle Body close above .78 USD.
That would be extremely bullish.
Price discovery can be a fantastic time for asset holders.
Real world usability and demand to pull OXT higher in cmc ranking list.
not investement advice. DYOR.

Get in the Zone: the Lotto ZoneIf any of you are up for a gamble, this is a good play for a short position / long puts. AZO has had a monster rally and is starting to wind back to some pre-pandemic support levels I believe. Now this is a good company, but the stock will get caught up in a mess of short-term declines in the Retail Trade sector and this one has far to fall and a well-defined area of support to work off of.
Some solid indicators are saying this is well over-bought and flashing the sell signal. This means we may have reached the peak of it's new consolidation area and will begin grinding down to find the bottom. Thankfully we have a triple-top to tell us where that bottom will ultimately be. Options are expensive for shares this pricey, and bid-ask spread is huge, so maybe just an old-fashioned short is your ticket.

Energy's volume confirming trendTechnical Short-term Analysis
We have a new potential uptrend line drawn in the chart.
RSI is showing some divergence as it has reached the level from the beginning of February. However; I would take this divergence with a grain of salt, as it did reach Overbought levels and did not break the 40 level on the RSI (typical bullish behavior).
OBV has a clear uptrend, supporting the uptrend in price.
Trade Setup
Would sell a partial position if we break the ~new potential uptrend~.
Would sell the rest if we break the 50sma.
Hope this helps!
