W. R. Berkley (WRB)Mitsui Sumitomo: Why are they buying so "a lot"?
This is not just speculation. MSI is implementing a strategic agreement with the Berkeley family (the company's founders):
Goal: MSI aims to own 15% of the company by the end of March 2026.
Latest wave (January 2026): Between January 22 and 28 alone
Peers for comparison
Key facts today
Morgan Stanley raised its price target for W. R. Berkley Corporation (WRB) to $80 from $70, while maintaining its rating, reported as Equal-Weight, Neutral, or Market-Weight across the summaries. 1
4.76 USD
1.78 B USD
14.71 B USD
220.52 M
Next report date
Report period
EPS estimate
Revenue estimate
Company info
Sector
Industry
CEO
William Robert Berkley
Website
Headquarters
Greenwich
Founded
1967
IPO date
Oct 19, 1973
ISIN
US0844231029
CUSIP
084423102
FIGI
BBG000BD1HP2
Identifiers
ISIN US0844231029
W.R. Berkley Corp. is an insurance holding company, which engages in the property casualty insurance business. It operates through the following segments: Insurance and Reinsurance & Monoline Excess. The Insurance segment includes excess and surplus lines, admitted lines, and specialty personal lines throughout the United States, as well as insurance businesses in the United Kingdom, Continental Europe, South America, Canada, Mexico, Scandinavia, Asia, and Australia. The Reinsurance & Monoline Excess segment is involved in the reinsurance business on a facultative and treaty basis, primarily in the United States, United Kingdom, Continental Europe, Australia, the Asia-Pacific region, and South Africa. The company was founded by William R. Berkley in 1967 and is headquartered in Greenwich, CT.
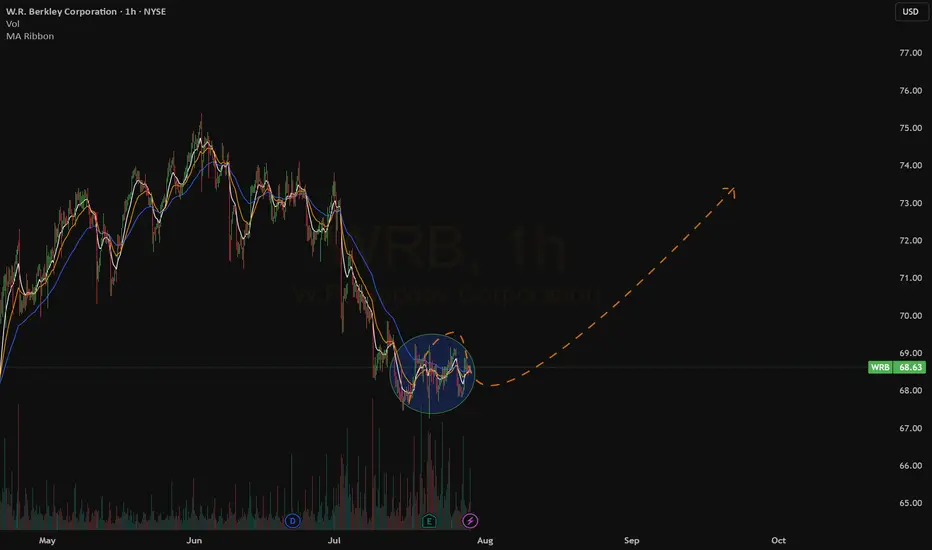
WRB hovering near key support — dip buyers stepping in:Current Price: 69.92 (Analysis was generated on Monday Morning)
Direction: LONG
Confidence level: 58%(Price is sitting near a widely watched support zone around $68.5 and multiple traders favor buying pullbacks rather than betting on further downside. Signals aren’t strong, but downside appears li
WRB hovering near key support sets up a tactical upside play:Current Price: 68.58 (Analysis was generated on Monday Morning)
Direction: LONG
Confidence level: 46%(Limited data and mixed trader tone, but price is near widely mentioned support and several traders point to upside levels at $70 and $72, giving a slight bullish edge)
Targets
Target 1: 70.0
Targ
WRB - W.R. Berkley - Did i say Break Out again :)Hello Everyone,
This is the last one, i would like to share to watch next week and guess what, another Break Out :)
What are they do?
W. R. Berkley Corporation is a vast insurance holding company. Its operations are dominant in the commercial lines property and casualty insurance business globally
W.R. Berkley (WRB): Insurance Stock Eyes Next Bullish MoveW.R. Berkley Corporation (WRB) is a leader in the commercial property and casualty insurance space, offering specialty coverage through a wide network of independently operating businesses. With a strong focus on underwriting discipline and long-term risk management, the company continues to expand
WRB RotationTesting a few technical indicators during a cyclical rotation here:
- Volume Profile
-- 50 day lookback "Quarterly PoC" | Price is at PoC
-- 100 day lookback "Power PoC" | Price is at PoC
-- PoC Price | Blue = Long
- 200 Day Moving Average
- provides baseline for Long/Short basis | Price > MA = Lon
Short, target 60.97Following weekly chart.
I got a short signal from my power indicator, now let's check where it should go.
Following fibonacci level and support levels, I see a big opportunity between 60.92-61.62
Also we have a gap in 60.92 which supports this idea.
There might be still an uptrend, my stop loss le
See all ideas
Summarizing what the indicators are suggesting.
Neutral
Neutral
Neutral
An aggregate view of professional's ratings.
Neutral
Neutral
Neutral
Displays a symbol's price movements over previous years to identify recurring trends.
Maturity dateSep 30, 2060
Coupon4.25% (Fixed)
Maturity dateDec 30, 2059
Coupon5.10% (Fixed)
Maturity dateMar 30, 2058
Coupon5.70% (Fixed)
Maturity dateMay 12, 2050
Coupon4.00% (Fixed)
Maturity dateAug 1, 2044
Coupon4.75% (Fixed)
Maturity dateSep 30, 2061
Coupon3.15% (Fixed)
Maturity dateMar 30, 2052
Coupon3.55% (Fixed)
Maturity dateFeb 15, 2037
Coupon6.25% (Fixed)
See all WRB bonds
Frequently asked questions
Today, WRB trades at 77.57 USD.
For broader market analysis, dive into the technicals on the W.R. Berkley Corporation stock price chart and read the latest WRB news:
– WR Berkley Is Maintained at Equal-Weight by Morgan Stanley
– Morgan Stanley maintains WR Berkley at Equal-Weight, raises price target to $80 from $70
– WRB Underperforms Industry, Trades at a Discount: Time to Hold or Buy?
For broader market analysis, dive into the technicals on the W.R. Berkley Corporation stock price chart and read the latest WRB news:
– WR Berkley Is Maintained at Equal-Weight by Morgan Stanley
– Morgan Stanley maintains WR Berkley at Equal-Weight, raises price target to $80 from $70
– WRB Underperforms Industry, Trades at a Discount: Time to Hold or Buy?
Markets don't sleep, here's what's going on with WRB at the moment:
– WR Berkley Is Maintained at Equal-Weight by Morgan Stanley
– Morgan Stanley maintains WR Berkley at Equal-Weight, raises price target to $80 from $70
– WRB Underperforms Industry, Trades at a Discount: Time to Hold or Buy?
See more updates in real-time with our News Flow.
– WR Berkley Is Maintained at Equal-Weight by Morgan Stanley
– Morgan Stanley maintains WR Berkley at Equal-Weight, raises price target to $80 from $70
– WRB Underperforms Industry, Trades at a Discount: Time to Hold or Buy?
See more updates in real-time with our News Flow.
W.R. Berkley Corporation is scheduled to release its next earnings report on Jan 28, 2027.
Why it matters:
– Key event: Earnings often drive significant price moves
– Market expectations: Traders watch revenue, EPS, and guidance vs forecasts
– Volatility spike: Price swings can increase before and after the release
How to use it:
– Track upcoming reports in the Earnings Calendar
– Compare actual results with analyst estimates
– Monitor price reaction and volume on Supercharts
Why it matters:
– Key event: Earnings often drive significant price moves
– Market expectations: Traders watch revenue, EPS, and guidance vs forecasts
– Volatility spike: Price swings can increase before and after the release
How to use it:
– Track upcoming reports in the Earnings Calendar
– Compare actual results with analyst estimates
– Monitor price reaction and volume on Supercharts
WRB stock is 2.90% volatile and has beta coefficient of −0.22.
What it means:
– Volatility: Shows how much the price fluctuates over time
– Beta > 1: More volatile than the market
– Beta < 1: Less volatile, more stable
Important to know:
– Volatility can increase during earnings, news events, or market stress
– Large-cap stocks like WRB are typically less volatile than smaller companies
Track every detail on W.R. Berkley Corporation stock chart and check out the list of the most volatile stocks — is W.R. Berkley Corporation there?
What it means:
– Volatility: Shows how much the price fluctuates over time
– Beta > 1: More volatile than the market
– Beta < 1: Less volatile, more stable
Important to know:
– Volatility can increase during earnings, news events, or market stress
– Large-cap stocks like WRB are typically less volatile than smaller companies
Track every detail on W.R. Berkley Corporation stock chart and check out the list of the most volatile stocks — is W.R. Berkley Corporation there?
To understand the WRB stock performance, it's worth checking price changes for various periods to get the full picture:
– 1 day — +1.39%
– 1 week — +3.68%
– 1 month — +6.37%
WRB all-time low was 0.04 USD (Dec 18, 1975), and its highest price is 79.26 USD (Nov 5, 2026). Find more dynamics in the Stock Heatmap and on the W.R. Berkley Corporation stock chart.
– 1 day — +1.39%
– 1 week — +3.68%
– 1 month — +6.37%
WRB all-time low was 0.04 USD (Dec 18, 1975), and its highest price is 79.26 USD (Nov 5, 2026). Find more dynamics in the Stock Heatmap and on the W.R. Berkley Corporation stock chart.
W.R. Berkley Corporation market capitalization is 29.17 B, representing the total value of all its outstanding shares (price × shares outstanding).
What it means:
– Market cap is one of the key ways to classify companies (large-cap, mid-cap, etc.)
– It reflects how investors value the company today
– It changes constantly with stock price movements
What to look at next:
– Market cap trends: Rising cap may signal growth and investor confidence; falling cap can reflect risk or downturns
– Price vs shares: Changes can come from W.R. Berkley Corporation stock price moves or share count (buybacks, issuance)
– Valuation ratios: Compare market cap with revenue and earnings
– Peer comparison: See how W.R. Berkley Corporation stacks up against other companies
What it means:
– Market cap is one of the key ways to classify companies (large-cap, mid-cap, etc.)
– It reflects how investors value the company today
– It changes constantly with stock price movements
What to look at next:
– Market cap trends: Rising cap may signal growth and investor confidence; falling cap can reflect risk or downturns
– Price vs shares: Changes can come from W.R. Berkley Corporation stock price moves or share count (buybacks, issuance)
– Valuation ratios: Compare market cap with revenue and earnings
– Peer comparison: See how W.R. Berkley Corporation stacks up against other companies
The safest way to buy W.R. Berkley Corporation stocks is through a reliable broker. Create an account, fund it, and place a buy order.
You can trade WRB directly from TradingView:
– Choose a broker: Explore our supported trading partners and pick one that fits your needs
– Compare options: View available brokers side by side to evaluate fees and features
– Connect your account: Open Supercharts, click “Trade”, select your broker, and log in
– Start trading: Place orders without leaving the chart
Tip: If you’re new to trading, try paper trading first — it lets you practice strategies in real market conditions without risking funds.
You can trade WRB directly from TradingView:
– Choose a broker: Explore our supported trading partners and pick one that fits your needs
– Compare options: View available brokers side by side to evaluate fees and features
– Connect your account: Open Supercharts, click “Trade”, select your broker, and log in
– Start trading: Place orders without leaving the chart
Tip: If you’re new to trading, try paper trading first — it lets you practice strategies in real market conditions without risking funds.
As of Nov 17, 2026, the company has 8.8 K employees.
Why traders follow this data:
– Company scale: Employee count reflects the size and global reach of the business
– Operational footprint: Higher headcount often indicates broader product lines, retail presence, or services
– Trend signal: Changes over time can reflect hiring growth, restructuring, or efficiency improvements
See our rating of the largest employers to find more opportunities.
Why traders follow this data:
– Company scale: Employee count reflects the size and global reach of the business
– Operational footprint: Higher headcount often indicates broader product lines, retail presence, or services
– Trend signal: Changes over time can reflect hiring growth, restructuring, or efficiency improvements
See our rating of the largest employers to find more opportunities.
W.R. Berkley Corporation pays dividends, but whether it is a “good” dividend stock depends on its yield and stability rather than dividends alone.
Its recent dividend yield was around 0.50%, with a payout ratio of 7.87%, compared to 0.54% and 7.19% in the previous period.
What to look at when looking for good dividend stocks:
– Dividend yield: Income potential relative to price
– Payout ratio: Sustainability of dividend payments
– Dividend history: Consistency and growth over time
– Earnings strength: Dividends are more reliable when supported by stable profits
– Total return: Combines dividends with stock price performance
Explore all this in W.R. Berkley Corporation financials.
Its recent dividend yield was around 0.50%, with a payout ratio of 7.87%, compared to 0.54% and 7.19% in the previous period.
What to look at when looking for good dividend stocks:
– Dividend yield: Income potential relative to price
– Payout ratio: Sustainability of dividend payments
– Dividend history: Consistency and growth over time
– Earnings strength: Dividends are more reliable when supported by stable profits
– Total return: Combines dividends with stock price performance
Explore all this in W.R. Berkley Corporation financials.
Investing in W.R. Berkley Corporation depends on your goals, risk tolerance, and market conditions. It’s essential to analyze the stock before making a decision.
First, study W.R. Berkley Corporation financials and track their dynamics on the Fundamental Graphs:
– Business fundamentals: Revenue, earnings, and growth trends
– Valuation: P/E ratio, market cap, and how it compares to peers
– Profitability: Margins, return on equity, and cash flow
– Dividends (if any): Yield, payout ratio, and consistency
Then explore our WRB technicals – signals based on essential indicators calculations:
– Today — buy
– 1-week — buy
– 1-month — strong buy
Combine fundamental and technical analysis for better results.
First, study W.R. Berkley Corporation financials and track their dynamics on the Fundamental Graphs:
– Business fundamentals: Revenue, earnings, and growth trends
– Valuation: P/E ratio, market cap, and how it compares to peers
– Profitability: Margins, return on equity, and cash flow
– Dividends (if any): Yield, payout ratio, and consistency
Then explore our WRB technicals – signals based on essential indicators calculations:
– Today — buy
– 1-week — buy
– 1-month — strong buy
Combine fundamental and technical analysis for better results.
W.R. Berkley Corporation stock ticker depends on the exchange where it’s listed. On the NYSE, its primary exchange, W.R. Berkley Corporation stocks trade under the symbol WRB.
About tickers:
– Unique identifiers: A ticker is a short code used to find and trade a stock
– Exchange-specific: The same company may have different tickers across exchanges
– Search shortcut: Used on trading platforms, charts, and screeners
Remember:
– Some companies have multiple listings
– Always check the exchange prefix to avoid confusion
Learn how to find your desired assets in our Symbol Search.
About tickers:
– Unique identifiers: A ticker is a short code used to find and trade a stock
– Exchange-specific: The same company may have different tickers across exchanges
– Search shortcut: Used on trading platforms, charts, and screeners
Remember:
– Some companies have multiple listings
– Always check the exchange prefix to avoid confusion
Learn how to find your desired assets in our Symbol Search.
WRB earnings for the last quarter are 1.17 USD per share, whereas the estimation was 1.15 USD, resulting in a 1.36% surprise. The estimated earnings for the next quarter are 1.20 USD per share.
How to read financials:
– Compare actual vs estimates: Earnings beats or misses often drive price moves
– Watch market reaction: Price response matters as much as the numbers
– Look at forward guidance: Future estimates signal expected growth
– Track trends: Analyze results across multiple quarters, not just one
Follow other essential metrics in W.R. Berkley Corporation financials:
– Revenue growth: Shows business expansion
– Margins (operating, net): Reflect profitability and efficiency
– Free cash flow: Indicates real cash generation
– Debt levels: Impacts financial stability and risk
How to read financials:
– Compare actual vs estimates: Earnings beats or misses often drive price moves
– Watch market reaction: Price response matters as much as the numbers
– Look at forward guidance: Future estimates signal expected growth
– Track trends: Analyze results across multiple quarters, not just one
Follow other essential metrics in W.R. Berkley Corporation financials:
– Revenue growth: Shows business expansion
– Margins (operating, net): Reflect profitability and efficiency
– Free cash flow: Indicates real cash generation
– Debt levels: Impacts financial stability and risk
W.R. Berkley Corporation revenue for the last quarter amounts to 3.74 B USD despite the estimated figure of 3.82 B USD. In the next quarter revenue is expected to reach 3.85 B USD.
How to read this data:
– Compare actual vs estimates: Revenue beats or misses can move the stock
– Watch market reaction: Price response shows how investors interpret results
– Look at growth: Compare with previous quarters and year-over-year data
– Track trends: One quarter matters less than consistent performance
Follow other essential metrics in W.R. Berkley Corporation financials:
– Earnings (EPS): Profitability per share
– Margins (gross, operating): Efficiency and cost control
– Free cash flow: Cash available after expenses
How to read this data:
– Compare actual vs estimates: Revenue beats or misses can move the stock
– Watch market reaction: Price response shows how investors interpret results
– Look at growth: Compare with previous quarters and year-over-year data
– Track trends: One quarter matters less than consistent performance
Follow other essential metrics in W.R. Berkley Corporation financials:
– Earnings (EPS): Profitability per share
– Margins (gross, operating): Efficiency and cost control
– Free cash flow: Cash available after expenses
Yes, you can track W.R. Berkley Corporation financials in yearly and quarterly reports right on TradingView.
Use our Earnings Calendar to never miss important releases and spot opportunities early.
WRB net income for the last quarter is 446.00 M USD, while the quarter before that showed 452.26 M USD of net income which accounts for −1.38% change.
How to read this data:
– Track changes: Compare net income across quarters to spot trends
– Watch expectations: Compare with estimates to gauge performance
– Check margins: Net income reflects profitability after all expenses
– Look beyond one quarter: Consistency matters more than a single result
Follow other essential metrics in W.R. Berkley Corporation financials:
– Revenue: Overall business growth
– Earnings per share: Rising EPS over time often points to improving business performance
– Margins (gross, operating): Efficiency and cost control
How to read this data:
– Track changes: Compare net income across quarters to spot trends
– Watch expectations: Compare with estimates to gauge performance
– Check margins: Net income reflects profitability after all expenses
– Look beyond one quarter: Consistency matters more than a single result
Follow other essential metrics in W.R. Berkley Corporation financials:
– Revenue: Overall business growth
– Earnings per share: Rising EPS over time often points to improving business performance
– Margins (gross, operating): Efficiency and cost control
W.R. Berkley Corporation does pay dividends, which are distributed quarterly. The most recent dividend per share was 0.10 USD, with a trailing twelve-month (TTM) dividend yield of 0.48%.
Explore more details on W.R. Berkley Corporation dividends, look at:
– Dividend history: Check whether payouts are growing, stable, or declining
– Payout ratio: How much of earnings are paid out as dividends
– Total return: Combine price growth + dividends for full performance view
Explore more details on W.R. Berkley Corporation dividends, look at:
– Dividend history: Check whether payouts are growing, stable, or declining
– Payout ratio: How much of earnings are paid out as dividends
– Total return: Combine price growth + dividends for full performance view
WRB reached its all-time high of 79.26 USD on Nov 5, 2026. Its all-time low was 0.04 USD and was reached on Dec 18, 1975.
Explore the W.R. Berkley Corporation stock price chart to see more price history, and discover companies reaching new all-time highs and lows.
Analyst forecasts suggest a price range between 51.00 USD and 83.00 USD for WRB, based on current estimates.
Remember:
– Forecasts show possible scenarios, not guaranteed outcomes
– They're based on multiple analysts’ models and assumptions
– Target prices change with earnings, news, and market conditions
Don't rely on analysts' opinions alone:
– Use technical analysis: Trend, support/resistance, momentum
– Study fundamentals: Revenue, earnings, margins
– Account for market context: News, macro trends, sector performance
Remember:
– Forecasts show possible scenarios, not guaranteed outcomes
– They're based on multiple analysts’ models and assumptions
– Target prices change with earnings, news, and market conditions
Don't rely on analysts' opinions alone:
– Use technical analysis: Trend, support/resistance, momentum
– Study fundamentals: Revenue, earnings, margins
– Account for market context: News, macro trends, sector performance