DAL

THE WEEK AHEAD: DAL, OIH/XOP, XLK, FCXAfter a short break for shortened trading weeks for the Christmas and New Year's holidays (how bout them holiday markets, huh?), I'm back to my regular routine. Here's what's on tap for the coming week ... .
Earnings:
I'm not seeing much on the earnings front for volatility contraction plays or premium plays in high implied volatility around earnings that are giving me that "come hither" look. I did look at DAL (65/40; earnings on Thursday), but it's got goofy two-and-a-halfs on the call side in the Feb expiry where I'd want to set up my tent, which could make call side trade management problematic. The very last type of headache I want to have with a trade is being forced to roll to a goofy strike or do something whacky because of strike unavailability. That being said, the February 15th 45 short put is paying 1.26 (30 delta) with a break even of 43.74 (8.5% discount over current price; divvy yield is 2.80%; 1.40 annualized) should that type of play strike your fancy.
Exchange-Traded Funds Ordered by Implied Volatility Rank:
GDX 73/33
USO 69/53
OIH 64/46
IYR 62/21
GDXJ 59/34
... And Ordered by 30-Day Implied:
UNG 38/54
USO 59/53
OIH 64/46
XOP 53/43
EWZ 27/35
As usual, petro (USO, OIH, XOP) is sticking out for volatility, which is kind of why I like to be in some kind of play with a premium selling component on a virtually constant basis. OIH and XOP continue to dribble along at the low end of their ranges, so my preference would be for bullish assumption setups there with no or limited upside risk (short puts, upward call diagonals, lizards) in the short to medium term. Having gotten out of an XOP upward call diagonal last week, I'll probably re-up with something in the February cycle and will post that trade here separately later in the week.
Broad Market:
QQQ: 59/30
IWM: 52/26
XLK: 48/30
SPY: 25/24
I've thrown XLK (technology) in here because of its close correlation with SPY (3-month of .86). In comparison, it's got slightly better volatility metrics, but is also one-fourth the price, so you can potentially proxy a broad market play without hanging as much buying power out there as you would with one of the majors.
Trade of the Week:
Pictured here is an FCX (62/57) upward call diagonal (bullish assumption) setup (with an overlay of copper futures). Although it's got earnings in 18, I'm just looking to get in on weakness and in a fairly high volatility environment. Moreover, I can get in fairly cheaply with a greater than 180 day back month, which will give me plenty of time to reduce cost basis in the diagonal. I went with the March 12 short call strike for the front month because the Feb 11 was "too close," and the Feb 12 was "too far away" (not enough collected for the short call). Metrics: Max Loss on Setup: $278; Max Profit on Setup: $122; Break Even: 10.78 versus 10.82 spot; Debit Paid to Spread Width Ratio: 69.5%.

DAL Approaching Support, Potential Bounce!DAL is approaching its support at 50.46 (100% Fibonacci extension, 61.8% & 38.2% Fibonacci retracement, horizontal swing low support) where it could potentially rise to its resistance at 54.70 (38.2% Fibonacci retracement, horizontal pullback resistance).
Stochastic (89, 5, 3) is approaching support at 2.9% where a corresponding bounce could occur.

THE WEEK AHEAD: DAL, C, JPM, WFC EARNINGS; EWZ, TLT/TBTAlthough the earnings season has already kicked off modestly, a bevvy of financials announce next week: C, JPM, and WFC (all on Friday). I generally don't play these underlyings for volatility contraction around earnings primarily because the implied volatility just doesn't ramp up to the degree I'd like to see for a play. I thought I'd mention them here since there will be possible broad sector (XLF) impact depending on how these earnings go -- i.e., there could be a play that develops in one of these underlyings post-announcement or in the sector as a whole that may be worth playing.
Other Earnings: DAL (rank 41/30-day 32) announces earnings on Thursday before market open. The metrics don't look promising here for a directionally neutral premium selling play, but I could see going for something bullish if earnings experience engine failure and crash into the 52-week low around 48 and implied volatility remains high such that a bullish assumption play would be productive (e.g., short puts, Jade Lizard, etc.).
Although there are some other single names that are "ripe" for a volatility contraction play right here (TSLA (earnings in 31) comes to mind), my general tendency is to resist the urge to put plays on in single name with earnings announcements that are near the monthly and instead wait until the eve of the announcement. With a rank of 99 and implied of >100%, though, it's understandably tough to sit on one's hands and wait.
On the Exchange-Trade Fund Front:
Brazil is voting today, so it's likely that you're too late to get into a volatility contraction play that may evolve after the results are finalized (the time to have put that play on was last week). That being said, it's also possible that EWZ gets even more volatile depending on the outcome, even though implied volatility is at the top of its 52-week range at 56.2%.
The financial media has returned to covering 10-year T note yield hand-wringing and/or the spiking of bond yields in general as a general, explanatory theme of why the broad market gave some up last week. TLT broke through long-term support at 116 last week, cratering to 113. I was previously shorting TLT from the 122 level via put diagonals, but it appears that play may have temporarily played out in the absence of some risk-off event that drives treasuries back up. I will continue to short TLT on retrace, but there is little that sticks out to me in terms of horizontal resistance other than 122 and 116, and I'm hesitant to short from 116, since it literally just broke that level "seconds ago" in the scheme of things.

JBLU: Swing trade opportunityBuy here, risk 1-3 Average True Ranges down, to ride it back up to the recent top or into resistance. Watch the 'key earnings levels' for a support/resistance map in price. You can get this indicator in @timwest's indicator pack. Really useful to navigate through the chop.
With oil so extended, airlines oversold into support, we have a nice low risk setup. I'm loading up here.
Cheers,
Ivan Labrie.

Short'ed DAL through Options!Short DAL for a target of 50 and a stop loss of today's high!
bought the 51 PE expiring next week!

$DAL Delta Air Lines Descending Triangle$DAL Delta Air Lines - possible bearish long term descending triangle forming. Monitor for definitive heavy volume break of $51 support level.

October 11 Earnings: Delta Airlines - Fuel, Fuel, FuelAll major airlines have enjoyed solid financial upbeat since Oil $USOIL has remained under $50/barrel.
Delta Airlines has subsequently hiked their dividend throughout the quarter and increased share buybacks.
The company is also committed to paying down debt while financial conditions allow for it.
The ITIA's latest data reports a Load Factor of 84.7% - Optimistic readings for airlines.
Traffic growth remains high at 6.8% as more people take to the skies and shipping increases.
I believe this quarter will be bullish for airlines following the summer season.
I'm starting Delta Airlines with a $55.00 PT for the post-earnings price action.

Perfect dance on trendline from DALDelta just jumped off perfectly on the trendline. Volume raised and now there is a reason for me to go long.
PT: 54-56.

Delta Airlines: bump and runWe can see a clear bump and run reversal pattern. Now a return to the main trend is likely to happen. This is an attractive risk reward! I'm short in Air France KLM.

Bearish Doubling Down For Delta AirlinesOn April 26, 2017, Delta Airlines ( DAL ) crossed below its 150 day moving average (DMA). Historically this has occurred 41 times and the stock drops a minimum of 0.194%. It has a median loss of 6.485 % and maximum loss of 40.441% over the next 15 trading days.
When we take a look at other technical indicators, the relative strength index (RSI) is at 52.8562. RSI tends to determine trends, overbought and oversold levels as well as likelihood of price swings. I personally use anything above 75 as overbought and anything under 25 as oversold. The current reading declares the stock recently moved up into a more neutral movement state.
The true strength index (TSI) is currently -17.9842. The TSI determines overbought/oversold levels and/or current trend. I solely use this as an indicator of trend as overbought and oversold levels vary. The TSI is double smoothed in its calculation and is a great indicator of upward and downward movement. The current reading declares the stock is moving down.
The positive vortex indicator (VI) is at 1.0188 and the negative is at 0.8566. When the positive level is higher than 1 and higher than the negative indicator, the overall price action is moving upward. When the negative level is higher than 1 and higher than the positive indicator, the overall price action is moving downward. The current reading declares the stock is moving up, but the positive is dropping and negative is rising after today's session.
The stochastic oscillator K value is 71.7501 and D value is 61.2473. This is a cyclical oscillator that is highly accurate and can be used to identify overbought/oversold levels as well as pending reversals and short-term activity. I personally use anything above 80 as overbought and below 20 as oversold. When the K value is higher than the D value, the stock is trending up. When the D value is higher that the K value the stock is trending down. The current reading declares the stock is approaching overbought territory and should cycle down soon.
Considering the moving average crossover, RSI, TSI, VI and stochastic levels, the overall direction appears to continue heading down. Based on historical movement compared to current levels and the current position, the stock could drop another 3.82% over the next 15 trading days.
Just two days prior to our current downward DMA cross, Delta crossed over its 150 DMA. When the downward cross occurs a few trading days after an upward cross, the stock always drops. Since the end of the financial crisis in 2009 this has occurred in January 2011, October 2011, December 2011 (3 times), October 2012 (4 times), November 2012, July 2015, and April 2016. The stock dropped 6.369%, 12.993%, 5.483%, 3.879%, 2.317%, 3.535%, 4.814%, 5.100%, 5.572%, 3.560%, 1.261%, and 13.494% respectively. The median drop of these 12 occasions is 4.957%.


Airline CooloffHistorically when the vortex negative hits this level the stock drops at least 1.21% with an average drop around 13.57%. A drop around this average is possible, but DAL has not been trading at large enough daily spreads to make this likely in the next few weeks. A more conservative drop would be near the 47.56 mark which has been a pseudo support/resistance level.


DAL: strong immediate buySignals:
double bottom
Flag
Buy 36.80-37.00
Stop 35.80 (-4 tics of flag's low)
Target 1-45.50; 2-50.00 (sizing+Elliot's waves)

DAL- Here is a REVERSE signal in the making ProfitFromPricesLooks like it is about to resume the trend. This time to make a new recent High. I am IN.

Delta Airlines still has a long way to fallJust bounced off again from the higher trend line, overall EMAs look to be heading south, could be a 15% move over the next couple of weeks

Delta DAL- Is it time to get long..for nice long profit?I think today is a perfect day to take some long positions in airline stocks. Today's pattern has a higher bottom and a nice RESTART signal! I am thinking to go long with a stoploss at today's low of $34!

DAL large breakout imminentDAL has just dropped 20% in 2016 and is expected to rise as much as 79% in the next year.
It is already going back up. And according to the resistance level drawn, it is very likely to repeat itself as it had in 2015.
Check out the analysts outlook www.marketwatch.com

DLong


DOW Transports To Retest Recent Lows(Note: DOWT is no longer in a bear market after rallying the last two weeks)
2015 was suppose to be just another year of the epic bull market created by reckless central banking policies. Some Wall Street estimates for the S&P 500 were as high as 2,300. Me? I projected a contraction to 1,810 in mid-January.
Whether or not the SPX will reach my target within the next 10 weeks, or so, is uncertain; but what has been quite clear is the scaffolding holding with risk assets around the global has been crumbling for sometime.
In " Is A Storm Brewing? How History is Repeating Itself ," I was clear and concise in what 2015 had in store (posted Jan. 13, 2015):
I support the idea that we are on the precipitous of something disastrous.
Those who constantly look at underlying factors and notice the shifts in the FX, commodity and economic data are witnessing that the latest boom cycle is on its last leg.
In essence, the post was a summery of the marco trends few wrote about because everybody indulged in the feel-good of rising stock prices.
The post ended quite ominously: "2015 is going to be mercurial…"
On March 26, I indicated that the DOW transports looked technically weak. Price action had been consolidating early in the year, much like the SPX. The index made several lower highs, higher lows and finally broke support at 8600.
Nobody was even looking at the transports as a potential catalyst to drag the broader markets lower, even though that is historically the case.
For instance, Cowen Group's Head of Sales, David Seaburg, said, as late as June 25 (after the the transports already began weakening underneath consolidation), "Everyone is up in arms about the transports, but the underperformance has very little to do with a weak economy and has more to do with the structural issues within the sector."
Seaburg also said that "I DEFINITELY don't see any downside (broader markets) necessarily." Almost a month-to-the-day, not only did the DOW and SPX hit their first 10 percent correction in four years, the DOW transports fell into bear market territory. Awkward.
Those that live by subjectivity, die by subjectivity.
The broader markets did receive a massive bounce following the largest NYSE short-interest since the Lehman Brothers collapse, but the transports has been rejected twice from 8,250, or the 23.6% Fib. retracement from the 2012-lows.
It's important to note that central bank credibility is fading fast, and traders will become more wary as the year winds down. Structurally, the index looks weak as earnings have been lackluster to not good at all.
EMAs are showing bullishness on the daily, as they are sloping upward. However, a close above 8,250 will be needed to garner any significant technical buying in my opinion.
Price action is within a large symmetrical triangle with price support of 7,970 cutting through the middle. This key, near-term support level could determine whether the index will test triangle support, which is supported by price support of 7,790.
A confirmed close below the triangle support will cause transports to retest the 2012 ascending trend line. I expect fundamentals to continue to deteriorate into 4Q, and the transports to challege 2011's trend (between 7,200 and 7,300).
Conversely, a close above triangle resistance could cause a rally to 8,500.
Please follow me on Twitter @Lemieux_26
Check my posts out at:
bullion.directory
www.investing.com
www.teachingcurrencytrading.com
oilpro.com

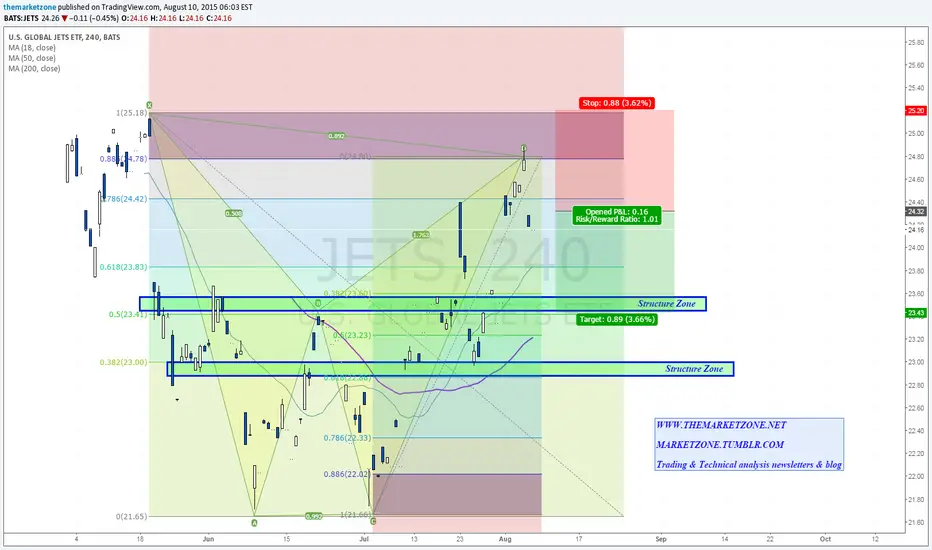
Is it going to run out of Fuel? Bearish Bat completionWith the drop in oil prices, $JETS, the new ETF that holds airline companies like Delta ($DAL), American Airlines ($AAL) and southwest airlines company ($LUV) had a very nice rally during the month of July.
The $ETF rallied all the way up to the 88.6 Fib level to complete a bearish Bat pattern and declined from there.
The pattern's targets are 23.5$ and 23$ which also come with daily support zones.
The current price level offer about 1:1 R/R ration for the short position with stop loss above X and 23.5$ as initial target zone.
This might work with the bullish scenario I posted earlier for oil