Long Idea on Natural Gas (NG1!)Based on :
- Quantitative analysis
- Propietary temperature shock european model
- Vp and Avwap
Demand Zone

AUDCHF - Pullback Into Structure, Watching the ReactionAUDCHF remains overall bullish, trading cleanly inside the rising blue channel. After the recent push higher, price is now pulling back into a very interesting area.
We’re approaching the intersection of the demand zone and the lower blue trendline. This is exactly the kind of confluence I like to see in a trending market.
As long as this intersection holds and price respects the lower boundary of the channel, I’ll be looking for trend-following long setups, with confirmation coming from lower timeframes.
⚠️ Disclaimer: This is not financial advice. Always do your own research and manage risk properly.
📚 Stick to your trading plan regarding entries, risk, and management.
Good luck! 🍀
All Strategies Are Good; If Managed Properly!
~Richard Nasr

BTC - Structure Flip, Next Leg Loading...BTC just did something important.
Price broke above a key resistance, and that level has now flipped into support. This kind of structure shift usually confirms that the previous range is done and a new leg is starting.
That said, this doesn’t mean price can’t breathe.
A pullback toward the $92,000 demand zone is still possible, especially since it lines up nicely with the lower blue trendline. If that happens, it would still be considered a healthy correction.
As long as structure holds, the expectation remains the same:
one more impulse higher, with the $100,000 round number acting as the next magnet.
⚠️ Disclaimer: This is not financial advice. Always do your own research and manage risk properly.
📚 Stick to your trading plan regarding entries, risk, and management.
Good luck! 🍀
All Strategies Are Good; If Managed Properly!
~Richard Nasr

SOLUSDT M15 HTF FVG Rejection and Bearish Continuation Setup📝 Description
CRYPTOCAP:SOL failed to reclaim recent highs after an impulsive move and is now consolidating below key M30 FVG zones. The price action appears corrective, with downside liquidity still acting as the main draw.________________________________________📈 Signal / Analysis
Primary Bias: Bearish while price remains capped below the M15 supply and FVG rejection zone
Preferred Setup:
• Entry: 140.05
• Stop Loss: Above 140.50
• TP1: 139.30
• TP2: 138.42
• TP3: 137.72 (HTF draw / lower liquidity)
________________________________________
🎯 ICT & SMC Notes
• Rejection from stacked M30 FVGs confirms valid short-term supply
• Current structure aligned with a corrective retracement before continuation
• Liquidity resting below recent lows remains the main magnet
________________________________________
🧩 Summary
CRYPTOCAP:SOL is showing signs of exhaustion after failing to reclaim higher structure. As long as price remains below the defined supply zone, downside continuation toward lower PD arrays is favored, with targets aligned to internal and HTF liquidity.
________________________________________
🌍 Fundamental Notes / Sentiment
With expectations of a stronger USD driven by this week’s US data, risk appetite remains weak. As a result, crypto assets like SOL are vulnerable to downside, with any rebounds likely corrective.
________________________________________
⚠️ Risk Disclosure
Trading involves substantial risk and may result in capital loss. This analysis is for educational purposes only and does not constitute financial advice. Always apply proper risk management, predefined stop-loss levels, and disciplined position sizing aligned with your trading plan.

XRP - Back Into Demand, Eyes on the Next LegAfter the strong impulsive move, XRP is now cooling off and pulling back into a very familiar area.
Price is approaching the round number $2, which is lining up perfectly with the red demand zone.
As long as this $2 level and demand zone hold:
I’ll be looking for long setups, ideally after confirmation on lower timeframes.
If buyers step in as expected, the natural upside target remains the orange supply zone, which marked the previous rejection area.
⚠️ Disclaimer: This is not financial advice. Always do your own research and manage risk properly.
📚 Stick to your trading plan regarding entries, risk, and management.
Good luck! 🍀
All Strategies Are Good; If Managed Properly!
~Richard Nasr

GBPUSD RETEST AND PULLBACK (READ CAPTION)Hi trader's what do you think about gbpusd
GBPUSD is currently trading with a bearish market bias, as price continues to respect key resistance levels and sellers remain in control. The overall price action suggests a higher probability of downside continuation unless major resistance zones are broken.
🔹 Resistance: 1.35337
This is the primary resistance level where price has faced repeated rejection.
As long as GBPUSD remains below 1.35337, selling pressure is expected to persist.
🔹 Strong Resistance Zone: 1.35840
This level represents a major supply and rejection zone.
Any retracement into 1.35840 that fails to break above would strongly confirm bearish continuation.
🔹 Support: 1.34601
This is the first downside support, where price may pause or attempt a short-term bounce.
A confirmed break below 1.34601 will signal further bearish momentum.
🔹 Demand Zone: 1.33582
This is the key demand area and main downside target.
If price breaks below 1.34601, the market is likely to move toward 1.33582, where buyers may attempt to step in.
📉 Market Outlook
Below 1.35337 / 1.35840 → Bearish continuation expected
Break below 1.34601 → Targets 1.33582 demand zone
Demand zone reaction will determine the next major move
Overall, the structure supports a bearish retracement followed by continuation scenario.
please don't forget to like comment and follow


#GBPUSD TradeNow that we had our potential reversal move (short term) . We should continue to the bullish trend and continue to take out old highs. If the pullback remains above the 0.5 Fibonacci level this will let me know that the trend still strong to the buyside. If it falls below the 0.5 simply means the trend is getting weaker. The Fibonacci 0.8 Level is a very strong area; it will be though to break that zone unless is caused by a red folder news tomorrow. So, my bias for this pair is bullish, but price perhaps fall to the 0.8 Fib level if the 0.5 - 0.7 levels isn't strong enough. Theres also and order block between the 0.8-1 Fibonacci level making the 0.9 Fibonacci level the sweet spot. A quick sell in order to buy by the market maker, so price will eventually target this area but for now, i see that we are targeting new highs we need more conformation, and this usually happens when we get closer to the Open Session of London . I will put the Risk to reward tool just for educational purpose and opportunity i will put one for current price and one more conservative position which is a pending buy limit around 1.34450.

Long on EU/USD Lovely fresh demand zone waiting to be kissed. Liquidity just down that and a wonderful 75% Fib retr in the same area!
SL 1.1617
TP 1.19/1.20
🏄♀️🚀🛸

ASTER $1 NEXT DO NOT WAIT OR MISS!Aster has CZ from #Binance interest. There is value here in my opinion based off that alone!
Next we have my analysis which shows the next draw on liquidity which should be around $1.
Calculate Your Risk/Reward so you don't lose more than 1% of your account per trade.
Every day the charts provide new information. You have to adjust or get REKT.
Love it or hate it, hit that thumbs up and share your thoughts below!
This is not financial advice. This is for educational purposes only.

FJET - Gaps, Demand & the Next Decision Point!📊Markets don’t move randomly... they react to unfinished business.
📈After the explosive post-listing move , Starfighters Space AMEX:FJET left a clear price gap above ($23 - $24 area), followed by a controlled pullback into a well-defined demand zone around the $8 – $9 area.
Since then, price has been compressing inside a descending channel, reflecting short-term bearish pressure rather than structural weakness.
What matters now is context 👇
This pullback is happening after an impulse.
📈 What's Next?
FJET is approaching the lower end of the falling channel while sitting on higher-timeframe demand.
This creates a classic decision zone:
– Hold demand → structure shifts bullish
– Lose demand → deeper correction before continuation
A critical factor will be how price reacts near the lower channel boundary. A reclaim of structure would open the door for a rotation higher, with the gap zone above acting as a price magnet. 🧲
A sustained break above the falling channel (marked in red) would signal a transition in momentum from bearish to bullish.📉📈
💡 Why This Matters
Gaps often act like unfinished chapters in the market. When structure stabilizes, price tends to revisit them, not because of hope, but because of order flow mechanics.
The plan is to wait for price confirmation and then follow the trend.
⚠️ Disclaimer: This is not financial advice. Always do your own research and speak with your financial advisor before investing.
📚 Stick to your trading plan regarding entries, risk, and management.
Good luck! 🍀
All Strategies Are Good; If Managed Properly!
~ Richard Nasr
Disclaimer: I have been paid $1,000 by CDMG, funded by Starfighters Space, to disseminate this message.

XAUUAD READY FOR PULLBACK (READ CAPTION)Hi traders what do you think about gold
Gold (XAUUSD) is currently forming a sell retest setup, where price is retracing upward into key resistance zones before a potential bearish continuation. This structure supports a sell-on-retest strategy.
🔹 Resistance Zone: 4527–4531
This is the primary sell zone where price is expected to face rejection.
If the market retests this zone and shows bearish price action (rejection wicks or bearish candles), it confirms seller dominance.
🔹 Second Resistance: 4555
This level represents the upper resistance and invalidation zone.
A strong rejection from 4555 would further strengthen the bearish outlook, while a sustained break above it may weaken the sell setup.
🔹 Support: 4496
This is the first downside target where price may pause or form a minor bounce.
A confirmed break below 4496 signals continuation of bearish momentum.
🔹 Demand Zone: 4457
This is the main downside target and demand area.
If price breaks below 4496, Gold is likely to move toward 4457, where buyers may step in for a reaction or short-term consolidation.
📉 Market Outlook (Retest Logic)
Retracement into 4527–4531 → Sell opportunity
Rejection from resistance → Confirms bearish continuation
Break below 4496 → Opens path toward 4457 demand zone
Demand zone reaction will determine next move
The overall structure favors a bearish retest → continuation setup, unless price breaks and holds above 4555
please don't forget to like comment and follow thank you

Gold - Breakout, Retest, Reload?Gold continues to respect a clean bullish structure 📈 on the 4H timeframe. After breaking above the previous all-time high, price has shifted that level into demand, confirming strength rather than exhaustion.
⚔️The rising blue trendline remains intact , and every pullback so far has been met with aggressive dip-buying, reinforcing the trend-following environment.
As long as price holds above the highlighted demand zone, the bias remains firmly bullish.
From here, the plan is simple and disciplined:
🏹I’ll be looking for longs on pullbacks into demand, in alignment with the trend, rather than chasing price higher. A clean reaction from this zone keeps the path open for continuation toward new highs.
⚠️ Disclaimer: This is not financial advice. Always do your own research and manage risk properly.
📚 Stick to your trading plan regarding entries, risk, and management.
Good luck! 🍀
All Strategies Are Good; If Managed Properly!
~Richard Nasr

XAUUSD READY FOR RETEST (READ CAPTION)Hi trader's what do you think about gold
Gold (XAUUSD) is currently showing a bearish retest structure, where price is retracing upward into key resistance levels before a potential continuation to the downside. This type of movement indicates a sell-on-retracement setup.
🔹 Resistance: 4443
This is the first bearish rejection level.
If price retraces into 4443 and shows rejection (wicks or bearish candles), it strengthens the bearish continuation scenario.
🔹 Resistance: 4463
This is the major resistance and optimal sell zone.
A rejection from 4463 would confirm that sellers remain in control after the retracement.
🔹 Support: 4419
This level acts as the initial downside target.
A clean break and close below 4419 will confirm bearish momentum continuation.
🔹 Demand Zone: 4383
This is the main downside target and demand area.
If price breaks below 4419, the market is likely to move toward the 4383 demand zone, where buyers may attempt a reaction or short-term bounce.
📉 Market Outlook (Retest + Retracement Logic)
Retracement into 4443–4463 → Bearish selling opportunity
Rejection from resistance → Confirms bearish continuation
Break below 4419 → Opens path toward 4383 demand zone
Demand zone reaction will decide the next market phase
Overall, the structure supports a bearish retracement → retest → continuation setup, favoring sellers unless price breaks and holds above 4463.
please don't forget to like comment and follow

XAUUSD Bullish Continuation SetupXAUUSD – H1 Timeframe Bullish Analysis
Overall Trend
XAUUSD is respecting a bullish trendline, which confirms that the market is still in an uptrend.
Price is forming higher lows, indicating that buyers are in control of the market.
As long as the bullish trendline holds, the market bias remains bullish.
Demand Zone
The confluence of the demand zone and the bullish trendline strengthens the probability of upward continuation.
Buyers are likely to defend this zone.
Triangle Pattern
Price is forming a symmetrical / ascending triangle.
This pattern usually acts as a continuation pattern in an uptrend.
Price compression inside the triangle indicates that a strong breakout is likely.
Breakout Expectation
A clean H1 candle close above the triangle resistance will confirm a bullish breakout.
After the breakout, price is expected to move toward the next all-time high (ATH) at 4420.
MACD Indicator
MACD is showing bullish momentum stabilization.
The contraction of the histogram suggests that momentum is building and an expansion may follow soon.
A bullish MACD crossover or expansion above the zero line will further support the upside move.
Trade Plan (Bullish)
Buy Entry: now 4327 or after the triangle breakout.
Stop Loss: 4305
Take Profit:
TP1: Previous high 4355
TP2: Next resistance 4390
Final Target: ATH 4420
Disclaimer
This chart is for educational purposes only and does not constitute financial advice. Trading involves high risk; always conduct your own research and use proper risk management.

$NEAR / Accumulation Broken Down- UPDATED CHART -
Removed accumulation box as it is fully broken down past demand/support as well and noted the change of character to the downside ✍🏽
Next weekly demand/support level to watch is $1.00. Hard to see us dipping even further but ready with dry powder if we do.
Still willing to add to my position with NEAR but not until buyers come back. #paytience

Moon City Incoming! $250! NEXT!Price action has been very bullish over the past few days and if this 4HR demand holds (Red box), $250 can be next!
Calculate Your Risk/Reward so you don't lose more than 1% of your account per trade.
Every day the charts provide new information. You have to adjust or get REKT.
Love it or hate it, hit that thumbs up and share your thoughts below!
This is not financial advice. This is for educational purposes only.

NETFLIX NEXT MOVE UPNFLX has completed a significant bearish displacement from the highs and is now trading into a well-defined higher-timeframe demand zone, which previously served as the origin of a strong impulsive rally. The current decline shows signs of momentum deceleration as price approaches this area, increasing the probability of sell-side liquidity being absorbed.
From a market structure perspective, price transitioned from an uptrend into distribution, followed by a clean break lower. This move has now extended far enough to justify expectations of at least a corrective reaction, provided demand holds. Multiple supply zones overhead explain prior rejections, making this a location-based swing rather than a trend continuation play.
The plan is to wait for confirmation within the demand zone (bullish daily close, rejection, or lower-timeframe structure shift). Risk is clearly defined below demand, while upside targets sit at prior internal range highs and untouched supply zones above, offering favorable risk-to-reward. If demand fails with acceptance below, the setup is invalidated — no trade.

Gold (XAUUSD) Price Action From CHAOS to Structure [RCOHelpline]📊 GOLD (XAUUSD) – 15m | Market Structure Outlook
Gold is currently trading inside a CHAOS / Stop-Run phase,
where both sides of liquidity are being collected and no aggressive entry is justified yet.
🔍 What we see:
Liquidity has been swept and price is consolidating
Red zone → Risk / Stop-hunt area
Green zone → Potential upside target only after confirmation
Bullish continuation is valid only if structure holds and reacts cleanly
⚠️ Important:
As long as the market remains in CHAOS and lower-timeframe structure is not reset,
early or emotional entries carry high risk.
🎯 Approach:
Wait → Confirm → Execute
No prediction. No bias.
⬇️ Free Indicator
To use the indicator used in the right-side table,
click here 👉

GBPUSD BREAK CHANNEL (READ CAPTION)Hi trader's what do you think about gbpusd
GBPUSD is currently showing a bearish market structure, with price trading below key resistance levels and sellers controlling the overall trend. The price action suggests further downside continuation unless major resistance levels are broken.
🔹 Resistance: 1.34040
This is the primary resistance level where price has previously faced strong rejection.
As long as GBPUSD remains below 1.34040, bearish pressure is expected to continue.
🔹 Resistance: 1.34601
This is the major upper resistance and a strong sell zone.
If price retests 1.34601 and fails to break above, it would further confirm bearish continuation.
🔹 Support Zone: 1.33127
This zone acts as the first downside support, where temporary pauses or minor bounces may occur.
A confirmed break below 1.33127 will open the path for further downside movement.
🔹 Demand Zone: 1.31983
This is the key demand area where buyers are expected to step in strongly.
If price reaches 1.31983, a bullish reaction or consolidation is likely, but overall bias remains bearish until resistance levels are broken.
📉 Market Outlook
Below 1.34040 / 1.34601 → Bearish continuation expected
Break below 1.33127 → Targeting 1.31983 demand zone
Demand zone reaction will determine the next major move
please don't forget to like comment and follow

Live trading on MRK stock.We enter Wave 5 in the demand zone.
NYSE:MRK
Wave 4 done
We have two profit-taking zones.
Follow proper risk and money management.

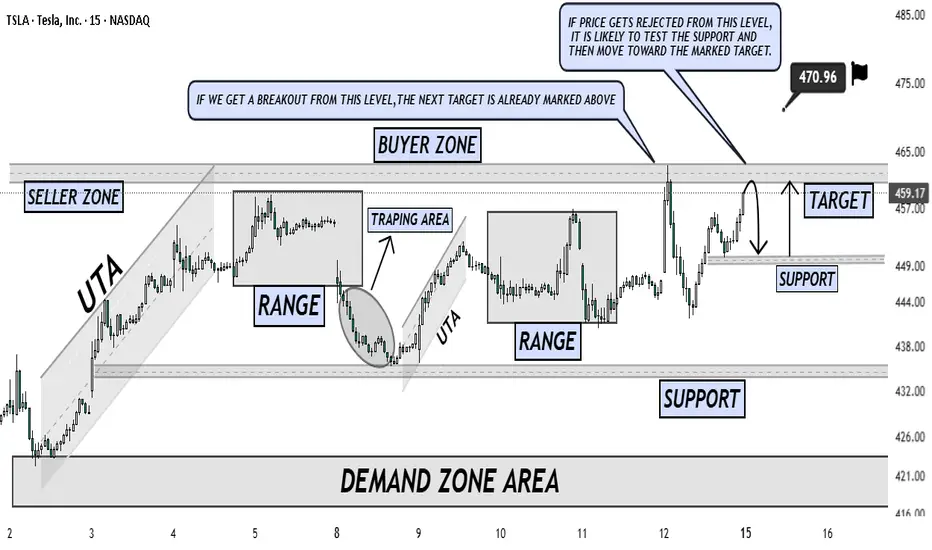
TSLA — Range Structure, Rejection Risk & Breakout Continuation TSLA is currently trading inside a well-defined range after a strong upside move from the demand zone, showing clear market structure with buyer and seller zones in play. Price has already reacted from the upper resistance area, where rejection is possible, indicating that sellers are defending this level aggressively.
If price fails to sustain above the buyer zone and shows rejection, a pullback toward the marked support level is likely, where liquidity and demand could step in before continuation toward the target. However, a clean breakout and acceptance above the resistance zone would invalidate the rejection scenario and open the path toward the next upside target already marked on the chart.
This setup highlights both scenarios clearly: rejection leading to a support retest, or breakout confirming bullish continuation. Patience and confirmation around key levels remain critical for execution.
XAGUSD (Silver) – 1-Hour Timeframe Tradertilki AnalysisMy friends, good morning,
I have prepared an XAGUSD-Silver analysis for you on the 1-hour timeframe.
My friends, if XAGUSD-Silver reaches the levels between 60.69393 and 60.11226, I will open a buy position and target the 63.16603 level.
My friends, I share these analyses thanks to each like I receive from you. Your likes increase my motivation and encourage me to support you in this way.🙏✨
Thank you to all my friends who support me with their likes.❤️
