GBP/USD Market Analysis: Potential Short Setup at ResistanceThe GBP/USD pair is trading near the **1.3000** psychological level, showing signs of consolidation after a strong bullish move. The chart suggests a potential reversal as price approaches a key resistance zone, with an apparent liquidity grab at the recent high.
The highlighted area around **1.2946 - 1.2921** represents a significant **H4 demand zone**, where price could retrace before continuing its next move. A break below this zone would indicate a deeper correction, with potential downside targets towards **1.2870** (OA level).
**Key Considerations:**
- A sustained break above **1.3000** could invalidate the bearish setup, leading to further upside momentum.
- A rejection at this level, combined with bearish price action, could confirm a short opportunity with a target towards the demand zone and lower support areas.
**Conclusion:** Traders should monitor price action around the resistance level and confirmation of a bearish reversal before committing to short positions. If bullish momentum persists, a breakout could open the door for further gains.
Demand Zone

SOL Trading Plan: Stacking Entries Like a ProSolana (SOL) has been in a slow uptrend over the past five days, after hitting the low at $112. The current price action looks like an ABC corrective pattern, which could mean we’re setting up for lower prices.
To get the best trade execution, we'll use a laddered entry approach, meaning we’ll scale into positions gradually instead of going all in at once. This helps us get a better average entry price while managing risk effectively. By placing orders at key levels, we increase our chances of catching the right move without overcommitting too early.
Resistance Zone ($136 - $143.80)
A major resistance zone has formed between $136 - $143.80, where price is likely to struggle. This area contains multiple technical confluences that suggest a potential reversal or strong reaction:
$136 – 0.618 Fibonacci Retracement
$140.09 – 1:1 Trend-Based Fibonacci Extension
$141.40 – Anchored VWAP from the $179.85 swing high
$143.80 – Point of Control (POC) from the 19-day Fixed Range Volume Profile
This makes $136 - $143.80 a prime area to consider short positions, especially if price starts showing weakness.
Support Zone ($102.1 - $98.50)
On the downside, a major demand zone is forming between $102.1 - $98.50, where buyers are likely to step in aggressively. This zone has multiple technical confluences, making it a high-probability long entry area:
$102.1 – 2024 Yearly Open & Monthly Support
$100 – Bullish Monthly Order Block & Anchored VWAP Support
$98.50 – Final key demand zone
This zone presents a solid long opportunity, allowing for gradual scaling into positions as price moves deeper into support.
Short Trade Setup – Laddered Entry Approach
Instead of entering all at once, we’ll ladder into the short position gradually, starting small and increasing size as price moves deeper into resistance.
Short Entry Levels & Position Sizing
Trade Details
Average Entry Price: $140.12
Take Profit Target: slightly above $102.10 (Monthly Level)
Stop Loss: slightly above $146.70 (Above POC)
Risk-Reward Ratio (R:R): ~6:1
Long Trade Setup – Laddered Entry Approach
For the long setup, we start with small entries at higher prices and increase size as price moves deeper into support, ensuring a better average entry in a key demand zone.
Long Entry Levels & Position Sizing
Trade Details
Average Entry Price: $102.72
Take Profit Target: slightly below $120.00
Stop Loss: slightly below $95.00
Risk-Reward Ratio (R:R): ~2.45:1
Market Outlook
Short Bias: Until price reclaims $143.80, this remains a strong resistance zone for potential short trades.
Short Setup: Laddering into resistance ensures better risk management and higher average entry efficiency.
Long Setup: Starting small at $112 and increasing position size down to $98.50 ensures strong positioning in a high-confluence demand zone.
By scaling into trades rather than committing at a single price, we increase flexibility, improve trade execution, and adapt better to price movements. 🚀
Weekly Timeframe - 200 EMA Support
$100 coincides with the 200 EMA on the weekly timeframe, adding confluence to this area as strong support.
If Solana decisively breaks above $144, it would invalidate the short thesis and suggest a potential move higher toward $150. Conversely, a strong rejection from the resistance zone would likely accelerate the move toward $112 to test demand at swing low.

Chart is crystal clear. Reaction on divergence at support.All liquidity on the upperside are left open. No reason to not go down while these are open.

Buy idea on USD/SEKBased on
- Cycle analysis and quantitative data
- Strong Demand Zone
- Undervalued Conditions

US30 (Dow Jones) 4H & 1H Analysis US30 is currently trading in a well-defined downward channel, making lower highs and lower lows. The next critical support sits near the 31,880 “Major Low,” where any decisive break could lead to further downside. On the upside, watch for a potential bullish bounce targeting the fair value gap and Fib confluence around 32,400–32,500. A breakout above the channel top may signal a trend shift, while a rejection there would likely keep the bearish momentum intact. Always monitor price action and manage risk around these key levels.

Buy Idea on Amazon (AMZN)Based On Post Election Cycle,Demand Zone, Quantitative data and undervalued conditions
stop 194.99
entry 207.93
tp 246.84

Buy Idea On Rice (ZR1!)Based on
Decennial Pattern Cycle and quantitative Data
Strong Demand Zone
Entry 13.610
Stop 13.260
TP 14.660

How to Find Best Supply and Demand Zones/Areas in Forex & Gold
In this article, I will show you the strongest supply and demand zones.
These zones are called confluence zones.
I will teach you to identify these areas properly and explain how to apply it in Forex and Gold trading.
Let's start with a short but important theory.
In technical analysis, there are 2 types of supports and resistances.
Horizontal structures are supports and resistance that are based on horizontal key levels.
Vertical structures are supports and resistance that are based on trend lines.
A confluence supply or demand zone, will be the area of the intersection between a horizontal and vertical structures.
Look at GBPJPY pair. I underlined a significant horizontal support and a rising trend line - a vertical support.
We see a clear crossing of both structures.
The trend line and a horizontal support will compose a narrow, contracting area. It will be a confluence demand zone.
Within, with a high probability, a high volume of buying orders will concentrate, and a strong bullish movement will initiate after its test.
Above is one more example of a powerful demand zone.
It was spotted on a Gold chart.
Now let's discuss the supply zone.
There are 2 strong structures on GBPNZD: a vertical resistance - a falling trend line and a horizontal resistance.
These 2 resistances will constitute a confluence supply zone.
That is a powerful resistance cluster that will concentrate the selling orders. Chances will be high to see a strong bearish movement from that.
There is a strong supply zone on CHFJPY that is based on the intersection of a wide horizontal resistance and a falling trend line.
Supply and demand zones that we discussed are very significant. Very often, strong bullish and bearish waves will initiate from these clusters.
Your ability to recognize these zones will help you to make accurate predictions and identify a safe point to open a trading position from
❤️Please, support my work with like, thank you!❤️

BTCUSD TODAY ANALYSISThis is my analysis for BTCUSD, where I am currently analyzing the 4-hour time frame. At the moment, BTCUSD's price is consolidating on the daily time frame. Based on my analysis, I will be looking at a bearish market today. Once the price reaches my key level, I will observe its behavior and rejection confirmation before pulling the trigger on my trade.
Always use stoploss for your trade.
Always use proper money management and proper R:R ratio.
This is just my analysis or prediction. Let's see what happens.
#BTCUSD 4H Technical Analyze Expected Move.

LONG ON USOILOil is currently rising from a major demand zone.
It has broken out of a nice double/triple bottom and a downtrend line.
I expect price to tap into the demand zone as a pullback from its recent break of a high and then continue to rise.
I am buying oil and expecting it to rise to the next supply level for just about 200 pips or a $2 move on.

GBP/USD Longs from 1.25800 up to the 7hr supplyFor this week, I expect GBP/USD to retrace back to the clean, unmitigated 18-hour demand zone before pushing back up toward the 7-hour supply zone that I previously marked. If this move doesn’t play out as expected, I anticipate price will first mitigate the 7-hour supply zone before slowing down and distributing within my point of interest (POI).
From there, I’ll be watching for a short move back to the 18-hour demand zone, where I plan to enter buys and continue trading in alignment with the overall market trend. Since price is currently near both POIs, I’ll be keeping a close eye on this setup.
Confluences for GU Buys:
✅ Strong bullish trend with consistent breakouts to the upside.
✅ 18-hour demand zone remains unmitigated and was the origin of the last bullish move.
✅ 7-hour supply zone above that also needs to be mitigated.
✅ The Dollar Index (DXY) has been very bearish, further supporting GBP strength.
Alternative Scenario:
If price reacts strongly from the 7-hour supply zone and breaks below the 18-hour demand, I’ll shift my focus to my next buy zone around 1.25200.
Wishing everyone a profitable trading week—let’s finish it in BLUES! 🔵

KEI INDUSTRIES - Short Term Trade Setup with Liquidity Grab!INDUSTRIES LTD today. This one’s looking interesting, with the stock currently in a consolidation phase , stuck between a supply zone and a demand zone . The best part? We’ve had a liquidity grab near the demand zone, which means the stock is back in a sweet spot for a potential move upwards. If the price starts bouncing off that level again, we could see some nice profits.
For the entry point , you want to get in around ₹3,750-3,700 , right where the stock is testing the demand zone. The stop loss should be just around at ₹3,500 , giving you some room to manage the trade. The profit target is around ₹4,560 , near the supply zone. That gives you a good risk-to-reward ratio and the potential for a solid move if the stock continues up.
Disclaimer:- This analysis is for educational purposes only. Please trade responsibly and consult a financial advisor before making any decisions.
If you found this analysis helpful, don’t forget to like, follow, and share your thoughts in the comments below! Your support keeps me motivated to share more insights. Let’s grow and learn together—happy trading!

LONG ON COPPERPrice is in Great uptrend structure from the HTF.
Price has completed its pullback all the way to a Key Demand area.
Its also built up liquidity to be swept right above that demand zone.
I expect price to swept buy side liquidity to the downside, tap into demand, then take off to the upside.
I am buying copper.

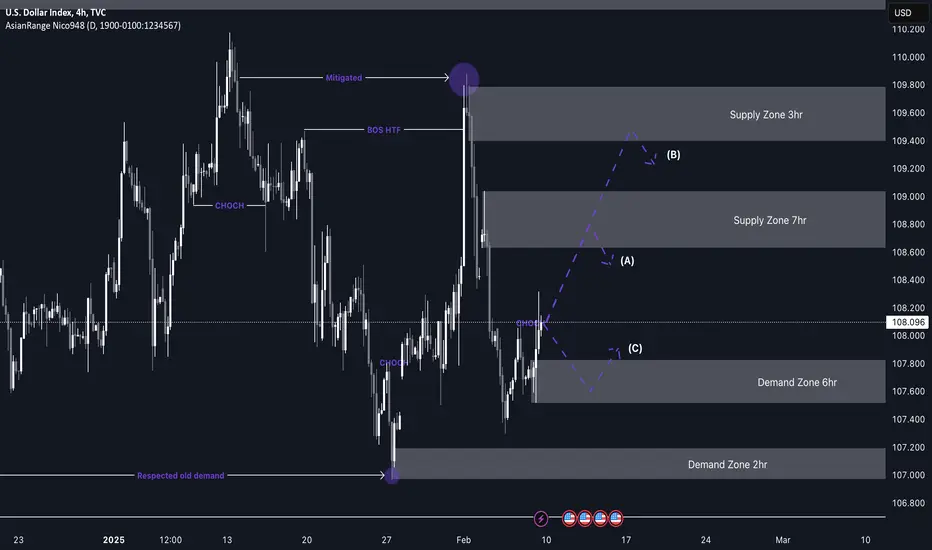
DXY (Dollar index) short from 108.800My DXY analysis aligns with the expectation of a bearish move, which suggests that my pairs—EU and GU—could push higher. However, before that, we may see a minor pullback as price moves toward a demand zone.
Price has recently broken structure to the upside, leaving behind a fresh demand level. Once price reaches this area, I anticipate accumulation before a potential move upward. I will look for opportunities to capitalize on this movement across the pairs I trade, such as Gold, EU, and GU.
The price action has been very clean so far, which is promising, and we can expect more of the same as we move further into Q1.
Have a great week ahead and remain vigilant!
PEPE/USD Bullish Breakout: Demand Zone Holds, Reversal in Sight?PEPE/USD has been gaining attention as it trades near a critical juncture. With the daily demand zone holding strong and signs of a downside channel reversal, the pair could be on the brink of a bullish breakout. In this analysis, we’ll break down the technical indicators and patterns that suggest PEPE/USD might be ready to reverse its downtrend.
Daily Demand Zone Holding Firm
One of the most significant factors supporting a potential bullish move is the respected daily demand zone. This area has provided strong support, acting as a floor for buyers to step in. A failure to break below this zone increases the probability of an upward momentum shift.
Key Support Levels: Highlight exact price levels in the demand zone.
Volume Analysis: Look for increased buying volume around these levels, which could signal accumulation by bullish traders.
What to Watch For Before Confirmation
While the technical signs are promising, traders should remain cautious. Key events to watch include:
Breakout Above Resistance: Identify the breakout level for confirmation
Retest of the Channel Top: Look for a retest and bounce as confirmation of strength.
Market Sentiment and Volume: Monitor trading volume and broader market sentiment.
Conclusion: A Bullish Opportunity?
The combination of a respected daily demand zone and a downside channel reversal pattern makes PEPE/USD a pair to watch. A confirmed breakout could set the stage for a bullish run, providing traders with an exciting opportunity. As always, use risk management and stay updated with the latest price action.

Long Idea on CC1! (Cocoa)1)Climate change is having a significant impact on cocoa production in West and Central Africa, according to a study by Wageningen University & Research (WUR). The region accounts for more than 70% of global cocoa production. Changes in temperature and rainfall are making some areas less suitable for cocoa cultivation.
2) Seasonality gives us a bullish pattern which is 98% correlated with the actual price
3)quantitative data shows 80% win rate with a good profit factor
4) The price rejected the 50 EMA forming a Pin Bar Candlestick pattern
5) The price also bounced on a demand zone
6) Price is undervalued against several benchmarks

Bitcoin Reversal? Demand Zone Holding Strong!
BTCUSD has shown a strong reaction to the Demand Zone, indicating potential bottom formation. The price has tested this level multiple times, suggesting institutional interest and a possible bullish reversal.
🔹 1.272 | Conservative Takeprofit → 116,847.33 USD (+19%)
🔹 1.618 | Most common Takeprofit after retracement → 123,783.73 USD (+26%)
🔹 2 | Strong uptrend Takeprofit → 133,358.11 USD (+36%)
With a favorable risk-to-reward setup, Bitcoin could be positioned for a significant upward move. Will BTC reach these Fibonacci targets? 📈
What’s your view on this setup? Drop your thoughts in the comments! 👇

EUR/USD Outlook to recover the imbalance My EU outlook for this week is similar to GU as the dollar index gapped to the upside which made pairs like GU and EU to drop down heavy. once price did so it did breach a lot of my previous demands so we have to now adapt and re adjust our analysis and forecast.
So i have this demand zone that as you can see is getting reacted off of which what i drew out a. while ago which is the 8hr demand zone. I feel like this zone will hold as there is of validity. If price reacts well and manages to cover that gap i will then look to short inside the 1hr supply zone but after finding of course LTF confirmation.
COnfluences for EU Buys are as follows:
- The price gap has left a significant imbalance that needs to be filled.
- Price is currently in a 8-hour demand zone that previously caused a Break of Structure (BOS),
making it a valid POI.
- There is a large pool of liquidity to the upside that needs to be taken.
- The setup aligns well with the DXY correlation.
- For price to carry on going down it must form a correction to the upside regardless.
P.S. If price decides to go lower then we might be in a bearish trend temporarily and will have to look for a new near by supply to capitilise on a shift of trend to the downside. Thats if this 8hr demand doesn't hold.

Long Entry on SOLUSDT – How to Trade a Bullish Demand Zone 🚀 **Long Setup on SOLUSDT – Bullish Demand Zone Confirmation** 🔥
📌 **Key Trading Idea:**
This trade setup is based on **demand zone theory**, where price creates a strong bullish reaction after testing a fresh demand level. Here’s a breakdown of the strategy:
✅ **Demand Zone Identified:** A high-probability area where buyers are stepping in.
✅ **Entry Point:** Price confirmation after a bullish demand zone is created on h1 or m15.
✅ **Stop Loss & Target:** Risk management is applied based on key Fibonacci retracement levels.
✅ **Volume Confirmation:** Strong volume uptick supports bullish momentum.
📊 **Why This Trade Works?**
- **Liquidity Grab**: Weak hands get shaken out before the real move.
- **High R/R Ratio**: A favorable risk-to-reward trade.
🎯 **How to Trade This Setup?**
📉 **Wait for a clear bullish rejection or a new demand zone created on h1 ** before entering.
📈 **Confirm with volume** – No volume = No trade.
⚡ **Set realistic TP levels** based on Fibonacci & previous resistance.
💡 **Follow for More Trading Insights & Chart Breakdowns!** 📊
📩 **Drop a comment if you’re taking this trade! 🔥**
#SOLUSDT #CryptoTrading #TradingView #PriceAction #SmartMoney #DemandZone #Forex #CryptoAnalysis #TechnicalAnalysis #LongEntry #BreakoutTrading

Long Idea On EthereumBased on my propietary indicator tools,i see a good opportunity to go long on ETH1!, seasonality gives us a clear long bias and on the POIV we can see a divergence.

GOLD ANALYSIShi guys
If you look carefully, there is a liquidity line right next to our OB, which means that the price is MOST likely (90%) to react to the area.
Considering that the general structure of the market is bullish,A bearish position is high risk, that's why I am waiting for the confirmation of the fall, which in fact is a CHOH that i show in chart.
this is just a analyse and The final decision of the position is yours and find entry points according to your own strategy

NDQ100 Update - Overaction? Thanks for checking out our latest update. Today, we are looking at the NDQ100 daily chart.
What a 48 hours we have seen. After a plunge that wiped off up to 1 trillion dollars and close to 600 million off Nvidia, we saw a fast fightback at the end of the session and a recovery on Tuesday. The crash occurred after Chinese Tech company DeepSeek shocked the AI world with a powerful LLM.
Looking at the last price action, has support reformed? Will we see the new push higher after this last seller test? Buyers look interested, but we would like further confirmation with rallies that fill the gap or a test of the last high.
Good trading from Eightcap.

Yesterday, the chart dropped sharply. What should we do next?Based on the plan I made for the week, I anticipated that the price of XAUUSD wouldn’t drop below 2735. However, the result was that on just Monday alone, the chart dropped significantly, breaking through all 3 demand zones I had planned for.
Therefore, today we’ll adopt a day-to-day strategy. For today, the focus will be on selling since the price has shifted CHoCH at 2735 in both H1 and H4. We will wait for the chart to retrace to our POI zone , form a CHoCH in the smaller timeframe , and then look for an entry point from the newly created supply zone."
