BTC - Bulls Watching the Channel Support!📈Bitcoin remains overall bullish, trading cleanly inside its rising channel. Each dip toward the lower bound has acted as a strong springboard for the next impulsive move, showing clear demand from buyers.
⚔️As BTC approaches the lower trendline of the channel and the green demand zone, we will be looking for trend-following longs. This confluence area has held multiple times and continues to act as a key decision point for market structure.
🏹As long as BTC remains above this zone , the bullish scenario remains intact, and another push toward higher highs becomes the most likely outcome. Only a break below the demand zone would weaken the bullish outlook.
Now it’s all about the retest… will the bulls defend structure once again? 🤔
⚠️ Disclaimer: This is not financial advice. Always do your own research and manage risk properly.
📚 Stick to your trading plan regarding entries, risk, and management.
Good luck! 🍀
All Strategies Are Good; If Managed Properly!
~Richard Nasr
Demand Zone

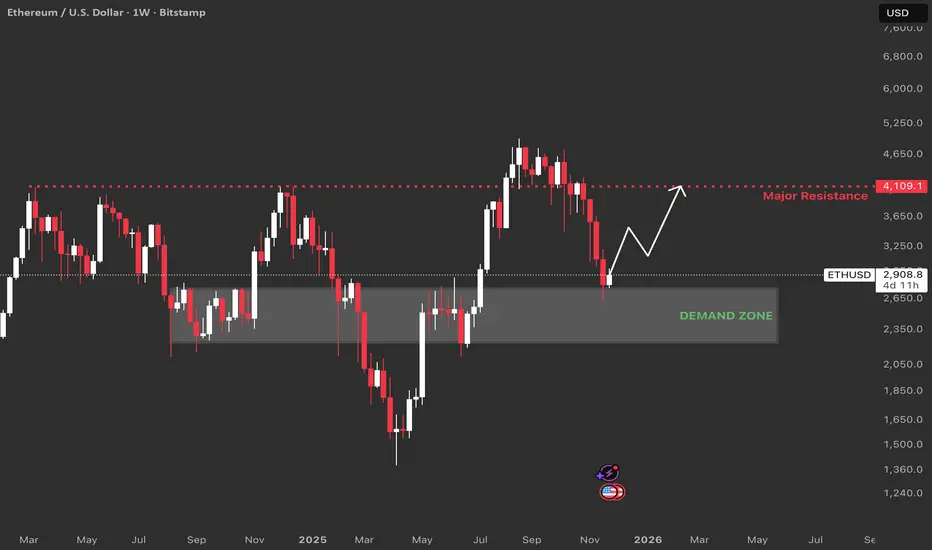
Ethereum Trade Setup: Weekly ChartDemand Zone : This area marks where ETH found buyers over multiple months, rejecting further declines. Historically, when price revisits this zone after a sell-off, it tends to bounce. The recent reaction confirms buyers are active and defending this level.
Major Resistance (4,109 USD) : It shows a prior weekly high and an expected supply or resistance area. This level also aligns with a golden pocket Fibb level, making it a confluence point where sellers could re-enter or bulls take profits.
Invalidation point: Weekly close below demand zone or multiple rejections with lower highs near demand.
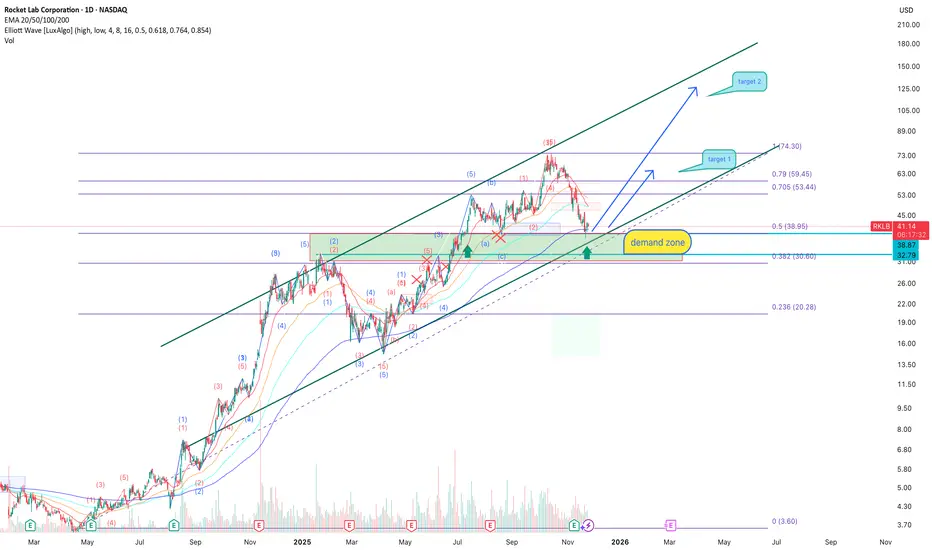
RKLB: demand zone may launch the next rallyRocket Lab remains one of the strongest long-term stories in the small-launch sector. The company continues expanding production capacity, scaling its launch cadence, securing new government contracts, and increasing recurring revenue from satellite services. The global demand for small-satellite deployment is growing faster than supply, and RKLB is steadily becoming the second major player after SpaceX in the commercial-launch and orbital-services niche. Additional growth in spacecraft manufacturing and analytics strengthens the company’s strategic positioning. From a long-term fundamental perspective, the recent price decline looks more like a technical correction inside a broader bullish cycle, rather than a structural reversal. For mid- and long-term investors, this area historically acts as a key accumulation zone -especially when fundamentals align with major technical supports.
Technically, price has held a major demand zone between 38–33 USD - the same zone that previously generated strong upward impulses. The correction stopped right at the 0.5 Fibonacci retracement (38.95), and buyers are showing absorption on lower timeframes. Price remains inside the broader ascending channel, while EMA 20/50 are stabilizing above the demand level, suggesting momentum may soon shift upward again. A clean entry setup forms once the market breaks and confirms the 0.705/0.79 Fibonacci cluster, opening the road toward the first target at 59.45 and then the extended target at 74.30. The bullish scenario remains valid as long as price stays within the demand zone and above the long-term trendline.
Fundamentally, the engine is already running -now all the chart needs is technical ignition to send RKLB back into the upper band of the long-term channel.
USDJPY - Bulls Watching the Intersection Zone!📈USDJPY remains overall bullish, moving steadily inside its rising channel. After a strong impulsive move upward, the pair is now forming a healthy correction, heading toward a key confluence area.
⚔️As price approaches the intersection of the lower trendlines and the demand zone, we will be looking for trend-following longs. This orange area has acted as a strong support multiple times, and with both trendlines meeting there, it becomes a high-probability spot for buyers to step in.
🏹If the bulls defend this zone , USDJPY could resume its upward movement and push toward new highs. Only a clear break below the demand zone would weaken the bullish outlook.
For now, the plan is simple: wait for the retest… then look for longs from structure. 🤔
⚠️ Disclaimer: This is not financial advice. Always do your own research and manage risk properly.
📚 Stick to your trading plan regarding entries, risk, and management.
Good luck! 🍀
All Strategies Are Good; If Managed Properly!
~Richard Nasr

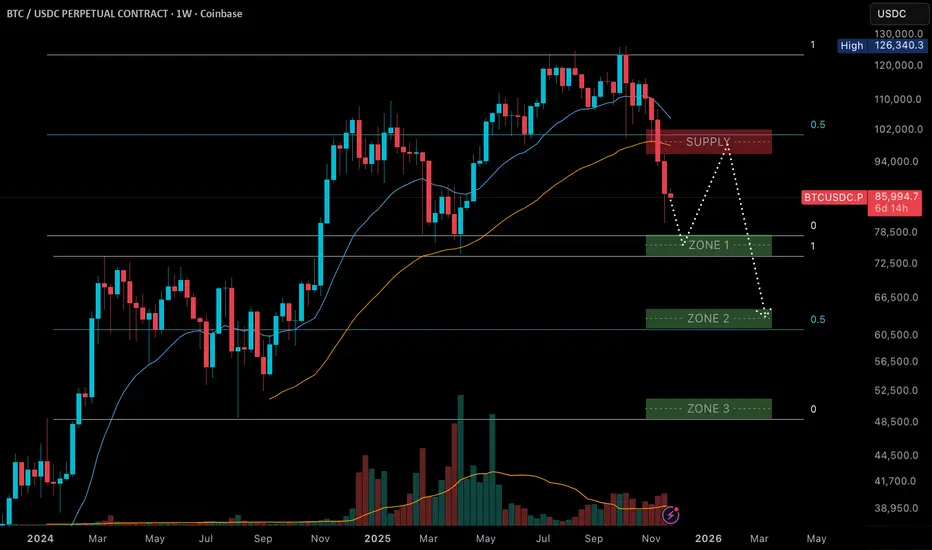
BTC Next weekly targetsMy last TA was on point at the top. However, the initial target isn't met yet. As we broke the weekly trend already, I expect a kind of a pullback to the supply (re-distribution area) and then back down.
Acceptance above the supply area would invalidate the idea. For now, I expect a little relief bounce to that area from here of from lower down before the next level gets revisited.
XAUUSD: We see a sell opportunity! Hello Traders,
This is the 1Y chart
We are defiantly bullish
The shorter-term chart is also bullish! However, we see some corrections and ranges lately.
For now!
I think we might have a chance to short the Gold around the zone we previously sellers were so strong.

AUDUSD: Complexity is in it's peak!Dear Traders, The Aussie is not easy to trade these days! However, I've been asked for an analysis. I suggested to risk less than an ordinary trade!
This is the daily chart
We might have seen newly form bearish channel! However, it might be just a correction!
We'll see
While we are ready for long in this setup!
A shorting from here with stop-loss over the bearish trendline is also considerable.

EUR/USD - Multi Timeframe Analysis🧭 WEEKLY – Big Picture Bias (HTF Boss Level)
The weekly is consolidating inside a massive range between the mid-1.14s and the mid-1.18s.
Price has been stuck in that orange consolidation box for ages — building orders, trapping both longs and shorts.
But here’s the key:
🔥 Wave count wants a (3) push up
🔥 Structure is still bullish
🔥 Lows are protected
🔥 Liquidity is stacked ABOVE
Weekly is screaming:
➡️ “When I break out of this range, I’m sending it toward 1.20+.”
This is the expansion phase loading.
📅 DAILY – The Transition Zone
Daily just broke structure (BOS) and is pulling back into a clean Daily demand block.
This is the “engine room” for the next leg.
✔️ Trendline retest
✔️ Clean demand
✔️ Deviation → reclaim
✔️ Rejection of lower channel
And above?
📌 External BSL at the top of the channel
Price LOVES that level.
Daily bias:
➡️ Pullback → continuation into 1.17 – 1.18 zone
Daily wants to go UP.
⏳ 4H – Execution Level (Where You Actually Enter)
This is where the chess game gets spicy.
4H is sitting right above strong support with:
🔹 BOS
🔹 Retest of weak resistance
🔹 Re-entry into the channel
🔹 Daily demand just below
🔹 Perfect wave (1)(2)(3)(4)(5) corrective structure already completed
4H is showing small bearish trendline pressure,
but it’s weak — not impulsive, not HTF aligned.
So the play is:
🔻 Let price tag the daily demand (grey box)
🔺 Load the buy
🚀 Send to 1.17 – 1.1850 entry zone
Once 4H breaks that weak resistance?
It becomes a clean runway.
🎯 Full Forecast Summary (Simple Version)
HTF (Weekly)
🚀 Bullish
📌 Consolidating before expansion
🎯 Target: 1.2000 area (after breakout)
Daily
🔻 Pullback into demand
🔺 Reversal expected
🎯 Target: 1.17000 – 1.18000
4H
🟦 Buy zone: Daily demand (grey box)
🔥 BOS already complete
🎯 First target: 1.17000
🎯 Second target: 1.18500
Bias :
➡️ Bullish after retest
➡️ Continuation move is building
➡️ Lows are protected, highs are exposed
⚡ The Story the Chart is Telling
“Let me correct into demand, tag the daily block, kick the weak trendline away…
then I’m flying to take every BSL above.”
This is clean SMC + Elliott alignment.
Textbook.

XNY / USDT — Key Demand Zone Tested, Bullish Continuation Ahead?XNY / USDT is showing strong potential for a bullish continuation towards $0.004880.
I am watching the $0.004090 – $0.003948 zone for a possible entry.
If the price reacts positively from this demand zone, it is likely to resume its upward move towards the target.
Note: A breakdown below this zone will invalidate the setup.
Always wait for confirmation before entering.

Gold - Next move🟡 GOLD – NEXT MOVE (Forecast)
This chart is screaming HTF correction vibe, lining up for a bigger rocket-launch leg once price finishes doing its clean-up job below. Let’s break it down 👇
🧱 1. Strong Resistance Above – The Big Ceiling
Price got smacked from that external BSL zone up top. That level is no joke — heavy sell orders sitting there, and the market reacted exactly as expected.
Think of that zone like the bouncer at the club:
➡️ “Not tonight bro.”
So yeah — rejection ✔️
🔻 2. Current Move = Sweepy Pullback Energy
Price is now dripping down in a corrective way.
Nothing impulsive.
Nothing aggressive.
Just a classic “let me grab liquidity before I send it” pullback.
We've already seen internal sell-side taken…
But the real bag sits lower. 👇
🧊 3. Strong Support Below – The Bounce Zone
That external SSL + demand block + trendline confluence zone is STACKED.
This is the place where market makers love to refill the engine before a major up-leg.
Expect price to:
✔️ Sweep liquidity
✔️ Tap the demand
✔️ Tag trendline
✔️ Rebalance the inefficiency
➡️ THEN send it 🚀
Basically…
“dip for the drip.”
📈 4. What’s Likely Next? (The Forecast)
Here’s the clean sequence:
🔻 Step 1 — Price dips into strong support
Red arrow on your chart nails the idea.
Expect that slow grind down, maybe a wick flush to catch late sellers.
🔄 Step 2 — Reversal formation
Small accumulation
Fake break
Wick trap
All the usual suspects.
🚀 Step 3 — Explosive rally back toward major resistance
Once demand holds, expect a fast, impulsive, and clean leg right back into the 4,300+ resistance zone.
This is where wave traders, SMC traders, and Elliott heads all agree:
BIG MOVE LOADING.
Wave (iii) also aligns perfectly with this.
🧭 5. Summary (Trader Friendly)
🔥 HTF = bullish (correction before continuation)
🧊 STF = bearish pullback into demand
🛒 Ideal Buy Zone = strong support + SSL
🎯 Target = 4,300 – 4,350
🚀 Bias = bullish after the sweep
⚠️ Avoid buying early — let the liquidity grab play out

DXY (DOLLAR INDEX) outlook for this weekDXY Weekly Outlook
Looking at the dollar this week, it’s aligning nicely with my setups on EU and GU. I’m watching to see if price will mitigate the 8hr supply zone, which fits perfectly with my plan to buy EU and GU from their demand zones — since a move down in the dollar typically means those pairs will push higher.
Alternatively, if the dollar bounces from demand and continues up, then I’ll be looking for sell opportunities on EU and GU instead.
Overall, DXY still looks bullish long term, and I believe this current downside move is just a temporary bearish correction before continuing higher.

GBP.USD Breakdown for the 2nd week of NovGU Weekly Outlook
My analysis this week for GU is focused on where this current bullish move could take us next.
- Scenario (A):
If price retraces back to the 12hr demand zone, I’ll be looking for potential bullish reactions from that POI — ideally waiting for a Wyckoff accumulation to form before taking any buys.
- Scenario (B):
If price continues pushing higher, I’ll watch how it reacts at the nearby supply zone. A rejection there could trigger a short-term pullback back towards demand, giving us another chance to buy from a better position.
Either way, we’ll see which POI gets tapped first and adapt from there. Let’s have a great trading week and catch those pips! 💪📈

USD/CAD - Sell off ready🧭 Bias: Bearish correction incoming
After a strong bullish leg into higher-timeframe supply, USD/CAD looks primed for a deeper pullback before any continuation move.
🕰 Weekly Outlook
Context : Price just tapped into a weekly supply zone sitting inside the 1.41–1.42 range — exactly where previous sell pressure originated.
Structure : Market has completed a corrective move into the 71% retracement of the prior swing range (a key reversal zone).
Expectation : A rejection from this area could kick off a weekly distribution phase, with potential downside targeting 1.33–1.32 demand.
Key Level: 1.4140 – watch this as the “make or break” ceiling for the bears to defend.
⏱ 8H Technical Breakdown
Trend : Price broke short-term structure (BOS) after sweeping external buy-side liquidity — a classic liquidity grab setup.
Zones of Interest:
🔵 8H Supply: 1.4050–1.4100 — the rejection point confirming short-term bearish orderflow.
🟢 Demand Zone: 1.3920–1.3970 — potential retracement area before further drop.
Moving Average: Price rejected the 200 EMA, reinforcing bearish bias.
Projection: Expect a corrective retest into the 1.40 region before continuation down toward 1.38–1.37 (next demand zone).
⚖️ Risk Management
Maintain stops above 1.4150 (weekly high).
Consider scaling partials near 1.39 and 1.36.
A clean close above 1.42 invalidates the bearish setup.
🧩 Summary
USD/CAD just hit a big liquidity pocket up top 🧱 — signs point to exhaustion. If the 1.41 zone holds, we could be looking at a multi-week bearish correction toward 1.33. For now, watch for a retest into supply before taking the short ride down. 🚀⬇️

Demand Zone in Focus: MSS Shift Signals Potential LongHello Traders,
Wishing everyone a productive week ahead! Today, price action is sitting at a clearly defined demand zone, and we’ve just seen a shift in market structure (MSS). Based on this, I’m looking to go long from the potential demand area.
However, keep in mind there’s still a strong external bearish trend. For added confirmation, consider waiting for a break of the last lower high (LH) before entering a long position.
Stay sharp and trade safe! 💪

BRENT OIL BUYWe're looking to take a low probability, -B buy setup. We say low probability because it is a bearish market. But it has been respect lows and demand zones in the discount area of a 15 minute range. So, we like the demand zone that formed yesterday off of a previous successful demand done. We're targeting a Daily FVG.

Long Bias Maintained – Waiting for LTF Confirmation from Demand Hello Traders,
I hope you're all doing well.
Reflecting on this pair: although price action moved in our favor yesterday, we didn’t get a valid entry. Today, I’m maintaining the same bullish bias and will look to go long from the recent demand zone, provided we get confirmation on the lower timeframes (LTF).
Let me know your thoughts on this analysis.
Happy trading!

#NEAR/USDT can give massive rally but breakout needed#NEAR
The price is moving within a descending channel on the 1-hour frame, adhering well to it, and is heading for a strong breakout and retest.
We have a bearish trend on the RSI indicator that is about to be broken and retested, which supports the upward breakout.
There is a major support area in green at 2.353, which represents a strong support point.
We are heading for consolidation above the 100 moving average.
Entry price: 2.437
First target: 2.529
Second target: 2.625
Third target: 2.744
Don't forget a simple matter: capital management.
When you reach the first target, save some money and then change your stop-loss order to an entry order.
For inquiries, please leave a comment.
Thank you.

Demand Zone Formed, Bulls Eyeing BSLHello Traders 👋
Hope your week is off to a strong and focused start!
Today on EURUSD, we’ve seen price shifting its fractal bias multiple times—clear signs of market indecision. But here’s where it gets interesting: after the latest shift in fractal structure, price delivered a strong bullish push, forming a fresh demand zone.
With this momentum, I’m anticipating a continued move to the upside, targeting the Break of Structure Liquidity (BSL). That said, LTF (Lower Time Frame) confirmation is essential before entering any buy trades—stay patient and let price validate your setup.
Stay sharp and trade with discipline

Gbp/Usd - Bearish Bos and Re-Test of Demand ZoneMarket Context:
The market was in a consolidation phase with multiple CHoCHs (Change of Character) visible on both sides.
A strong resistance zone was respected, followed by a bearish rejection from the highs.
Key Zones Identified:
🔵 Demand Zone: Price tapped into this zone and reacted, but eventually broke below, confirming bearish pressure.
🟢 Resistance Zone: Price failed to break above, leading to a reversal.
⚫ Support Zone (Target): Marked as the likely take-profit area for the sell setup.
Structure Breakdown:
Multiple CHoCHs occurred before the major break of structure (BOS).
Once price broke the demand zone and retested it (marked as "Break and Re-Test done"), a short position was triggered.
The entry is marked within a small pullback after the retest.
Trade Idea:
Entry: After confirmation of the break and retest of the demand zone.
Bias: Bearish.
Target: Support zone below, aligning with previous market structure and liquidity levels.
Indicators:
Price is trading below the EMAs, which aligns with the short bias.
EMAs are acting as dynamic resistance during the downtrend continuation.
Conclusion:
This setup follows a clean supply & demand + structure shift concept. The bearish trend is confirmed after multiple CHoCHs and a clean BOS, followed by a successful retest of the broken demand zone turned supply. Entry is aligned with bearish momentum and targeting the next major support.

Gbp/Jpy - Bullish Reversal From Demand ZoneDemand Zone (Blue Rectangle):
The price tapped into this zone and showed a rejection wick.
Suggests strong buying interest, as seen previously on October 7-8.
Acts as a support base for a potential reversal or bullish rally.
Resistance / Target Zone (Green Rectangle):
Previous support turned resistance, aligned with a weak high.
Logical target for a bullish move.
Near 205.000 psychological level — a good place for taking profit.
Entry Setup:
Entry Point: Marked at the edge of the demand zone.
Confirmation: Price rejection with a long wick and small-bodied candle indicates a possible bullish reversal.
Confluence Factors:
Break of Structure (BOS) and Change of Character (ChoCH) earlier in the trend.
The price is now creating a higher low, suggesting a potential trend shift.
Price is oversold (outer Bollinger band tapped), signaling a mean reversion.
Indicators & Tools:
Bollinger Bands:
Price touched the lower band (supportive of reversal).
Bands are starting to widen again, suggesting incoming volatility.
Parabolic SAR (dots):
Currently above price, indicating a bearish trend — but could flip if price breaks upward.
Moving Average (Green Line):
Price is below the MA — will need to break above for stronger bullish confirmation.
Trade Idea:
Bias: Bullish Reversal from Demand Zone
Entry: Around 202.600 (current level)
Target: 205.000 zone (resistance / weak high)
Stop Loss: Below demand zone — e.g., 201.900 (below the wick)
Risk Management & Notes:
Wait for confirmation (e.g., bullish engulfing or MA crossover).
Monitor for false breakouts — a break below demand zone invalidates setup.
Ideal R:R (Risk to Reward) appears to be 2:1 or better.
Summary:
This chart suggests a potential long trade setup based on price rejecting a strong demand zone, with a target set near a resistance/weak high area. If momentum builds and breaks above short-term resistance, a bullish move toward the 205.000 area is likely.

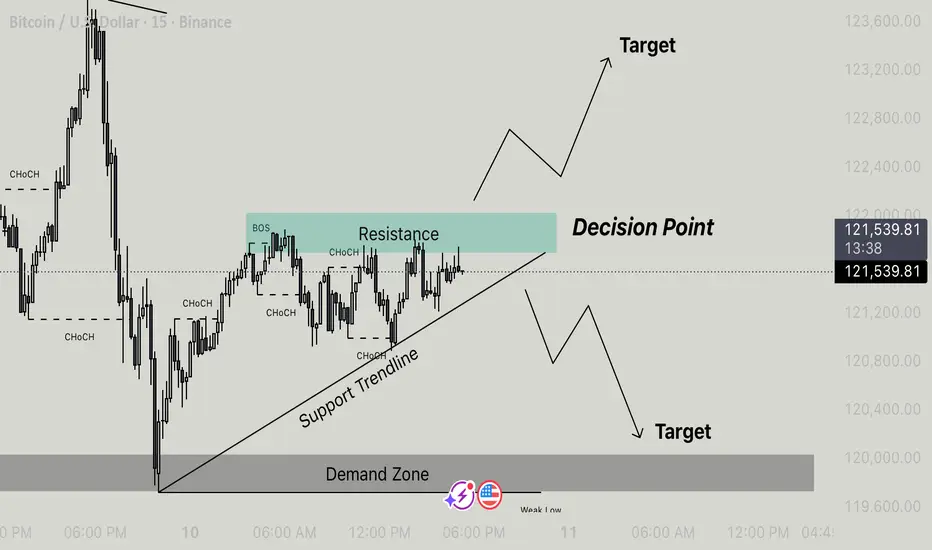
Btcusd - At A Critical Decision Point Bitcoin is currently trading around $121,575, consolidating near a key decision point where price action meets both resistance and the ascending support trendline.
Key Technical Zones
• Resistance Zone: 121,400 – 121,800
This area has acted as a rejection zone multiple times, forming the current decision point.
• Support Trendline: Connecting higher lows, showing bullish structure short-term.
• Demand Zone: 119,600 – 120,200
A strong reaction zone where price previously reversed — potential target if price breaks down.
Market Structure
• Multiple CHoCH (Change of Character) signals indicate short-term range-bound behavior.
• BOS (Break of Structure) confirms local bullish momentum but price is nearing resistance.
• Decision Point: Market could break either way soon, watch for confirmation.
Scenarios
Bullish:
• Break and close above resistance with retest → potential rally toward 122,800 – 123,200 target zone.
Bearish:
• Rejection from resistance or break below support trendline → possible drop toward Demand Zone (120,000 area).
Summary
Price is at a critical juncture — watch closely for breakout or rejection signals around 121,600. Traders should wait for confirmation before entering positions.
USD/JPY - Multi timeframe Analysis🔥 USD/JPY — Bit More In-Depth, Still Punchy
🧭 Weekly (HTF Bias)
Trend up. We just tagged 153–154 weekly supply (prior rejection zone).
Two paths:
Clean break & hold above 154 → 156–157 magnet 🎯
Wick/reject here → corrective dip toward 149–150 (old highs + demand).
📆 Daily (Structure Check)
Clear BOS up; daily 50-EMA + structure stack around 149.2–150.2 = prime buy-the-dip area.
Expect a liquidity sweep under 150, then reclaim → rerun 153.5–154.
Daily close <147.8–147.5 = momentum shift ⚠️
⏰ 8H (Execution Map)
Rising liquidity trendline guiding pullbacks.
Buy Zone 1: 149.2–150.2 (trendline + demand + prior high).
Buy Zone 2 (deep discount): 144.8–145.6 if we get a full flush.
Above 151.5–152 and holding? Bulls may skip the deep dip and rocket straight back into 153–154 🚀
🧩 Trade Plan (rules-ish)
Primary idea (pro-trend):
Wait for sweep/reclaim of 150 on LTF (H1/H4 close back above).
Entry : 149.8–150.2 retest.
TPs: 152.2 → 153.5 → 154.8–155.2.
Invalidation : H4 close <149.0 (safer: <147.8).
Alt (only if strong breakout):
H4 close >154.2 + retest holds → ride to 156.0–157.0.
Counter-trend scalp (advanced): bearish wick rejection inside 153.5–154.2 → tag 151.6–150.8 “snack stop,” then look to flip long.
Summary : Bias bullish, hunting a dip to 150 for continuation. Lose 147.8 and the script changes.

Xau/Usd - Pullback Buy Opportunity to 4040Price has recently shown strong bullish momentum with a Break of Structure (BOS) confirming upside intent. A weak high has been formed around the 4032 level, suggesting liquidity may still be present above.
We're anticipating a pullback into the marked Demand Zone, where price previously consolidated before the breakout. This zone is key for potential bullish continuation.
Trading Plan:
Wait for price to return to the Demand Zone.
Look for a bullish rejection candle (e.g., pin bar, engulfing) within the zone.
Enter long on confirmation, targeting the next liquidity level at 4040.
Risk Management:
Place stops just below the demand zone structure.
Consider partials around recent highs if necessary.
This setup aligns with intraday momentum and structure, offering a high-probability trade if conditions are met.
