Alexandria Real Estate (Revised) | ARE | Long at $45.00**This is a revised analysis from January 13, 2025:
I am still in that position ($97.41) but adding heavily now that the price has entered my selected "crash" simple moving average zone.
Technical Analysis
The trading price of Alexandria Real Estate NYSE:ARE has now reentered the "crash" simple moving average zone. The price first entered this zone back in October 2023. This rare, long-term double entry into this zone is often a (at least short-term) bottom indicator. But I remain heavily cautious here given the financials of this company. My reentry is an exit plan since this is a company I do not wish to hold longer than I have to.
Pros:
Fair value: $103.00
Intrinsic Value: $96.00
Forward P/E: 31x (current P/E in the negative)
Annual Dividend: 6.37% (Quarterly dividend just cut by 45%, so hopefully bad news is done for now...)
Debt-to-Equity: .8x (not bad)
Cons:
Bankruptcy risk is high: Altman's Z Score = .7
Inability to pay recent bills is high: Quick ratio = 3.5
REIT sector is in rough shape
More dividend cuts?
Action:
I originally underestimated the downfall of the REIT sector. This company's financials are questionable. From a technical analysis perspective, a short-term bottom may be in. However, there is more room to fall and the next support zone is down in the $30's. My hope is that the shift in interest rates will push more investors into dividend / value plays. While most investors would cut their losses and be out here, I'm not. Personally, *as long as NYSE:ARE doesn't keep cutting its dividend and the fundamentals do not get worse,* I am cost averaging down to hopefully escape soon. There are much better investments out there than NYSE:ARE , but patience often pays - or allows you to break even. I'll be the contrarian.
Targets into 2028:
$53.00 (+17.8%)
$69.00 (+53.3%)
Dividends

Long Term Investment cum Trading Idea : MOILMOIL Tgt: 411 / 471 /531/571 🤞🏻🤞🏻🤞🏻
Purely long-term investment may add on dips of 340-315 or hold calmly.
Will Review at price range of 471-491 for further move
For investors with a long-term perspective and the ability to add on dips or hold calmly.
Time Frame: Minimum 8 months 🤞🏻
Trade as per your risk management and investment plan.
#AtmanirbharInvesting

Dassault Aviation Société AnonymeFor my last idea of the year I have chosen to write one about Dassault Aviation. I really find aerospace and defense companies to be the most interesting to me in all of the stock market. As a matter of fact the majority of my holdings are invested into aerospace and defense companies. Aeronautics has always been an extremely competitive industry, ever since the first airplanes, engineers constantly strive to make the technology better, faster, safer and more cost effective.
I chose Dassault because I think the Rafale fighter program has a competitive advantage over the rest of the competition for the moment. There was also some issues, I remember around March of 2025 I saw on the news about how some nations were concerned with the credibility of the US and some nations even cancelled or suspended contracts with Lockheed Martin to delay F-35 purchases. I don't want to talk about that too much because I don't really know what is going on with that topic of discussion to tell you the truth. I do know nations take their national security very seriously though and aerospace and defense is no exception.
Like most aerospace and defense companies right now it is difficult to see very much upside intrinsically speaking. The sector has had some really nice attention and momentum this year, I don't see why it wouldn't continue into 2026 and beyond. I think its important to realize I am not really speculating about the topic though. I am not trying to say "buy it because I think it will go up". I think good ideas are just as important in the stock market as risk management itself and if you ask me I don't think its worth risking very much on Dassault right now.
Primary capital allocation is designated to research and development, industrial infrastructure and supply chain management. These are important elements when we look at the price of Dassault on a chart because the capital expenditures are primarily why certain price actions occur in real time. For example, if the company needs money to finance something new, the price of the shares might drop temporarily as money is being spent, alternatively if they get a new contract and its a big deal, they expect to make a lot of money from it the share price might go up. This is why I love these industrial companies, because we all know the products the company is providing is going to need a lot of maintenance over the years.
The company actively partakes in employee share programs, Dassault has allocated hundreds of millions of Euros toward employee incentives and profit-sharing in the current fiscal cycle. The company also likes to reward shareholders by engaging in share buy back programs from time to time. There is also a slight dividend that the company pays out as well if that is something you receive then you will know it helps out the portfolio a little bit.
The company has a pretty large cash position valued at about €10 billion at the end of 2025. This is primarily from advanced payments received by nations for major Rafale export contracts. Currently there is a record breaking order backlog on aircraft orders going into 2026, there is about €48 billion in backlog value. Don't quote me on this though because that was the value about 6 months ago so today it could be a little more or less, the value doesn't really matter to us as retail investors but I am just saying it for context. The company plans to take care of this backlog in a timely manner though, they plan to invest in more industrial capacity.
Recently the company celebrated production of its 300th Rafale fighter jet, and announced plans to increase production rates to four aircraft per month in the coming years to ensure deliveries stretch reliably into the 2030s. I think the stock would make a fine addition to any properly diversified portfolio as long as you understand the potential risks associated. Its a pretty interesting company I think there's definitely some great information on the internet and I am happy that I got to write this idea and share some information today.
Merry Christmas and thanks for putting up with me. Hope you enjoyed the idea.

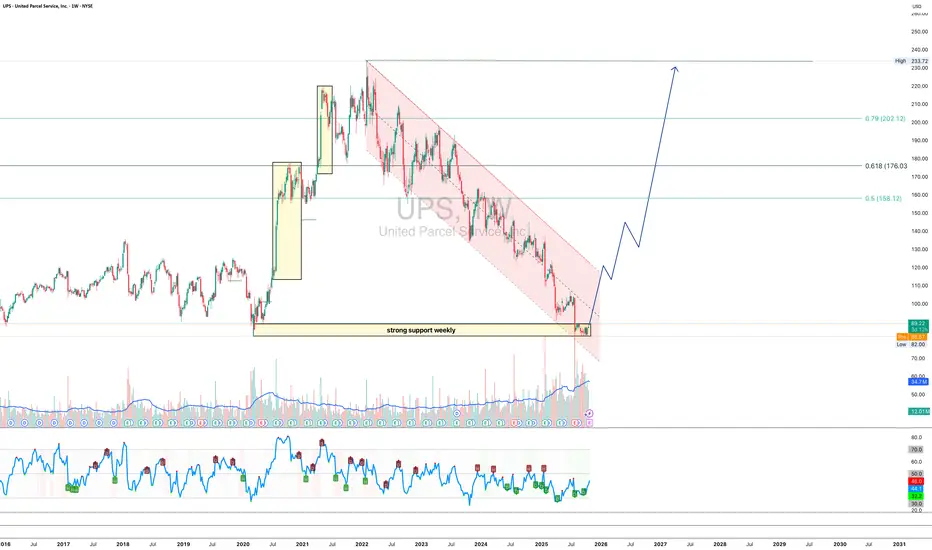
UPS 1W - delivery of a trend reversal is on the way?On the weekly chart, UPS is holding strong around the $82–90 support zone - a key level where buyers historically step in. The structure suggests the end of the long corrective channel and the potential start of a bullish reversal.
Technically, a confirmed breakout above the channel could trigger momentum toward $158, $176, and $202 - attractive targets for mid-term traders.
From a fundamental standpoint, UPS continues to streamline operations, improve automation, and prepare for peak season shipping. Growing e-commerce volumes and steady fuel costs may support stronger margins ahead. If earnings start to reflect these improvements, the stock could easily shift gears into a sustainable uptrend.
* UPS announced that it will report its Q3 results on October 28, 2025.
* The company is introducing increased seasonal charges and shipping rates starting October 26 ahead of the holiday season, which may temporarily reduce demand.
* UPS also announced plans to equip 5,000 of its trucks with air conditioning in the hottest regions of the US, a step to improve working conditions but at a cost.
* The high dividend yield (~7.5%) raises questions about sustainability, as the payout is almost equal to free cash flow.
Tactical play: as long as $82–90 holds, bulls have the initiative. Once the breakout is confirmed - the next big delivery might just be profits.
Why is $PG Procter & Gamble NOT good for Dividends nowFor dividends, companies need to have a relatively stable chart, or even some ups/downs are even better, but do NOT gamble (pun intended) on price.
P&G specifically MAY have reached the bottom of the fall, and get a short-term uptrend, but after that double-top and being within a descending channel, my feeling is that the downtrend will continue.
I would NOT get this risk for a little 3% dividend.
WHY?
I use dividends as an accelerator towards Financial Freedom.
FOLLOW me and check my profile if you want Templates and Reports to:
know the exact breakdown of your income to dedicate to Savings, Investments, Basic needs, etc.
Deep research of the best companies providing Dividends, 5-year Yields, with analytics and rationale.

XAUUSD | Gold Signal |Dec 8,2025📌 MARKET ASSESSMENT
1. General Context
Gold continues to fluctuate within the medium-term range on the H1 chart with a slight downward correction structure. The price is currently moving between the upper supply zone and the lower support trendline, indicating that the market is waiting for more momentum to break out.
2. Current Trend
The H1 chart maintains an overall uptrend but is in a correction phase.
The supply and demand zones are clearly formed, creating conditions for trading according to the technical reaction zone.
The uptrend trendline plays an important support role and has not been penetrated yet.
3. Important Observation Zone
H1 Supply Zone (Sell Zone): 4225 – 4230
The position of confluence with the recent peak.
If the price approaches and is rejected, it is likely to fall back to the support zones.
Support Zone/Entry Buy: 4167 – 4175
Confluence between the uptrend line + H1 bottom + demand zone.
This is the zone with a high probability of forming a bullish reaction.
4. Trading Scenario
Scenario 1 – Sell at Supply Zone
Entry: 4225 – 4230
SL: Above 4235
TP:
Target 1: 4200
Target 2: H1 Trendline
Scenario 2 – Buy at Support Zone
Entry: 4167 – 4175
SL: Below 4160
TP:
Target 1: 4198 – 4205
Target 2: 4220
5. Conclusion
Gold is approaching important technical zones and is suitable for trading on price reaction instead of chasing the market. Both scenarios are highly plausible given the H1 structure remains intact. Prioritize waiting for the price to touch the supply and support zones to avoid the risk of fluctuations between zones.

XAUUSD | Gold Signal |Dec 4,2025📌 MARKET ASSESSMENT
As of Thursday, December 4, spot gold is trading at $4,202 per ounce, up roughly $10 on the day.
ADP data showed that the U.S. private sector lost 32,000 jobs in November, sharply missing expectations for a gain of 10,000 and marking the steepest drop since March 2023. Win Thin (Nassau 1982) noted that the ADP index has been weakening consistently, reflecting a sustained cooling trend in the labor market. Nela Richardson from ADP added that the slowdown is broad-based across all business groups, especially among small and medium-sized enterprises — a sign that consumers are becoming more cautious amid ongoing macroeconomic uncertainty.
While gold jumped in response to the data, silver — which briefly touched $58.97 per ounce early yesterday — fell sharply back to $57.83, triggering short-term corrections across the entire precious metals complex.
Since gold is a non-yielding asset, expectations of monetary easing remain its core support. However, the combination of soft economic data, silver’s volatility, and profit-taking suggests that gold’s path upward will remain uneven.
Macro forces — weakening labor indicators, a softer U.S. dollar, and political uncertainty surrounding the Fed Chair position — continue to tilt in gold’s favor. But until the metal can firmly break above $4,400 per ounce with strong liquidity, any upside acceleration remains only potential rather than confirmed. This is for reference only.

XAUUSD | Gold Signal |Dec 2,2025Gold has pulled back to $4,210/oz today as the market sees some profit-taking after yesterday’s strong rally to a six-week high. Despite the dip, overall sentiment remains firmly supported by expectations of a Federal Reserve rate cut next week.
📌 Key Drivers Behind Today’s Move
1️⃣ Profit-Taking After a Sharp Rally
Gold surged on Monday, and today’s decline reflects natural profit-taking rather than a shift in trend.
Momentum remains intact as long as expectations for a rate cut stay elevated.
2️⃣ Rate-Cut Expectations Strengthen Further
Markets now price in an 88% probability of a 25bps cut at the upcoming Fed meeting.
This confidence is driven by:
• Weak US economic data
• Dovish comments from multiple Fed officials
3️⃣ Manufacturing Weakness Adds Pressure on the Fed
Monday’s data showed US manufacturing contracted for the 9th straight month, signaling persistent economic softness.
This reinforces the case for easing and remains supportive for gold.
📊 What Investors Are Watching Next
• Jerome Powell’s speech today
His ton, hawkish or dovish could influence short-term volatility in gold.
• ADP Employment Data (later this week)
A weaker print would strengthen expectations for a rate cut.
• Delayed September PCE Report
As the Fed’s preferred inflation gauge, this data will be critical for confirming the policy path.

HAUTO: TP NOK 141,- Generous dividends (+25%) [Pink: HOEGF]Some say Car-carrier (PCTC ) trade macro is challenging in, others claim this comes to pass late '26 or '27. All the while generous dividends are an insurance. Short term movements may meet resistance, must hold +100-ish, looking to medio jan 2025 for more upside.
Conensus TP : NOK 141

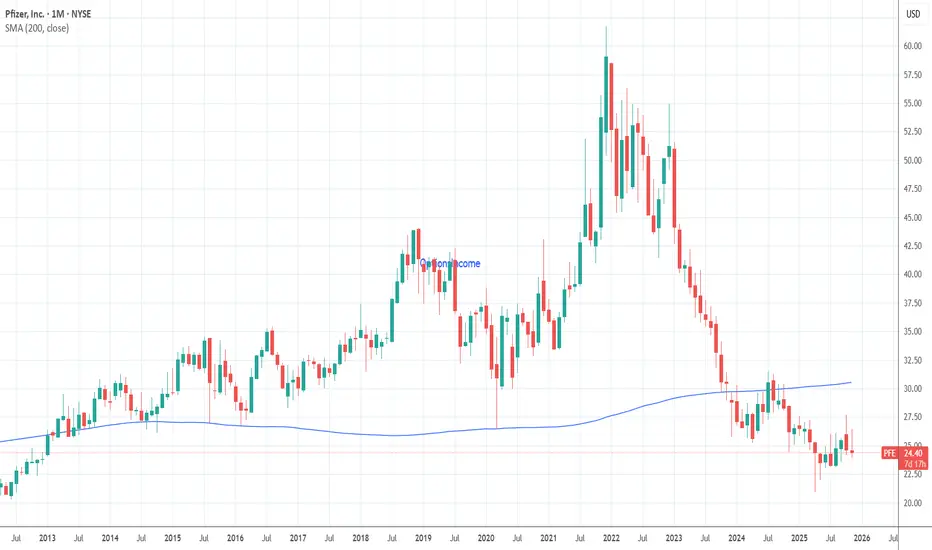
Pfizer (PFE) – Hedged Covered Call Income CampaignAfter Pfizer’s return to price levels closer to its pre-COVID range, I personally believe the stock is undervalued relative to its current earnings profile and long-term potential. This view is also influenced by Pfizer’s recent acquisition of Metsera, which brings a pipeline of obesity and cardiometabolic candidates — including GLP-1 receptor agonists, an amylin analog, and other metabolic therapies.
Whether this pipeline ultimately succeeds is uncertain, but in my opinion, it meaningfully strengthens Pfizer’s long-term outlook.
This campaign is structured as a hedged, conservative covered-call income strategy, combining downside protection with steady premium generation.
Current Position
1. Long Shares: 700 shares @ $24.94
2. Protective Long Puts: 7 puts @ $19 strike (exp. 1/16/26), Cost: $35 total
Because PFE’s implied volatility is relatively low, these long-dated puts provide very inexpensive downside protection, defining maximum risk and allowing me to run covered calls with confidence. This is my preferred way to reduce tail risk on slower-moving stocks.
Covered Calls (Income)
I am selling near-term calls at the $25 strike and rolling as needed.
Call Activity So Far:
A. Initial Sell
• 7 contracts @ $0.11 → $77 total
• Expiration: 11/07/2025
B. Roll #1
• 7 contracts @ $0.15 → $105 total
• Expiration: 11/11/2025
C. Roll #2
• 7 contracts @ $0.15 → $105 total
• Expiration: 11/17/2025
Dividend Component:
Pfizer’s dividend provides a third income source that complements the weekly call premiums. With 700 shares, my next scheduled dividend payment is $310.89 on December 1st. this is nearly a 7% yield.
Dividends enhance this strategy by:
1. Reducing effective cost basis over time
2. Providing a reliable quarterly income
3. Making slower-moving stocks like PFE well-suited for hedged income trading
4. Smoothing returns even during flat price periods
This is one reason I favor PFE for long-term defensive income strategies.
These rolls follow my usual “roll out only” approach — extending time value without paying unnecessary extrinsic premium. This keeps weekly income stable while managing assignment risk.

I Think GE Aerospace is BrilliantThis is one of my favorite companies on the market. I really have a deep fascination for aviation and all things, planes. Naturally it makes sense for me to have exposure to the sector. I do not have many companies in my portfolio but I'm going to share my reasons for why I have been buying GE stock over the last few months.
The value of the shares are, in my opinion overvalued right now at this price. I am going to explain why I still think this is a good investment despite the numbers coming back negative. The intrinsic value of the stock as per my model is $250. Indicating a significant overvaluation, I think my reasons for not selling and possibly buying more are sufficient fundamentally to still hold the stock in my portfolio.
The primary reasons I like this company above all the others is because of how they are using capital in their business;
GE Aerospace invests heavily in developing future technology, including advancements in Open Fan engines, hybrid electric propulsion, and hyper sonics. The company is investing in its supply chain, facilities, and suppliers to meet rising demand and improve production and service capacity. Capital is used to help customers update and expand their fleets, supporting the demand for GE Aerospace's products and services.
The company plans to return approximately 70–75% of available funds to shareholders through dividends and share buybacks, a significant increase from previous levels. This capital return strategy is intended to generate incremental value for shareholders, in addition to the company's expected growth.
A significant portion of capital is dedicated to increasing its global capacity for servicing engines to meet growing demand and support its engine platforms for decades. After the spin-off of GE Vernova, GE Aerospace retained a strong cash position that was used to fund the new company. As part of its launch as a standalone public company, GE Aerospace awarded one-time equity awards to employees to make them owners of the business.
That is all the reasons why I think this company is a good investment, fundamentally.

Reasons why Coca-Cola is a Great CompanyI'm going to do a deep dive into why I think Coca Cola is a great stock to buy and hold, or trade whatever really you want to do with it is up to you. I hope you enjoy my idea, I always start off my ideas discussing the intrinsic value of the stock in question as that is a very fundamentally important aspect of buying stocks! I prefer the dividend discount model because it assumes a 28% upside! However I did account for the discounted cash flow as well which represents an upside of 12% which I think is more reasonable to expect this year. Overall I would like to think this company will be worth at least $77 sometime this year or next.
Coca Cola has made significant capital investments in their business over the last few years. These investments support growth by funding projects like expanding its bottling operations and placing more cold-drink equipment in outlets worldwide to drive sales. Historically, Coca-Cola has acquired other beverage companies to diversify its portfolio, although it also focuses on inorganic growth through other opportunities. In 2024, the company made progress toward refranchising some of its company-owned bottling operations to shift towards a more asset-light model.
The company has a great track record of returning capital to its shareholders. Coca-Cola has a long history of paying and growing dividends, having increased its dividend for 62 consecutive years. In 2024, it paid out $8.4 billion in dividends. The company repurchases its own shares to return capital to shareholders, with net share repurchases of $1.1 billion in 2024.
Coca-Cola manages a mix of debt and equity to finance its operations, with debt representing approximately 37.5% and cash and equivalents making up about 15.0% of its total capital in a recent analysis. This balanced approach is used to support growth while managing financial risk and optimizing overall performance. Coca-Cola focuses on producing and marketing high-margin beverage concentrates, while largely outsourcing the capital-intensive bottling and distribution processes to partners. This efficient model helps maintain high profit margins and financial resilience.
In essence, Coca-Cola acts as an anchor in a diversified portfolio, providing stability and downside protection when other growth-oriented investments may be struggling.

Writing about Canadian National RailwaySome one asked me to write why I like CNI, also I don't like the other idea I wrote about the company, I felt like I could do a lot better. I am in the mood to write tonight and feel like this is a great time for me to explain why I like CNI. First and foremost, I like undervalued companies on a technical and fundamental level CNI is significantly undervalued at the time of this writing. As you can see by the technical analysis we are sitting at an area of support characterized by the trendline, and to reinforce the technical analysis I have measured a move using the Fibonacci retracement tool.
Talking about the fundamentals, I have calculated both the discounted cash flow, and the dividend discount models of intrinsic value. According to my calculations the price of the stock right now at $93 is undervalued based on the future revenues the company will be expected to generate. The dividend discount model also suggests undervaluation based on the expected dividend payments over the next 5 years. I always calculate a minimum of 5 years into the future. According to my calculations it is reasonable to assume the intrinsic value for CNI to be somewhere near the $115 mark. This leaves me a substantial margin of safety to buy shares at these levels.
Some more reasons I like the company goes beyond the actual price of the stock. One reason I like the company is because it is a very capital intensive business model with a wide economic moat. The massive investment for building tracks, bridges and tunnels creates an almost impossible barrier for new competitors to overcome. These high costs mean there are very few major railroads, often leaving each with a monopoly or duopoly in certain regions, which gives them pricing power.
When I was building my portfolio at first, I didn't really care about the environmental impact companies had on our planet, but eventually as I learned more it started to become important to me to invest in companies I think were good for the planet. Railroads are significantly more fuel-efficient than trucking, especially when hauling heavy goods long distances. This efficiency leads to lower greenhouse gas emissions, which benefits society as a whole.
The company is the largest rail network in Canada and the only North American railway connecting the Atlantic, Pacific, and Gulf Coasts, giving it a dominant position on the continent. Finally, Canadian National has consistently increased its dividend for 20 consecutive years and currently yields nearly 2.7%. Its relatively low payout ratio of 48% suggests its track record of payout increases will likely continue. I think CNI is a great company and I have been using the stock as a defensive/safe haven type of position in my portfolio.

EduFi: The Next Big Web3 Vertical? Why LGCT Is Betting on ItIn the rapidly evolving Web3 landscape of October 2025, EduFi—blockchain-powered education finance—is emerging as the next major vertical, blending decentralized finance (DeFi) with accessible learning opportunities. With the global education market valued at $6 trillion and student debt exceeding $1.7 trillion in the US alone, EduFi promises to disrupt traditional systems by offering tokenized credentials, micro-credentials, and AI-driven personalized learning. Legacy Token (LGCT), the utility token of the Legacy Network ecosystem, is positioning itself at the forefront, integrating gamified education with blockchain rewards to empower 500,000+ users worldwide. This article explores EduFi's potential, LGCT's role, market drivers, and trading insights. Data as of October 9, 2025—position for EduFi's ascent.
The Rise of EduFi: Democratizing Education Through Web3
EduFi leverages blockchain to address key pain points in education: high costs, credential verification, and access barriers. By tokenizing diplomas, courses, and funding, it enables peer-to-peer lending, fractional ownership of educational assets, and earn-while-learn models. Platforms like EduFi.tech and Open Campus are pioneering this, with EduFi.tech offering Shariah-compliant financing for Omani students and Open Campus launching EDU Chain on Arbitrum Orbit for consumer-facing EduFi apps.
LGCT, the multi-chain utility token of Legacy Network, powers a gamified education app with over 500,000 downloads in its first three months. Users earn LGCT for completing modules, lessons, and mini-games, converting them to cash or using for premium content. Priced at $1.93 with a $193.88M market cap, LGCT is listed on exchanges like Gate.io and KuCoin, emphasizing "market-resistant utility" through buyback-and-burn mechanisms and MiCA compliance. The token's fixed 300M supply and vesting schedules ensure scarcity, while its integration with Ethereum, BSC, VeChain, and Polygon supports cross-chain flexibility.
Why fresh? EduFi aligns with Web3's user-owned data ethos, solving a $1.7T student debt crisis. In 2025, 30% of global education spending could shift to blockchain, per Deloitte, with AI-Web3 convergence creating autonomous DAOs for learning. Legacy Network's app, with 1,400+ lessons, rewards users for milestones, fostering engagement. On-chain metrics show LGCT volume doubling despite market dips, up 70% in bear phases, signaling strong 2025 prospects.
LGCT's Bet: Gamification and Real-World Utility in EduFi
Legacy Network's LGCT token is betting big on EduFi by gamifying learning, where users earn tokens for educational achievements, redeemable for real-world value. The app focuses on personal growth, with over 500,000 downloads globally, becoming a go-to self-improvement tool. LGCT's multi-chain design (Ethereum, BSC, VeChain, Polygon) enables seamless payments for subscriptions and in-app purchases, with a portion of revenue used for buybacks and burns to drive scarcity.
Key facts: LGCT's 24-hour trading volume hit $7.83M, with a fully diluted valuation of $547.99M. The token's market-resistant design ties demand to education use cases, not speculation, with 16.8% APY staking rewards. In Q3 2025, LGCT's volume doubled, rising 70% during downturns, indicating resilience. The ecosystem's AI-driven personalization tailors lessons to goals, integrating Web3 for credential verification and funding.
EduFi's appeal: It solves access issues, with 65% projected growth in blockchain education by 2026. Legacy Network's MVP, hackathons, and university courses have empowered 2M+ users, positioning LGCT as a bridge between learning and earning.
Market Implications: EduFi's $100B Potential
EduFi could capture 10% of the $6T education market, or $600B, with Web3's $153B TVL providing liquidity. LGCT's listing on Bitpanda and Gate.io boosts visibility, with AI-Agent layer in Whitepaper 2.0 enabling autonomous DAOs for education. Sentiment is 71% bullish, correlating 0.7 with ETH, as 40% of hedge funds eye AI-Web3 convergence.
Risks: Regulatory hurdles (MiCA compliance) and scalability (bridge exploits, 5–7% dips). Forecasts: LGCT at $5–$10 by end-2025, driven by 900M Telegram users and EduFi adoption.
Trading Signals: RSI and MACD
Based on April 2025 uptrends:
LGCT ($1.93): RSI at 58 (bullish). Bullish MACD (+0.12)—target $2.50 (30% upside). Fibonacci support at $1.70, resistance at $2.10. On-chain: volume +70%.
ETH ($4,500): RSI at 58. Bullish MACD (+0.12)—target $5,200 (15% upside). Fibonacci support at $4,200, resistance at $4,760.
Overall: RSI 58 signals momentum—long at supports for 15–30% Q4 gains. Risks: regulatory news (5–7% dip); hedge with USDC.
How to Profit from EduFi's Rise
AI Alerts: Monitor RSI >60 for entries (e.g., LGCT at $1.70), targeting 10–15% yields on ecosystem updates.
On-Chain Tracking: Watch TVL ($5B) and whale activity (+15%) for rally signals.
Portfolio Strategy: Allocate 20–30% to LGCT, hedge with USDC at RSI >70 for 15% Q4 returns.
Education: Study gamified learning mechanics and practice via demo platforms.
Conclusion: EduFi's Web3 Takeover
EduFi is the next big Web3 vertical, solving $1.7T debt with tokenized learning and LGCT's gamified ecosystem. With 65% growth projected and LGCT's resilience (70% rise in downturns), traders can target $9.89 long-term. RSI 58 and bullish MACD signal 15–30% Q4 gains—position for EduFi's $100B potential.
What's your EduFi play? Comment below!
#EduFi #Web3Education #LGCT #TON #CryptoTrends

Deere and Company is a stapleIt looks like a good time to buy Deere shares, I have done an evaluation on the perceived intrinsic value of the company. To back up my philosophy about what I think a "good deal" on the shares is, I have included a technical analysis including a trendline being touched for the third time at a measured Fibonacci retracement.
Looking ahead five years, based on the revenues the company is expected to generate according to wall streets current estimates. I have used the discount cash flow model to determine what I believe a suitable margin of safety would be to buy and hold shares of Deere. I am taking into account, the time value of the investment by measuring 5 years ahead, the risk to me at this point is very low. $570 seems to be a fair price taking into account all the fundamentals, I have been holding the stock for some time, but am increasing my exposure to 5% allocation in my portfolio.
Naturally I like the stock because I have worked around these machines a lot in my life. So I have a good understanding of how the company will make money and why the company will make money. The current price of a share is $461, while the intrinsic value according to my model is $570, essentially that means the shares are about %25 undervalued right now. I would personally rate Deere a buy despite the short term headwinds the company faces, we need them.

Kenvue Tylenol Turmoil: Does the 33% Drop Scream Undervalued?While many stocks (especially tech) are near all-time highs and have high PE ratios, I'm still hunting for bargains, and Kenvue seems to be relatively cheap. More recently, it came under fire because of Trump's remarks on Tylenol, and the stock lost over 10% in a few days.
Since May 2025, the stock has lost 33%, putting it, in my opinion, in an undervalued zone.
Kenvue is the manufacturer of a bunch of health-related products, including Tylenol, Neutrogena, Band-Aid, Listerine, Benadryl, Zyrtec, Motrin, Aveeno, Johnson's, Rogaine, and many more.
I like this kind of health-related beaten-down stocks because they exhibit good uncorrelation with the rest of the stock market, and in bear markets, they tend to hold up well because people always need to buy healthcare products.
WHY BUY KENVUE STOCK?
The stock has a strong moat, with excellent market penetration, top-of-mind brand recognition, and consumer loyalty, as well as economies of scale, worldwide.
They have great management, with Kirk Perry and Andy Dasgupta leading the company. This guy has a great track record in the consumer product sector.
Despite the decent performance, the stock price is now at an all-time low.
KEY NUMBERS AND FUNDAMENTALS
Where should I start... Since they spun off from Johnson & Johnson, the stock is now the cheapest when compared to their revenue, income, and other metrics.
Diluted EPS is now at $0.22. The same level as in 2023, when the stock was at $24. The difference is that the stock is now at $16 (33% cheaper).
The dividend ratio is now at 5%, the best level ever. The last time it was this close to the current level was in mid-2024, when the dividend yield reached 4.6%. After that, the stock rose by 38% in less than 6 months. If you like dividends, you should definitly take a look at Kenvue.
The PE ratio is 22, which is low compared to the sector and the company's historical data.
Similar story for the PB ratio, which is now at an all-time low.
This data is telling us that the stock is comparatively cheap. Of course, one needs to ask: Is it cheap because of poor prospects for the company, or because the market is overly fearful? I'd lean for the second.
It's also worth adding that their gross margin is 58%, the EBITDA margin is 24% (quite good), and the forward PE is at around 15.
Finally, the analyst's price targets average $22, giving it an upside of around 34%.
MY GAMEPLAN
I'm going to allocate close to 1% of my net worth to this stock. In case the price drops, I will average down my purchasing price, considering that this company is likely to continue having a very strong moat for the coming years.
I plan to hold it for the medium/long term, potentially selling part or the entirety of my holdings once I get over 30% return. I will re-evaluate it later this year.
Quick note: I'm just sharing my journey - not financial advice! 😊

2270 To buy1. Key Levels
Support: 250 SAR (a break below may push toward 230 SAR).
Resistance 1: 270 – 280 SAR.
Resistance 2 (major): 300 SAR (POC + psychological level).
2. Dividend Impact (9 SAR)
Strong dividend makes the stock attractive for long-term investors.
Provides a yield cushion, supporting the 250–270 SAR zone as a potential accumulation area.
Enhances fundamental value if earnings remain stable.
For long-term investors, this zone is attractive.
For traders, the stock needs to clear 270–280 SAR to confirm momentum toward 300 SAR.

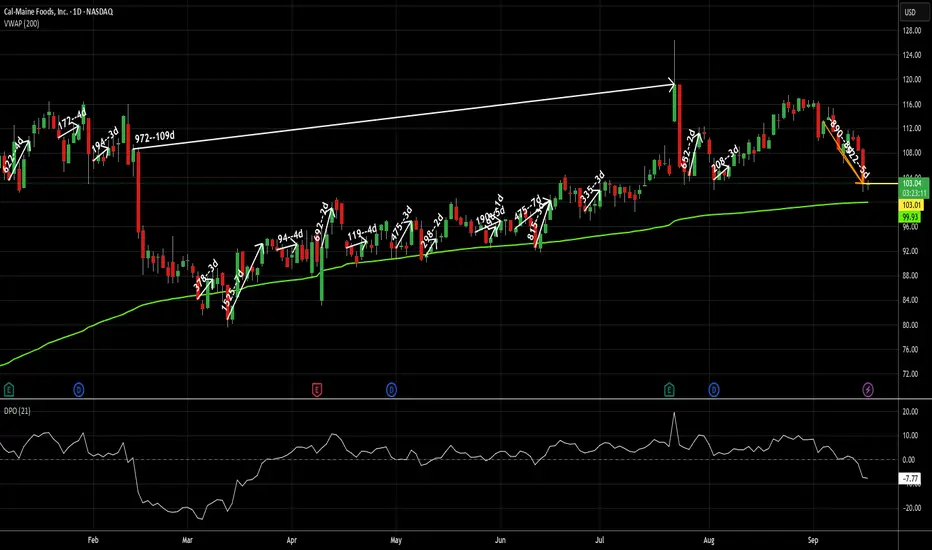
Oxymoronically pounding the table here for CALMThere are a lot of reasons I like the trade I entered into yesterday at the close here. I'll start with some reasons I'd like CALM regardless of my trading style.
I think everyone can agree we are in an overvalued market right now. That inherently creates risk with any stock you buy right now. Not saying we are gonna go down, but the more overvalued the market gets, the greater the risk that creates. CALM has several things going for it in that regard.
1--it has a TTM P/E of 4.12. Not 41.2 - FOUR!!! This is good even for a value stock.
2--their current yield is 8.11%. Give your head a second to wrap itself around that one - this stock has a yield that is twice its P/E. To put that in perspective, NVDA has a P/E of 50. If its yield were 2x its P/E, it would be paying a 100% dividend. This is not really an anomaly, either. It has always been a high dividend stock.
3--in the event inflation picks up again, foods are an area where costs can be passed through to customers better than in other areas. Eggs will still be eaten, even if they cost more. We've already proven that once. People will complain, but they still buy them.
Now for the part that really intrigued me here. 18-2 on trade signals in 2025 with an average gain of 3.5% and an average holding period of 9 days (including that 109 day marathon). That includes the two losing trades recently, and works out to a gain of .39% per day held. Note: trade returns on the chart are basis points (.01% per bp)
Those are beyond tech stock level daily returns on a stock that has been flat overall on the year, that sells something Americans bought 108 BILLION of last year (while griping about prices) that has a low P/E and if the trade goes sideways, pays me 2% a quarter to hold onto. That's .03% per day just to hold it, not including any gain on the trade itself. The average historical daily gain of SPY is around .04%, for comparison.
Why is this stock not being talked about? I don't know and I don't care, but I went long at yesterday's close at 103.01 and it's trading just below that as I put the finishing touches on this post.
As always - this is intended as "edutainment" and my perspective on what I am or would be doing, not a recommendation for you to buy or sell. Act accordingly and invest at your own risk. DYOR and only make investments that make good financial sense for you in your current situation.
Constellation Brands | STZ | Long at $134.50Constellation Brands NYSE:STZ
Technical Analysis:
Currently trading just below my "crash" simple moving average area. This area is often a bottom, even if temporary (sometimes there is a continuous stairstep down, though). There is a high probability the stock could drop down to the "major crash" zone ($120 and below) in the near-term, but all price gaps on the daily chart since 2020 that were open below the current price are now closed (bullish).
Earnings and Revenue Growth
Projected earnings increase from 2025 ($11.6 billion) to 2028 ($15.4 billion): +38.2%
Projected revenue increased from 2025 ($9.1 billion) to 2028 ($9.8 billion): +8.3%
www.tradingview.com
Health
Debt-to-Equity: 1.6x (high)
Altman's Z-Score/Bankruptcy Risk: 3.1 (excellent/very low risk)
Insiders
Warning: Selling outweighs buying.
openinsider.com
Action
Constellation Brands hold a number of major names in the alcohol industry. While sales have slumped and revenue growth is weak, it's a solid company paying a +3% dividend. I do not expect this to skyrocket any time soon, so those into overnight returns may want to pass. The decision to enter is primarily based on technical analysis and name-brand recognition. I am also going to keep my target low for a swing trade due to the unknown economic times ahead.
Targets in 2028
$158.00 (+17.5%)
$178.00 (+32.3%)

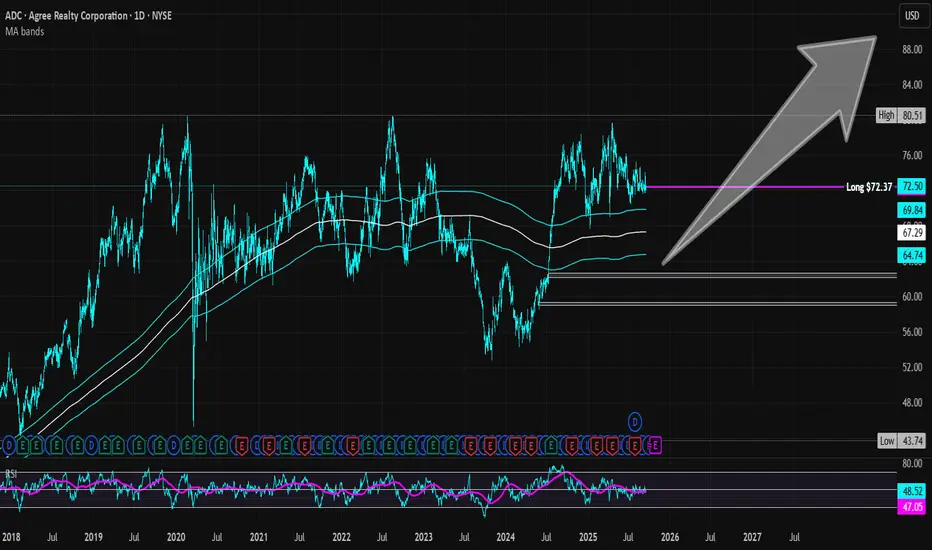
Agree Realty | ADC | Long at $72.37Agree Realty NYSE:ADC
Summary: A "boring" REIT with a 4.2% dividend, ~68% investment-grade tenants, high occupancy (~99%), average lease terms of 10+ years, which include major tenants Walmart (top tenant), Dollar General, Tractor Supply, Best Buy, Dollar Tree, TJ Maxx, O'Reilly Auto Parts, CVS, Kroger, Lowe's, Hobby Lobby, Burlington, Sherwin-Williams, Sunbelt Rentals, Wawa, Home Depot....
Technical Analysis: Cup and handle formation may be forming off the recent double bottom (bullish). Two open price gaps remain on the daily chart since 2020 (down near $59) - chance these may get closed if the market turns in the near-term. However, REITs average +30% returns within 16 months post-Fed rate cuts, so patience may benefit investors here.
Follow the Money : Insiders buying .
Company Financial Health: Strong. $2.3B liquidity, no material debt maturities until 2028, and investment-grade balance sheet (A- rating from Fitch). Debt-to-assets ~40%, covered by stable net-lease rents. Macro risks (e.g., tenant bankruptcies like At Home, consumer slowdown) exist but are mitigated by diversification. Altman Z-Score suggests low distress and no near-term catalysts for insolvency.
Earnings and Revenue Growth: ~4% between 2025 and 2027 (slow growth, but good/steady for a REIT).
Thus, at $72.37, NYSE:ADC is in a personal buy zone for a likely move up given the high probability of lower interest rates in the future. A near-term risk of a drop to $59 could occur, but REITs often move higher within 1-2 years after interest rates cuts. It's a solid company financially with a good dividend.
Targets into 2028:
$80.00 (+10.5%)
$90.00 (+24.3%)
Flowers Food | FLO | Long at $13.51Flowers Food NYSE:FLO . Maker of Nature’s Own (the top-selling bread brand in the US), Wonder Bread, Tastykake, and many others, has entered my "crash" simple moving average zone. While the fall has been steep since 2022, the company is trading at a price-to-earnings of 13x (typical food industry is around 20x) and offers and 7%+ dividend. It's not a play for future growth, however, which is expected to be mild to stagnant ( based on forward annual earnings and revenue . This position is a value / dividend play given the high likelihood of lower interest rates and a certain group of investors moving out of banks and into dividend / income stocks.
So, while I wouldn't be shocked if NYSE:FLO dips into the $12 rage in the near-term, I have created a starter position in the company at $13.51. My targets are modest, although there is a blaring gap in the $27-$28 range that will likely be filled... some time.
Targets into 2028:
$14.75 (+9.2%)
$16.25 (+20.3%)

Long TLT/SPY📌 Bonds Explained: What They Are, How They Work & Key Risks
Bonds are one of the oldest and most important financial instruments in global markets. They are used by governments, corporations, and institutions to raise money, and by investors to earn income, diversify portfolios, and manage risk.
At their core, a bond is a loan:
The issuer (borrower) raises capital by selling bonds.
The investor (lender) provides money in exchange for periodic interest payments (coupon payments) and the return of the principal (face value) at maturity.
🔹 1. What is a Bond?
When you buy a bond, you are lending money to the issuer. The issuer promises:
Interest payments (usually fixed) on a regular schedule (semiannual or annual).
Repayment of principal (the original investment amount) when the bond matures.
📌 Example:
You invest $1,000,000 in a 10-year bond paying 3% annually (semiannual coupons).
Every 6 months, you receive $15,000 in interest payments.
At the end of 10 years, you (hopefully) receive back your original $1,000,000 principal.
🔹 2. Why Do Companies and Governments Issue Bonds?
Governments → Fund infrastructure, social programs, defense, or refinance existing debt.
Corporations → Finance expansion, research, acquisitions, or refinance loans.
Municipalities → Build schools, hospitals, and roads.
Bonds allow issuers to access large pools of capital without giving up ownership (like stocks).
🔹 3. Why Do Investors Buy Bonds?
Stable Income: Regular coupon payments.
Capital Preservation: Return of principal at maturity (assuming no default).
Diversification: Bonds often behave differently from stocks, balancing risk.
Hedging Inflation/Interest Rates: Certain bonds (like TIPS) protect against inflation.
Relative Safety: High-quality government bonds are considered safe-haven assets.
🔹 4. Key Types of Bonds
Government Bonds
Issued by sovereign states.
Example: U.S. Treasuries, UK Gilts, German Bunds.
Generally low risk, lower yields.
Corporate Bonds
Issued by companies.
Higher yields than government bonds but higher risk.
Municipal Bonds
Issued by local governments or agencies.
Often come with tax benefits for investors.
High-Yield (Junk) Bonds
Issued by lower-credit issuers.
Higher potential returns, but much riskier.
Inflation-Protected Bonds
Coupon/principal linked to inflation.
Example: U.S. TIPS (Treasury Inflation-Protected Securities).
🔹 5. Three Main Risks of Investing in Bonds
Even though bonds are often seen as “safe,” they carry risks that investors must understand:
1️⃣ Credit Risk (Default Risk)
The issuer may fail to pay coupons or repay the principal.
Higher with corporate bonds and emerging market government bonds.
Mitigated by credit ratings (Moody’s, S&P, Fitch).
📌 Example:
If a company defaults, you may lose part or all of your investment.
2️⃣ Interest Rate Risk
Bond prices move inversely to interest rates.
If rates rise, existing bond prices fall (since new bonds offer better yields).
If you sell before maturity, you could face a loss.
📌 Example:
You bought a 10-year bond at 3%. A year later, rates rise to 5%. Your bond’s market value falls, because investors prefer newer bonds paying higher coupons.
3️⃣ Inflation Risk (Purchasing Power Risk)
Even if you hold the bond to maturity, rising inflation erodes the real value of your returns.
A 3% coupon loses attractiveness if inflation rises to 6%.
📌 Example:
Your bond pays $30,000 annually, but inflation pushes up costs by $40,000 per year → you are effectively losing purchasing power.
🔹 6. Bonds vs. Stocks
Bonds: Debt, fixed income, contractual obligation, lower risk, limited upside.
Stocks: Equity ownership, dividends (optional), higher risk, unlimited upside.
In a company bankruptcy, bondholders are paid before shareholders.
🔹 7. How Investors Use Bonds in Portfolios
Income generation: Retirees and pension funds rely on coupon payments.
Diversification: Bonds often rise when stocks fall, reducing portfolio volatility.
Risk management: Safe-haven bonds (like Treasuries) act as “insurance” during crises.
Speculation: Traders can bet on interest rate moves via bond futures and ETFs.
🔹 8. Bonds vs. Stocks: The TLT–SPY Correlation
One of the most widely followed relationships in global markets is the correlation between:
TLT → iShares 20+ Year Treasury Bond ETF (tracks long-dated U.S. Treasury bonds).
SPY → SPDR S&P 500 ETF (tracks U.S. equities).
📈 Historical Relationship
Over the past two decades, TLT and SPY have often moved in opposite directions. (The Correlation between SPY/TLT often hovers around 0.)
Why? When stocks sell off, investors typically seek safety in Treasuries, pushing bond prices up (yields down).
This negative correlation makes bonds a powerful diversifier in equity-heavy portfolios (60/40).
📌 Example:
2008 Financial Crisis → SPY plunged ~37%, while long-dated Treasuries (TLT) surged as investors fled to safety.
March 2020 COVID Crash → SPY fell ~34% peak-to-trough, TLT spiked ~20% as the Fed cut rates and investors piled into Treasuries.
🐂 Strategy #1 (MA):
Buy SPY when TLT crosses below the 95 MA.
Sell SPY when TLT crosses above the 95 MA.
🔄 But the Correlation Can Shift
In inflationary environments, bonds and stocks can fall together.
2022 is a perfect example:
Inflation spiked → Fed hiked rates aggressively.
TLT dropped ~30% (yields surged).
SPY also fell ~19%.
Both asset classes sold off simultaneously, breaking the hedge.
🐂 Strategy #2 (Re-Balancing):
Buy TLT at the close of the seventh last trading day of the month.
Sell TLT at the close of the last trading day of the month.
Sell TLT short at the close of the month.
Cover TLT at the close of the seventh trading day of the month.
Higher Returns after rate hikes.
📊 Why This Matters for Investors
In normal times: TLT acts as a counterweight to SPY, smoothing portfolio volatility.
In inflationary shocks: Both can decline, reducing diversification benefits.
Lesson: Don’t assume bonds will always hedge equities — context (inflation, Fed policy, growth cycles) matters.
📌 Practical Uses of the TLT–SPY Correlation
Portfolio Diversification
A 60/40 portfolio (60% stocks, 40% bonds) relies on the negative correlation.
Works best when inflation is low and stable.
Risk-On / Risk-Off Gauge
If both SPY and TLT rise → markets are calm, liquidity flows into both risk and safety.
If SPY falls while TLT rises → classic risk-off move (flight to safety).
If both fall → inflation or policy tightening environment (no safe haven).
Trading Signals
Divergence trades: When SPY rallies but TLT also rallies strongly, it may signal equity rally exhaustion (risk-off brewing).
Macro hedge: Long TLT positions can offset downside risk in SPY-heavy portfolios — but only in disinflationary or deflationary shocks.
🔹 9. EWJ–TLT Correlation: Japan Equities vs. U.S. Treasuries
EWJ → Tracks Japanese equities (large & mid-cap companies).
TLT → Tracks U.S. long-dated Treasuries.
Unlike the classic SPY–TLT inverse correlation, the EWJ–TLT relationship is more complex, shaped by:
Global risk sentiment (risk-on/risk-off flows).
Currency effects (USD/JPY exchange rate).
Japan’s ultra-low interest rate environment (BoJ policy).
📈 Historical Tendencies
1️⃣ Risk-Off Periods (Global crises → flight to safety):
TLT rallies (U.S. Treasuries bid).
EWJ often falls, as Japanese equities are highly cyclical and export-driven.
Negative correlation dominates.
📌 Example:
2008 Crisis → TLT surged; EWJ plunged with global equities.
2020 COVID Crash → Same pattern: safety flows to Treasuries, Japanese stocks sold.
2️⃣ Risk-On Periods (Liquidity, global growth optimism):
EWJ rallies with global equities.
TLT may drift lower (yields rising on stronger growth).
Correlation weak to moderately negative.
📌 Example:
2016–2018: Global growth rebound → EWJ rose, TLT fell as U.S. yields climbed.
3️⃣ Currency Channel (USD/JPY)
Japanese equities (EWJ) are sensitive to the yen.
A stronger USD/JPY (weaker yen) boosts exporters (good for EWJ).
TLT rallies often coincide with USD weakness (yields down, dollar down), which can hurt Japanese exporters, adding another layer of inverse correlation.
🔄 Shifts Over Time
Long-term average correlation: Mildly negative (similar to SPY–TLT, but weaker).
During inflation shocks (2022): Correlation turned positive at times:
TLT fell as U.S. yields spiked.
EWJ also struggled due to global tightening & yen weakness.
Both moved down together, breaking the hedge.
📊 Why EWJ–TLT Matters
Global Diversification Check: Investors often think Japanese equities diversify U.S. equities, but they can be just as cyclical. Adding TLT creates the real hedge.
Risk-Off Signal: When both EWJ and TLT rise, it may indicate global liquidity easing (rare but bullish).
Currency Overlay: Always factor USD/JPY → sometimes EWJ’s move is more about currency than equities.
🐂 Strategy #3 (EWJ):
When Japanese stocks are above their 150-day moving average, go long TLT (US long-term Treasury). When the average is below the 150-day average, stay out. The correlation between TLT and EWJ can serve as a breath signal.
📌 Conclusion: Bonds as the Foundation of Finance
Bonds are the backbone of the global financial system, connecting borrowers (governments, corporations) with lenders (investors).
✅ Bonds provide regular income and capital preservation.
✅ They carry risks: credit, interest rate, and inflation.
✅ They are essential for diversification and risk management.
✅The TLT–SPY correlation is dynamic. Historically negative, providing diversification. In inflationary shocks (like 2022), the correlation turns positive, breaking the hedge.
✅ EWJ–TLT is a Global Macro Hedge, But Fragile. Usually inverse: Risk-off = TLT up, EWJ down. Sometimes aligned: Inflation shocks or synchronized global tightening → both down. Currency filter essential: USD/JPY often mediates the relationship. This makes EWJ–TLT correlation a powerful barometer of global macro regimes: Disinflationary slowdowns → Strong hedge. Inflationary crises → Hedge breaks.
For investors, understanding bonds is crucial, even if you primarily trade equities or commodities, because bond yields influence everything: stock valuations, mortgage rates, and even currency markets.
