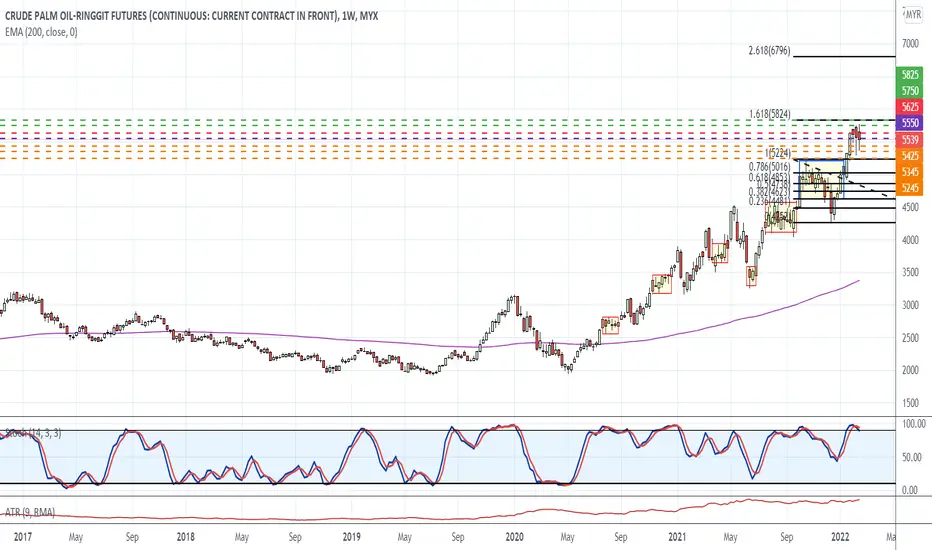
Reversal Signs Continue in Palm Oil MarketFCPO closed higher at 5539 after gap filled at 5612 by last Friday but posted weekly losses.
What were the factors that caused crude palm oil prices struggling to maintain above 5800?
1. India reduce farm infrastructure tax on CPO to 5%, which will effective until Sept 30, with the objective to increase gap between CPO and refined palm oil to benefit the domestic refining industry.
2. Uncertainties over Ukraine crisis lead market to stay vigilant on possible rising tensions.
3. Better production forecast for 1st half of Feb limited the upside of palm oil prices
4. Soybean Oil continue to move higher as concerns over weather forecast and fire incident broke in US biodiesel plant at Claypool, Indiana. Furthermore, India acquire massive purchase on soybean oil as high soybean price for local crushers to reduce output.
5. Crude Oil prices extended losses as prospects of extra supply from Iran. Weaker crude make palm less attractive option for biodiesel feedstock.
6. Near month spread widen as traders foresee East Malaysia production remains weak for Feb.
Technical View:
Market reversal signs remains. Gravestone doji formed in Daily Chart after market tried to move higher but sell down by the market.
Stochastic K% line is crossing down at overbought zone in both weekly and daily chart
We expect market may have short term retracement with immediate support level at 5350.
Suggestion Trade:
Short if stay below 5550
Target Stop Loss (resistance level) 5625
Target Profit (support level)
TP1 5425 TP2 5345 TP 5245
Doji
Bitcoin, long-term viewBitcoin is forming a Doji pattern in the 1-week time frame. The Doji candlestick pattern represents indecision amongst traders and can sometimes foreshadow a trend reversal. This current Doji candlestick pattern that is forming at the time of writing is a result of the ongoing dispute between Russia and Ukraine. the candlestick still has 10-hours to close.

Doji at SupportInfy is having a Doji candle at support line. Preparing for a long position here, looking for a 6 % upside.

The Power of DojiA Doji is created when the open and close for a price are virtually the same. Doji tend to look like a cross or plus sign and have small or nonexistent bodies. From an auction theory perspective, Doji represent indecision on the side of both buyers and sellers. Everyone is equally matched, so the price goes nowhere; buyers and sellers are in a standoff.
When it comes in a downtrend it act as a reversal pattern so we know that the bears power is weak, and bulls start to take control thus the price will go up and the trend will be up , when it comes in an uptrend the bull power is weak , bears starts to take control and price will eventually go down . But in technical analysis you cant enter a trade only from one sign so you should know you Support and Resistance area, draw your trend lines, use some indicators, and when you see the Doji know you know its the perfect time to execute the trade.

ADAUSDT Break + Retest 50Ma SHORT PHi everyone
Daily"
Going short ADAUSDT
RSI still has a long way to get down to over sold area, had confirmation from red DOJI and second long Red candle. + Price fail to cross up 50 MA
ALWAYS look for extra confirmation on any trade, Anything like a bullish/ bearish candle such as the one we can see here "Red Doji'
Possible drop to $1 If bears stay strong, then look for rebound up to retest $1.50 Area " I would personally hold on any long positions until we ether confirm a new strong new trend or buy at $1.5 area"
Happy trading people
(No financial advice)
DISCLAIMER
The trading ideas, analysis, and comments above should not be considered financial advice or recommendation to trade or invest in any financial product. Your personal situation has not been taken into consideration in the trade ideas. This page is for general educational purposes only. Do not buy or sell any product discusses on this page before doing your own research. Always do your own analysis and research and be aware of the risks involved in trading any financial product :)

AUDNZD - Short IdeaI see a great opportunity to short the AUDNZD, especially to a half risk or break-even situation.
Idea laid out here.
1% Risk 4:1 RR
I would start taking profits sooner than 4:1 of course, but there is room to run on this trade.
Happy Trading!

Palm Oil Prices Back to the Range of 4700-5200 Again?Palm oil prices closed higher and back to the range of 4700-5200.
Several Factors that make the palm oil prices back to the range of 4700-5200 as below:
1. Weakness in soybean oil after US raised proposal to scale back biofuel blending mandates
2. Shortage of Workers due to coronavirus pandemic & higher cost of recruitment as palm oil producers make changes in response to accusations of forced labour
3. Record high fertilizer prices
4. MPOB showed higher inventories offset by lower production and higher exports
Technical view:
1. Doji formed after range trading between 4724-4949- signal market struggle for new direction
2. Harami indicates reversal signal
3. Stochastic level= remain bearish signs
Suggestion Trade:
Buying at support 4700; Stop Loss 4600; Target Profit 4950-5000
Selling at resistance 5000; Stop Loss 5200; Target Profit 4750-4800
Disclaimer: Trading Carries Risks.
Happy Trading!! Cheers.
** DISCLAIMER: FOR INFO ONLY. TRADING CARRIES RISK **

Solana bottomed out?Solana is currently in a down trend but looks like it has bottomed out. It is forming a doji candle that hit the 200 day moving average which also happens to correlate(all be it to a loose extent) to a fibonacci tracement level. Great time to buy Sol. Always be aware of BTCs movements in the market.

SAIL LOOKING GOODthere is 55ema high low band support
it also foam doji candle and also confirm doji
there is also a positive divergence


XAUUSD Buy1. Daily Doji candles for 3 days suggest ending a downtrend
2. Trend line daily
3. Supported by 50 and 200 SMA
4. Bullish bias because of risk-averse nature as the covid new variant is on rising

TOPGLOV Not every candlestick pattern "count". where/when.28/11/TopGlove.. Not every candlestick pattern "counts" Depend on where/when it was "found"...Is is a "valid" counts?. A "doji"? A "Pin Bar" A "Good" Morning Star? on not 1 minute but monthly chart..?..( Wait,, Not yet), wait until it closed monthly bar after 30/Nov/21

#PLTR reacts well on 20$ support and closed above yesterday highAs I shared this morning, I hoped for a daily close abve the high of the yesterday doji candle. The price managed to close higher than that and this is to me a great sign of possible reversal and confirmation of the rebounce from the 20$ level.
I just would like to mention that the last two times the RSI touched the oversold territory (May and July 2021) the price reacted reaching an average of 45% increase and I want to think that this might be happening again this time.
Not a financial advice, just personal opinion. Do your own due diligence and good luck!

Rocket Lab setting up for a strong reversal. PIPE dry? 🚀 RocketLab has a few catalysts coming up.
The sell off was due to the PIPE being unlocked. This isn't a high redemption SPAC pump and dump, I don't expect this to fall any further than $12.30. Strong buying there.
Nice doji reversal on the weekly with selling pressure easing on the indicators.
Cost to borrow is going down which indicates it's not as lucrative to short.
Looking for $15+ by mid November and a run up to $20+ towards EOY due to reward structure for management if they close there for a set amount of dates.

coal indiacoal india has formed a doji in 1hr candle today and the rsi is in over sold region better to buy at gap up
for swing only
buy-160.8-161.2
t1-170
t2-175
t3-184
stoploss-153

ETH - WeeklyA close under $4614 will be bearish for this pair on the HTF.
Big reversal signal if we close as a bearish doji like now.
A top wick before breaking the low of this current weekly candle.
The previous weekly candle closed below the ATH and now this is looking like a liquidity grab before a move lower.
A weekly close above the previous ATH would be bullish.

KLCI may done muti-months correction. 12/Nov/211)On Charts : Charts consist of 3-Dimensions - The X-factor ( Time or Cycle ), The Y- factor ( Price Geometry ), AND The Z-factor ( The Speed ).. 2)On Elliot Wave / Market Structure : Unlike Textbook written rule : ALL Impulsive wave comprise of ONLY a-b-c sub-waves NOT 1,2,3,4,5 waves.. AND there is NO Truncated 5th wave BUT ONLY wrong wave counts...

SPX: Could this be the beginning of a PULLBACK?Hello traders and investors! Let’s see how the SPX is doing today!
Last Friday, we had a classic Doji candlestick pattern in the daily chart, which wasn’t triggered today, so we have no pullback confirmation yet.
However, we have more key points to work with right now. Besides Friday’s Doji, if we look in the 1h chart, we see a sideways correction to the 21 ema:
The index didn’t fill the last gap around 4,680, indicating a lot of strength, but we have a support at 4,681 (green line).
If the index loses this support tomorrow, it’ll trigger a bearish structure in the 1h chart, a bearish pivot point (a lower high followed by a lower low). This breaks the bias, and brings a correction that will probably be seen in the daily chart.
If this correction would be a price correction or a sideways correction until the 21 ema in the daily chart catches up with the price in the daily chart, we don’t know yet. Remember, none of these signs was triggered yet. Let’s wait for more confirmation.
If you liked this analysis, remember to follow me to keep in touch with my thoughts and insights about the stocks and indices.
Have a good week.

SPX'S Daily Doji candle, it's not what you think it is !With everything else absolute, this is more bullish than bearish candles. Statistic and live trading VS books, theories & paid
subscriptions. Both of our studies since 2012 & sine 2016 presented before you below there is more chance to go up rather
than down . That said, the formation and the recent strong bullish momentum might be favoring the other 43% of a bearish
next week.
-The certainty trap ‘Never’ &‘always’ have no place in MKTS! Anything is possible, and the unexpected is inevitable proceed accordingly.

PYPL bullish Signal: Dragonfly Doji + CCI DivergencePYPL is currently on a downtrend, but there are multiple signs that the current trend might reverse.
Price is falling while the Commodity Channel Index is rising - this is a very obvious divergence ... and an indication of a potential trend reversal.
Taking a closer look at CCI and Price, we also see hidden divergence a couple of days ago (lower lows vs higher lows).
During the latest divergence, we spot an interesting candle chart pattern: a Doji. Dojis are usually indicating indecision - in this case the long-legged Doji almost looks like a Dragonfly Doji.
In combination with a divergence, this can be seen as a rejection of lower prices and as a bullish signal.
The current monthly Pivot has not yet been touched, so the price might rise to this Pivot point at 245.97 .
Interestingly, a few days ago, on October 12th, we had an almost identical setup: (minor) downtrend, bullish divergence, Doji, untouched pivot. The candle following the Doji was still red but the price went up to the monthly pivot.

BTCUSD - W1 - SHOOTING STAR + DOJI !WEEKLY (W1)
Prior week a "SHOOTING STAR" had been triggered which has been followed, last week by a "DOJI" which is adding further pressure to the downside
as an uncertainty and indecision is growing...
So what next ?
Well, in looking in this weekly picture, the first significant support level @ 58'100 has been tested with an intraweek low seen last week @ 57'500.
As long as the BTCUSD stays on a weekly closing above 58'100, it is OK for a the time being.
A CLEAR BREAKOUT OF 58'100 WOULD PUT THE FOCUS ON THE 53'200-52'300 TRADING RANGE !!!
Interesting to note that the top of weekly clouds support area is around 43'300 which is also the 61.8 % Fibonacci retracement of the 28'600-66'994,
June-October rally.
DAILY (D1)
Looking briefly at the daily picture, the ongoing downtrend channel is intact, and levels to watch in this time frame are the following :
UPSIDE : 63'000
DOWNSIDE : 60'000
A daily closing level, either above 63'000 or below 60'000 would open potentially the door for a 4'000 points move, targeting respectively a retest of former
high around 67'000 and a move towards 56500/56'000 on the downside.
4 HOURS (H4)
Watch the clouds !
Have a great week.
Take care and all the best.
Ironman8848

Can anyone help identify this type of DOJI? Such an odd DOJI candlestick on the $F FORD daily contained above a gap up from the previous day. I know a DOJI needs to open and close at the same relative price for the day, but is it still considered a DOJI on a gap up? Please help!

SPX: Another RECORD HIGH! But, what if it starts dropping?Hello traders and investors! Let’s see how the SPX is doing today!
The index is going up nicely, but the candlestick in the daily chart looks enigmatic, as it is almost a Doji. The long shadow above the daily candlestick is annoying for sure, and kind of ruins the bullish momentum.
Since October 13, it seems the index deserves a pullback to the 21 ema again, at least, but we don’t see any meaningful weakness sign. Even if it closes doing a Doji, a Shooting Star, or a possible Spinning Top candlestick pattern, we be aware of the fact that the trend is clearly bullish in the 1h chart too:
As long as we don’t see any bearish confirmation here, and a sequence of lower highs/lows, the index won’t reverse in the daily chart. The 21 ema is pointing up, and it is working as a nice support as well.
This makes me wonder if a bearish candlestick pattern in the daily would be another bear trap – just a pullback to the 21 ema in the 1h chart. That’s why I prefer to use the 1h chart as a main guide for now. If it drops, ok, we have many support levels to work with, and probably the 21 ema in the daily chart will be our best indicator for now.
As some of you have been pointing out, a pullback would be great, and many other stocks would probably give us buy signs. Now I think it is the time to just hold some positions, instead of buying like crazy, and wait for more signs on the index.
If you liked this analysis, remember to follow me to keep in touch with my daily updates on stocks and indices. What’s more, support this idea if you liked it!
Have a good day.
