US Dollar Index potential initial target could be 95.80The US Dollar Index might have formed a meaningful top at 96.85/86 levels last week before reversing lower on Friday. The index seems to be testing the recent swing highs and could reverse lower from current price around 96.75 levels. Let us have a re-look at medium term and short term wave counts for clear direction. The medium term outlook suggests that a flat corrective drop could be in the making with Wave A in place around 93.80 and Wave B in place around 96.85 levels respectively. Till the time prices stay below 96.85 and broadly below 97.00 levels, we could see a sharp drop lower towards 95.80 at least as the short term waves unfold. A lower degree waves i and ii could be complete now and wave iii could begin any moment till prices stay below 96.85.
Disclaimer:
This written/visual material is comprised of personal opinions and ideas. The content should not be construed as containing any type of investment advice and/or a solicitation for any transactions. It does not imply an obligation to purchase investment services, nor does it guarantee or predict future performance. FXTM, its affiliates, agents, directors, officers or employees do not guarantee the accuracy, validity, timeliness or completeness of any information or data made available and assume no liability for any loss arising from any investment based on the same.
Dollar-index

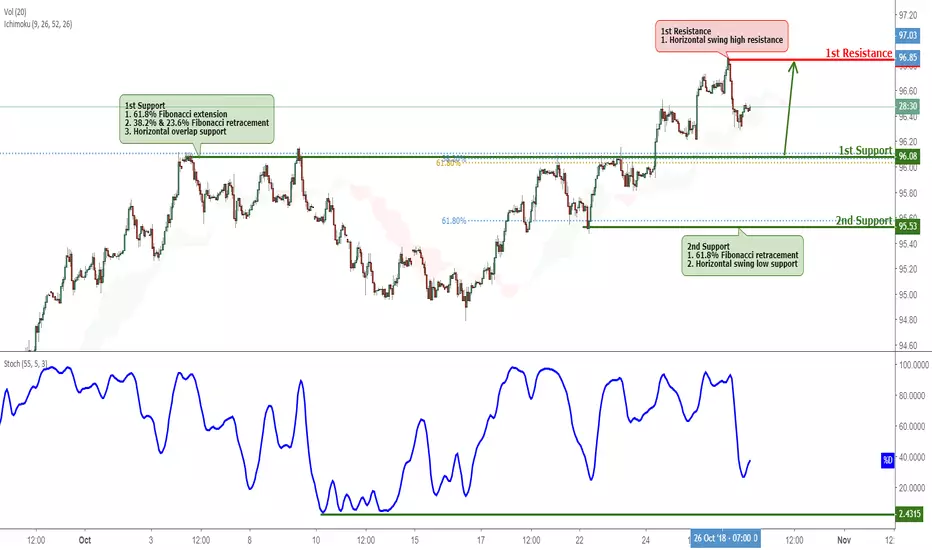
DXY Approaching Support, Potential Bounce!DXY is approaching its support at 96.08 (61.8% Fibonacci extension, 38.2% & 23.6% Fibonacci retracement, horizontal overlap support) where it could potentially rise to its resistance at 96.83 (horizontal swing high resistance).
Stochastic (55, 5, 3) is approaching its support at 2.4%.
US Dollar Index Macro ViewThe US Dollar Index moving back into previous uptrend channel breaking up above 12260 level and has pull back to retest it again. The long-term still remains as unchanged constructive for bull, till price break below 12200 to 12100 levels going forward. Looking into medium-term channel, the US Dollar Index could continue its way towards 12330 levels progresses. The short-term are suggesting that that it losses some strength breaking previous high that sideways might be seen for upcoming week. Overall, the medium-term bull structure prevails until prices stays below 12260 levels.
Disclaimer:
Any opinions, news, research, analyses, prices or other information contained in this content is provided as general market commentary and does not constitute investment advice. ForexBriefcase will not accept liability for any loss or damage including, without limitation, to any loss of profit which may arise directly or indirectly from use of or reliance on such information.

US Dollar Index Macro ViewThe US Dollar Index uptrend channel has broken out testing low at 12096 levels and continue up to 12262 levels before pulling back to 12169 levels. The long-term still remains constructive for bull, till price stay below 12096 levels going forward. Looking into the medium-term correction wave, the US Dollar Index could be on its way towards 12096 levels as Wave C progresses. The short-term are suggesting that sideways might be seen for upcoming week. Overall, the medium-term correction structure prevails until prices stay below 12096 levels.
Disclaimer:
Any opinions, news, research, analyses, prices or other information contained in this content is provided as general market commentary and does not constitute investment advice. ForexBriefcase will not accept liability for any loss or damage including, without limitation, to any loss of profit which may arise directly or indirectly from use of or reliance on such information.

US Dollar Index tops out at 96.00 ?The US Dollar Index popped up by a few points above the resistance zone 95.60/80, and touched 96.00 levels before pulling back. The story still remains constructive for bears, till prices stay below 96.16 levels going forward. Looking into the medium term wave counts, the US Dollar Index could be on its way towards 93.80 and lower levels as Wave C progresses. Also note that short term wave counts are suggesting that a lower degree wave i and ii might already be in place at 94.80 and 96.00 levels respectively. An alternate count could be a re-test of 96.16 levels, before giving in to bears again. Overall, the medium term bearish structure prevails until prices stay below 96.16 levels.
Disclaimer:
This written/visual material is comprised of personal opinions and ideas. The content should not be construed as containing any type of investment advice and/or a solicitation for any transactions. It does not imply an obligation to purchase investment services, nor does it guarantee or predict future performance. FXTM, its affiliates, agents, directors, officers or employees do not guarantee the accuracy, validity, timeliness or completeness of any information or data made available and assume no liability for any loss arising from any investment based on the same.

Short the pull back DXY has finally given us the much awaited pull back we've been looking for.
Key S/R level needs to be tested for resistance, expecting price to resume its sell off after testing the red pivot, targeting the untested resistance turned support level on the downside.


DXY Ending Soon The Elliott Wave Flat Correction?!DXY short-term Elliott wave view suggests that the index is doing a Flat correction coming from 8/28/2018 low within cycle red wave II. Meaning that the internal distribution of cycle from that low is showing the sub-division of 3-3-5 wave structure. Where black wave ((A)) ended in 3 swings at 95.73 on 9/04 peak. Down from there the decline to 93.81 low ended black wave ((B)) lower as double three structure with the sub-division of 3 wave corrective sequence in blue wave (W),(X) & (Y).
The initial decline to 94.43 low ended blue wave (W) as zigzag structure. Up from there, the bounce to 94.99 high ended blue wave (X). Down from there, the decline to 93.81 low ended blue wave (Y) as zigzag structure & also completed the black wave ((B)) as well. Above from 93.81 low, the rally higher is taking place as an impulse in black wave ((C)) of II with the sub-division of 5 waves structure in blue wave (1),(3) & (5).
Where the first leg higher to 94.40 high ended blue wave (1). And pullback to 93.95 low ended blue wave (2).
A rally to 95.36 high ended blue wave (3). Then a pullback to 94.99 low ended blue wave (4). Near-term bluee wave (5) remain in progress and may or may not extend higher 1 more time within the blue box area by holding below the 95.93 invalidation level before ending the Flat correction in cycle red wave II.
Afterwards, the index is expected to resume the downside or should react lower in 3 swings at least. We don’t like buying the index.

US Dollar Index potential bearish reversal through 95.50/96.00The US Dollar Index has been testing resistance zone between 95.40 and 96.00 levels respectively. Looking at the wave counts (lower degree), it is quite possible that the last wave of expanded flat might have terminated at 95.30/40 levels yesterday. If this holds true, we could see a sharp decline from current price action. As an alternate count, the expanded flat could terminate through 95.50/96.00 zone (above previous high at 95.70 levels earlier). In either case, a potential bearish reversal could resume any moment from the above price levels. Please note that the potential of a sharp rally from 93.90 levels earlier is now looking near to complete. It could be a safe trading strategy to remain/add short positions between 95.50/96.00 levels. A medium term bearish reversal could be on its way soon.
Disclaimer:
This written/visual material is comprised of personal opinions and ideas. The content should not be construed as containing any type of investment advice and/or a solicitation for any transactions. It does not imply an obligation to purchase investment services, nor does it guarantee or predict future performance. FXTM, its affiliates, agents, directors, officers or employees do not guarantee the accuracy, validity, timeliness or completeness of any information or data made available and assume no liability for any loss arising from any investment based on the same.

US Dollar Index could terminate at 95.50/96.00 levels.The US Dollar Index was seen accelerating into its final corrective leg, within the expanded flat and has made an interim high close to 95.40 levels on Friday. Looking into the wave structure, the index could find resistance around 95.50 or it could push through 96.00 levels before resuming lower again. The expanded flat structure could be a traders nightmare if not identified at the right time. We have now changed our trading strategy from neutral to short, until prices remain below 97.00 levels going further. Please note that the medium term wave structure remains unchanged and the US Dollar Index could drop towards 91.50 levels, going forward.
Disclaimer:
This written/visual material is comprised of personal opinions and ideas. The content should not be construed as containing any type of investment advice and/or a solicitation for any transactions. It does not imply an obligation to purchase investment services, nor does it guarantee or predict future performance. FXTM, its affiliates, agents, directors, officers or employees do not guarantee the accuracy, validity, timeliness or completeness of any information or data made available and assume no liability for any loss arising from any investment based on the same.

SHORT TERM Bearish view on Dollar indexSHORT TERM Bearish view on DXY
DXY Head & Shoulders Pattern on the Daily, retest and rejection of critical retracement zone. Details are on the chart.
Thank you for support and likes. Feel free to comment below.

US Dollar Index clears resistance at 94.80The US Dollar Index took out resistance at 94.80 yesterday with ease, as expected. At the moment, it is pulling back a bit and seen trading at 94.95/95.00 levels respectively. As long as prices stay above 94.40 levels, we could expect a push higher towards 95.70/95.00 levels. Looking at the wave structure, it can be assumed with more probability that the US Dollar Index could be carving out an expanded flat corrective rally which could extend up to 96.00 levels, going forward. With around 100 points of potential upside left for now, we would like to change our stance from neutral to short again. It could be a matter of time before wave C lower resumes.
Disclaimer:
This written/visual material is comprised of personal opinions and ideas. The content should not be construed as containing any type of investment advice and/or a solicitation for any transactions. It does not imply an obligation to purchase investment services, nor does it guarantee or predict future performance. FXTM, its affiliates, agents, directors, officers or employees do not guarantee the accuracy, validity, timeliness or completeness of any information or data made available and assume no liability for any loss arising from any investment based on the same.

US Dollar Index clears line of resistanceThe US Dollar Index has broken above its line of immediate resistance depicted on hourly chart here. The index is seen to be trading around 94.50 levels at this point in writing and could be targeting 94.80/95.00 resistance zone immediately. Structurally, the US Dollar Index could be well under its way to carve an expanded flat a-b-c (not highlighted here), eventually forming Wave B of a larger degree. If the above count holds well, we could see Wave B termination point towards 95.70 or 96.00 levels going forward. Please note that the medium term structure still remains bearish , but a short term rally could complete Wave B. We remain neutral for now.
Disclaimer:
This written/visual material is comprised of personal opinions and ideas. The content should not be construed as containing any type of investment advice and/or a solicitation for any transactions. It does not imply an obligation to purchase investment services, nor does it guarantee or predict future performance. FXTM, its affiliates, agents, directors, officers or employees do not guarantee the accuracy, validity, timeliness or completeness of any information or data made available and assume no liability for any loss arising from any investment based on the same.

US Dollar Index could produce a surprise rally towards 95.70 ?The US Dollar Index has tested lows at 93.80 twice now without much success and is back higher, trading around 94.30/40 levels at this point in writing. Please note that a short term resistance line is passing just through the price and a break here could push the index higher towards initial resistance at 94.80 levels. Looking at the wave structure, medium term bearish outlook still remain intact, but the US Dollar Index could produce a rally towards 95.50/96.00 levels before reversing lower again. We have changed our stand from bearish to neutral for now and would be looking for intraday rallies through 95.50 levels at least, to initiate probable shorts.
Disclaimer:
This written/visual material is comprised of personal opinions and ideas. The content should not be construed as containing any type of investment advice and/or a solicitation for any transactions. It does not imply an obligation to purchase investment services, nor does it guarantee or predict future performance. FXTM, its affiliates, agents, directors, officers or employees do not guarantee the accuracy, validity, timeliness or completeness of any information or data made available and assume no liability for any loss arising from any investment based on the same.

US Dollar corrective rally towards 95.70/96.00 ?The US Dollar Index recovered sharply on Friday, after printing lows around the 93.80 levels, slightly lower that the previous Wave 4 termination point at 94.10 levels. The rally was expected to materialize and it was just a matter of time for bulls to come into action. Looking at the structure, the US Dollar Index could be carving out a potential expanded flat corrective wave. If this is the case, we could see prices staying above 93.80 levels and pushing towards 95.70 levels going forward. Please note that we remain neutral for now and would be looking to sell higher as a safe trading strategy.
Disclaimer:
This written/visual material is comprised of personal opinions and ideas. The content should not be construed as containing any type of investment advice and/or a solicitation for any transactions. It does not imply an obligation to purchase investment services, nor does it guarantee or predict future performance. FXTM, its affiliates, agents, directors, officers or employees do not guarantee the accuracy, validity, timeliness or completeness of any information or data made available and assume no liability for any loss arising from any investment based on the same

US Dollar Index could be looking to break above 94.70 ?The US Dollar Index is still seen to be consolidating in a narrow range between 94.30 and 94.70 levels respectively. The index is trading at 94.40/45 levels at this point in writing and is expected to turn higher pushing above 94.70 levels, provided the lower support range remains intact. With the bearish structure intact for US Dollar Index for medium term outlook, a safe trading strategy could be to remain/add to short positions on intraday rallies towards 95.00, 95.70 and 96.00 levels. Looking at the wave structure, the US Dollar Index could be poised to drop towards 92.00 and 91.50 respectively. It remains to be seen, where a lower top is being carved out for now.
Disclaimer:
This written/visual material is comprised of personal opinions and ideas. The content should not be construed as containing any type of investment advice and/or a solicitation for any transactions. It does not imply an obligation to purchase investment services, nor does it guarantee or predict future performance. FXTM, its affiliates, agents, directors, officers or employees do not guarantee the accuracy, validity, timeliness or completeness of any information or data made available and assume no liability for any loss arising from any investment based on the same.

MONTHLY ANALYSIS ON DXY(US DOLLAR INDEX)I believe that the Dollar Index is still bullish on the monthly perspective at the present moment @15/09/2018(UK DATE) but it is losing steam and will look to reverse around the 98 -100 region. This will give traders an opportunity to go long for the time being i'm expecting in the upcoming months. As we reach the levels of resistance i will expect a reversal and price should look to fill more of the market inefficiency to the downside( along the way turning support into resistance).
I will be updating it as price goes along in the upcoming months...

US Dollar Index bearish scenario intact.The US Dollar Index dropped lower yesterday, testing lows at 94.40 levels, before pulling back again. The index is seen to be trading at 94.51 levels at this moment in writing, and could continue drifting lower. There is no change in the bearish potential we had discussed earlier and that a safe trading strategy cold be to hold/add short positions. The index could be inching towards 92.00 and 91.50 potential lows. As an alternate scenario, if a flat is getting unfolded, we could see a surprise rally again testing 95.70 levels at least. Overall bearish scenario remains.
Disclaimer:
This written/visual material is comprised of personal opinions and ideas. The content should not be construed as containing any type of investment advice and/or a solicitation for any transactions. It does not imply an obligation to purchase investment services, nor does it guarantee or predict future performance. FXTM, its affiliates, agents, directors, officers or employees do not guarantee the accuracy, validity, timeliness or completeness of any information or data made available and assume no liability for any loss arising from any investment based on the same.

US Dollar Index carving a complex corrective Wave B?The US Dollar Index hourly chart continues to consolidate between 94.40 and 95.60 levels for now. The index is trading around 94.90 levels at this point in writing and could drop to 94.75/80 during intraday, before turning higher again. Please note that structurally, the US Dollar Index would require to break below 94.80 and 94.40 levels to confirm that a meaningful top is in place at 95.70. Looking at the wave count, the US Dollar Index might be still carving out a more complex Wave B than expected earlier. Please do not be surprised if the index produces a snap rally towards 95.70/96.00 one last time before giving in to bears.
Disclaimer:
This written/visual material is comprised of personal opinions and ideas. The content should not be construed as containing any type of investment advice and/or a solicitation for any transactions. It does not imply an obligation to purchase investment services, nor does it guarantee or predict future performance. FXTM, its affiliates, agents, directors, officers or employees do not guarantee the accuracy, validity, timeliness or completeness of any information or data made available and assume no liability for any loss arising from any investment based on the same.

USDX approaching resistance, potential drop! USDX is approaching our first resistance at 94.91 (horizontal overlap resistance, 23.6% Fibonacci retracement) and a strong drop might occur below this level pushing price down to our major support at 94.40 (horizontal swing low support, 78.6% Fibonacci retracement). Ichimoku cloud is also showing signs of bearish pressure in line with our bearish bias.
Trading CFDs on margin carries high risk.
Losses can exceed the initial investment so please ensure you fully understand the risks.

US Dollar Index resistance remains at 95.70/96.00 levelsThe US Dollar Index short term story continues to inspire a potential bearish reversal. We can safely assume that the index has either formed a potential top at 95.70 levels or it could test 96.00 levels before resuming lower again. A consistent push below 94.80 levels could indicate that a meaningful top is in place at 95.70 levels. In either case, it is safe to assume that the US Dollar Index -0.07% is a potential sell on rallies chart going forward. It remains to be seen if the bearish reversal would be from current levels or from 96.00 levels going forward.
Disclaimer:
This written/visual material is comprised of personal opinions and ideas. The content should not be construed as containing any type of investment advice and/or a solicitation for any transactions. It does not imply an obligation to purchase investment services, nor does it guarantee or predict future performance. FXTM, its affiliates, agents, directors, officers or employees do not guarantee the accuracy, validity, timeliness or completeness of any information or data made available and assume no liability for any loss arising from any investment based on the same.

US Dollar Index remains vulnerable around 95.70/96.00 levelsThe US Dollar Index 0.02% hourly story is suggesting that the recent rally on Friday may push it higher towards 96.00 levels before finding strong resistance again. There is no certainty of the above though, but a possibility cannot be ruled out. Please note that fibonacci 0.618 resistance is also seen at 96.00 levels and we can expect a bearish reaction if prices manage to reach there. Overall, the US Dollar Index 0.02% remains a chart to be probably sold upon intraday rallies through 95.0/96.00 levels. Yet another round of sell off could be on its way towards 92.00 levels.
Disclaimer:
This written/visual material is comprised of personal opinions and ideas. The content should not be construed as containing any type of investment advice and/or a solicitation for any transactions. It does not imply an obligation to purchase investment services, nor does it guarantee or predict future performance. FXTM, its affiliates, agents, directors, officers or employees do not guarantee the accuracy, validity, timeliness or completeness of any information or data made available and assume no liability for any loss arising from any investment based on the same.
