NZDCHFDouble Bottom Reversal Pattren .
Trade Plan.
Buy stop
EP:0.46857
SL:0.46415
TP:0.47298
RRR 1:1
Double Top or Bottom

GBPCAD: Another Gap Trade 🇬🇧🇨🇦
With a high probability,
GBPCAD will fill the gap down soon.
A formation of a bullish imbalance candle after a NY session opening
provides a strong confirmation.
Goal - 1.8796
❤️Please, support my work with like, thank you!❤️
I am part of Trade Nation's Influencer program and receive a monthly fee for using their TradingView charts in my analysis.

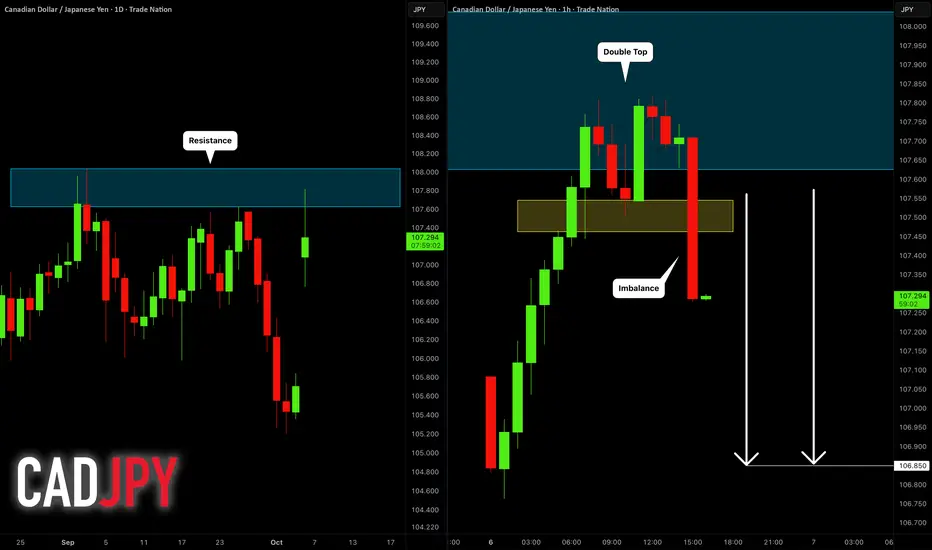
CADJPY: Pullback Confirmed! 🇨🇦🇯🇵
CADJPY may continue falling after today, following
a test of a major horizontal daily support cluster.
A double top pattern formation on that and a violation
of its neckline with a selling imbalance provide a strong
confirmation.
Goal - 106.85
❤️Please, support my work with like, thank you!❤️
I am part of Trade Nation's Influencer program and receive a monthly fee for using their TradingView charts in my analysis.
XAGUSD GOOD SELL OPTIONWe have seen metals roaring upwards. However after recent Diplomatic and Geopolitical situations we can see slight pull back

Bitcoin's Third Attempt to Break All-Time HighBitcoin has tried breaking its all-time high twice already. The first time, it reached a Measured Move target but pulled back to the previous High. The second attempt pushed to the all-time high but failed to hold (false breakout).
Now Bitcoin is making its third attempt. Here's my strategy:
If BTC retraces to the 50% level, I'm planning to enter a long position:
- Take Profit Target: $176,000
- Stop Loss: $108,600
However, if this third attempt fails to break higher and hit my SL, I expect Bitcoin to drop significantly, potentially down to $70,000. At that point, forget BTC.
This is a high-risk, high-reward setup. Third attempts often either break through strongly or reject hard. I am watching the 50% retracement level closely for entry timing.

Bitcoin double bottomdo not be suprised or we fall back to 117.5k.
bitcoin has double bottomed at 107-109k.
the double bottom breakout zone was 117.5k
a retest to this level would be very healthy and would only give a buy signal to alot of traders who dont buy breakouts but buy the retest.
I do not say it will retest but if it comes down. 117.5k would be the buy target.

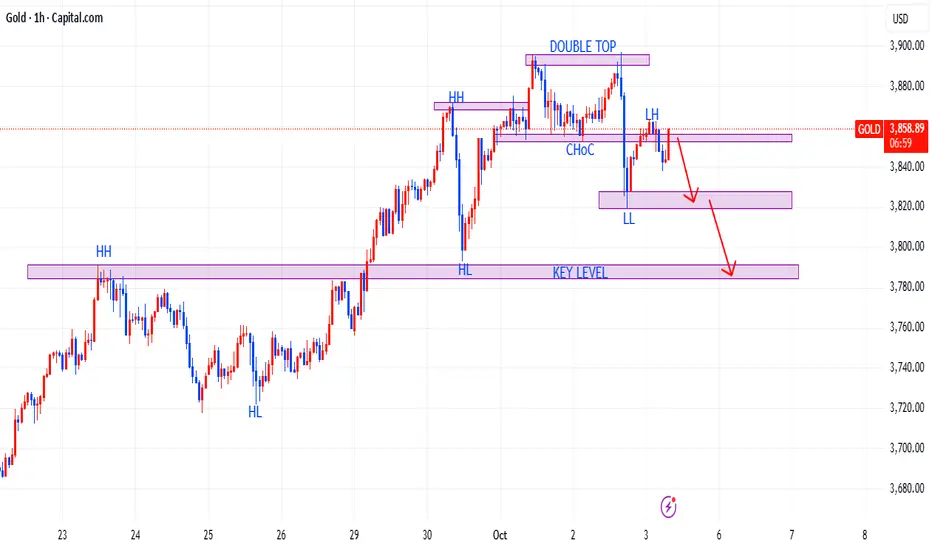
GOLD HAS A HIGH CHANCE OF DROPPING My analysis shows that we might experience GOLD dropping for some short time, as we can see the trend was Bullish and making HH and HL until price formed a Double Top(reversal sign). CHoC occurred and price broke below forming a LH and LL, price is now retesting our CHoC and might continue to drop after this
Note- price tried to break above our CHoC and it rejected and is now currently at the CHoC zone, it is best to wait for a candle confirmation of bears, to see if it will reject or break above. If it rejects again then we can take that as our entry to sell as the price will be going down. Kindly follow for more technical analysis📉
AUDJPY: Pullback From Resistance Confirmed 🇦🇺🇯🇵
There is a high chance that AUDJPY will continue retracing from
the underlined resistance cluster.
A double top pattern formation on that and its neckline breakout
provide a reliable confirmation.
Goal - 97.18
❤️Please, support my work with like, thank you!❤️
I am part of Trade Nation's Influencer program and receive a monthly fee for using their TradingView charts in my analysis.

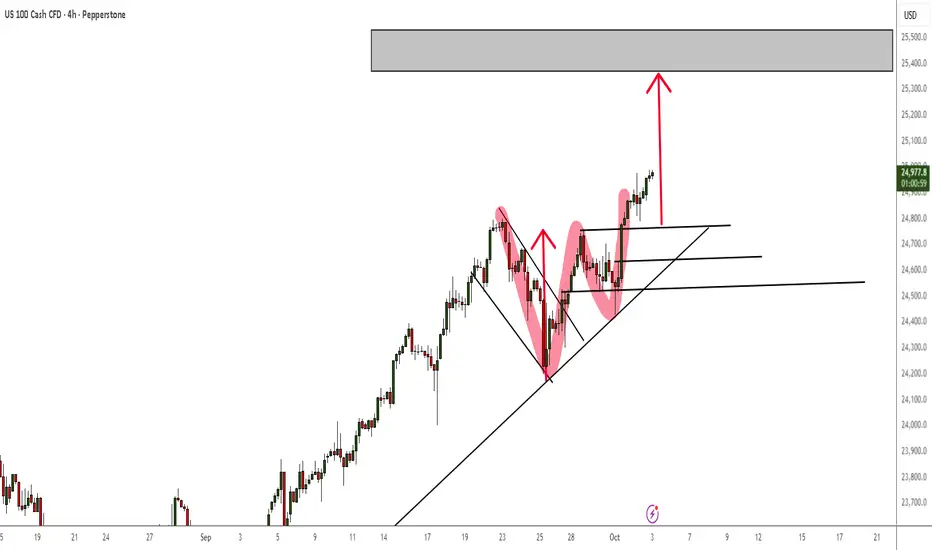
NASDAQ W Formation Bullish PatternNow that we have a confirmed double bottom rejection on the H4 TF, this means we can expect NQ to continue to rally to new ATHs for a bit longer than we all anticipated. Even if it first pulls back slightly to retest one of those lows.
You are better off as a buyer in this market.
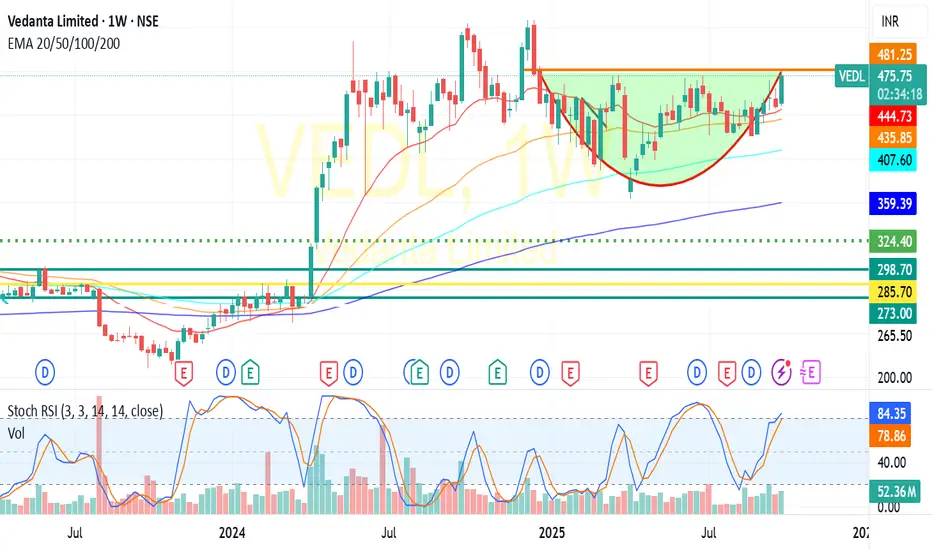
VEDL:Likely Rounding bottom Break OutVEDL:Showing great momentum and trading above all its 20/50/100/200 DEMA averages in long term chart.Also formed a rounding bottom in weekly chart,price and volume action suggests neckline breakout at 480 likely to test 500+(For educational purpose only)
Trade idea on Xauusd Trade idea on Xauusd
Sell @ 3848.03
SL: 3864.86
Tp:3825.97
Tp2:3802.31
Apply proper risk management

Not the Bottom Yet—Gold Poised to Retest 3800Gold failed to break through 3900 again and fell all the way from around 3897 to 3819, with a drop of $78 again. The two recent declines of this magnitude have greatly hit the confidence and sentiment of market bulls, and the bearish atmosphere in the market may become even stronger.
Although gold rebounded again after touching 3819, it failed to hit 3900 twice and has successfully constructed an M-shaped double top structure in the short-term structure. Suppressed by this technical structure, the bullish momentum may be difficult to sustain and will intensify the short-term volatility. The volatility range is likely to be switched to the 3860-3820 area. Therefore, based on the current market changes, we cannot blindly be bullish on gold for the time being.
From a technical perspective, gold is under pressure in the 3850-3860 area in the short term, so if gold rebounds and touches near this area, we can give priority to shorting gold, first targeting the retracement target area: 3835-3825 area. Once gold falls below the level around 3820, it is very likely to test the support strength of 3800 again.

NZDJPY BULLISH CORRECTION.Price is currently at previous support level at (85.756-85.552), price formed a double bottom higher low at the level signaling possible bullish correction at the level.

SPX PULLBACK SOON?SP:SPX could start pulling back as soon as this monday, TVC:DXY has double bottomed and ready to run up.
SP:SPX mostly go inverse TVC:DXY
will start short position as soon as i get the confirmation.

USDJPY Long Trade IdeaTrend:Bearish
Divergence: Bullish
Reversal Pattern: Double Bottom
Bias: Bullish
Scenario: Buy Stop at LH Breakout
Trade Plan
Stop Loss: 146.5
Entry Level: 147.65
TP1 148.8

XAN Double bottomXAN shows us a double bottom pattern what can lead to a upwards trend and will give us about 80% profit.
Always do your own research, this is no financial advice.

trade idea on xausdprice has finally completed the head and shoulder pattern and a break of the neck line support, i will be waiting for a retest of that broken support around 3854.531 for a short, else gold would continue melting from here on to the down side
Let's see how things play out

XAUUSD Double Top Trend Bullish
Divergence Bearish
Reversal Pattern Double Top
Bias Bearish
Scenario Sell Stop at neckline breakout
Trade Plan
Stop Loss 3903
Entry Level 3845
TP1 3787

Speculative **Trade setup** GIGACHADGIGA is a meme token deployed on the Solana blockchain intended to honor the legend Ernest Khalimov the original “Gigachad”, by utilizing the strength of memes and “Chad” energy.
GIGA is a community run project.
On the Daily there is a possible Double bottom forming
Taking this #Meme coin back over 2 cents.
Probably catching a bid from the strong performance shown by #SPX6900
Part of #Murad's meme index.

A Bullish Opportunity for Lido DaoThe price of Lido DAO (LDO) is at a critical point right now, according to technical analysis on the weekly timescale. It is testing the Double Bottom pattern's neckline around US$1.1108 and is also making an effort to break through the 8-EMA resistance at US$1.1957. The price has a broad range of potential for upward movement if it can effectively break out of the 8-EMA level and reject the neckline without dropping below the bullish trendline that supports it. The initial objective is about US$1.5683, and a more optimistic target is around US$2.1888.

EURAUDStrong daily resistance around 1.79000 and a double top was formed. Neckline broken and retested on the H4. We could see price go back down to the monthly level around 1.74000 if the 1.76000 support is broken.

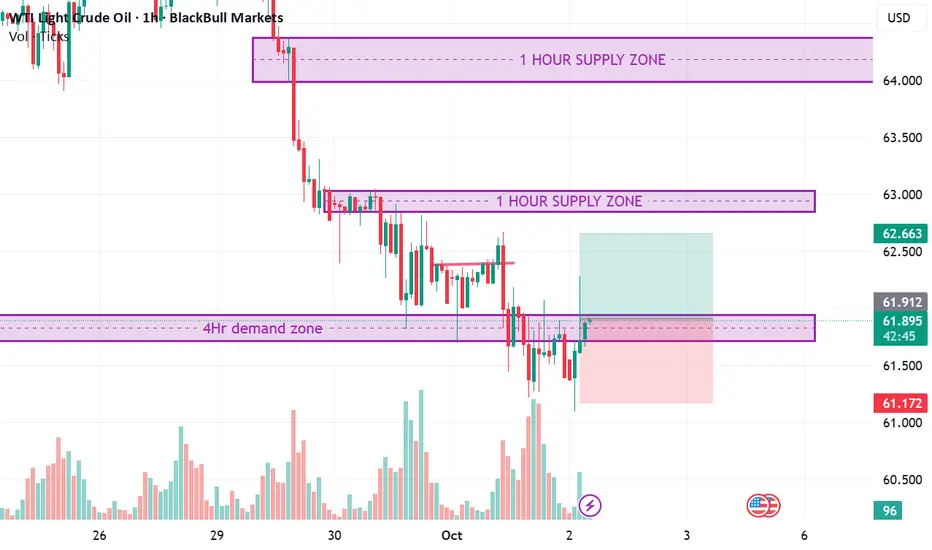
WTI RR 1:1 scalp. W bottomWTI RR 1:1 scalp. W bottom
Formation of a W bottom near an H4 demand zone area.
AUDUSD Double Top at KEY RESISTANCE LEVELPrice retested major resistance level tested more than twice at (0.66286-0.66200) and got rejected at the level forming Double Top followed by new lower high, Break of Short term Trendline in (H1) triggering entry.
